Senior Jobs in Scotland

Senior
UK > Scotland

The median Senior salary in Scotland is £55,000 per year, according to job vacancies posted during the 6 months leading to 1 May 2025.

The table below provides salary benchmarking and summary statistics, comparing them to the same period in the previous two years.

6 months to
1 May 2025
Same period 2024 Same period 2023
Rank 2 21 14
Rank change year-on-year +19 -7 -1
Permanent jobs requiring a Senior 733 1,003 702
As % of all permanent jobs advertised in Scotland 26.01% 14.89% 14.86%
As % of the Job Titles category 28.67% 15.37% 16.47%
Number of salaries quoted 364 488 389
10th Percentile £37,500 £46,250 £45,000
25th Percentile £51,250 £51,160 £52,500
Median annual salary (50th Percentile) £55,000 £60,000 £65,000
Median % change year-on-year -8.33% -7.69% +8.33%
75th Percentile £68,114 £67,500 £76,250
90th Percentile £85,000 £80,000 £88,750
UK median annual salary £62,000 £62,500 £70,000
% change year-on-year -0.80% -10.71% -

All Permanent IT Job Vacancies
Scotland

For comparison with the information above, the following table provides summary statistics for all permanent IT job vacancies in Scotland. Most job vacancies include a discernible job title that can be normalized. As such, the figures in the second row provide an indication of the number of permanent jobs in our overall sample.

Permanent vacancies in Scotland with a recognized job title 2,557 6,524 4,262
% of permanent jobs with a recognized job title 90.74% 96.85% 90.22%
Number of salaries quoted 1,368 2,620 2,315
10th Percentile £31,250 £27,750 £31,569
25th Percentile £44,000 £40,000 £41,250
Median annual salary (50th Percentile) £55,000 £52,500 £57,500
Median % change year-on-year +4.76% -8.70% +9.52%
75th Percentile £65,000 £65,000 £73,449
90th Percentile £83,738 £80,000 £85,000
UK median annual salary £57,500 £52,777 £60,000
% change year-on-year +8.95% -12.04% -

Senior
Job Vacancy Trend in Scotland

Job postings that featured Senior in the job title as a proportion of all IT jobs advertised in Scotland.
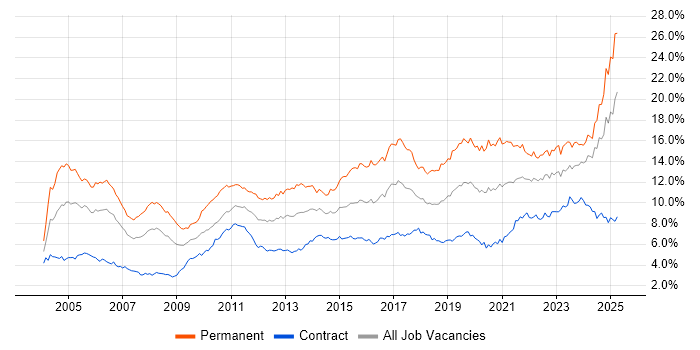
Job vacancy trend for Senior in Scotland

Senior
Salary Trend in Scotland

3-month moving average salary quoted in jobs citing Senior in Scotland.

Salary trend for Senior in Scotland

Senior
Salary Histogram in Scotland

Salary distribution for jobs citing Senior in Scotland over the 6 months to 1 May 2025.

Salary histogram for Senior in Scotland

Senior
Job Locations in Scotland

The table below looks at the demand and provides a guide to the median salaries quoted in IT jobs citing Senior within the Scotland region over the 6 months to 1 May 2025. The 'Rank Change' column provides an indication of the change in demand within each location based on the same 6 month period last year.

Location Rank Change
on Same Period
Last Year
Matching
Permanent
IT Job Ads
Median Salary
Past 6 Months
Median Salary
% Change
on Same Period
Last Year
Live
Jobs
Edinburgh -1 181 £65,000 +8.33% 103
Glasgow +29 90 £60,000 - 94
Renfrewshire +8 75 £51,645 -1.63% 50
Fife +10 62 £60,000 +9.09% 5
Moray - 56 £60,000 -
East Ayrshire - 55 £59,000 -
South Ayrshire - 53 £60,000 - 1
Inverclyde +2 52 £51,645 -13.93%
Midlothian +1 34 £26,929 - 11
Lanarkshire +17 21 £66,000 - 17
West Lothian +1 17 £62,500 +4.17% 7
East Lothian +3 10 £26,929 -23.06%
North Lanarkshire - 7 - - 2
Aberdeen -3 5 £50,000 -16.67% 20
Dundee +11 4 £52,500 -12.50% 18
Highlands +6 4 £40,000 -11.11% 2
Stirling +4 4 £44,067 +37.07% 2
South Lanarkshire +1 1 - - 1
Senior
UK

Senior Skill Set
Top 30 Co-occurring Skills and Capabilities in Scotland

For the 6 months to 1 May 2025, Senior job roles required the following skills and capabilities in order of popularity. The figures indicate the absolute number co-occurrences and as a proportion of all permanent job ads across the Scotland region featuring Senior in the job title.

1 352 (48.02%) Degree
2 324 (44.20%) BPSS Clearance
3 156 (21.28%) Finance
4 155 (21.15%) Social Skills
5 131 (17.87%) Decision-Making
5 131 (17.87%) Problem-Solving
6 124 (16.92%) Mentoring
7 123 (16.78%) Management Information System
8 117 (15.96%) Agile
9 115 (15.69%) Risk Management
10 102 (13.92%) Risk Assessment
11 101 (13.78%) Microsoft Office
12 99 (13.51%) Presentation Skills
13 98 (13.37%) Systems Engineering
13 98 (13.37%) IEC 61508
14 95 (12.96%) Software Engineering
15 85 (11.60%) Games
16 83 (11.32%) Coaching
17 78 (10.64%) Retail
18 75 (10.23%) Banking
19 71 (9.69%) Analytical Skills
20 70 (9.55%) FMEA
20 70 (9.55%) Def Stans
21 69 (9.41%) Mathematics
22 68 (9.28%) Telecoms
23 66 (9.00%) BT
24 64 (8.73%) Java
25 62 (8.46%) AWS
26 59 (8.05%) Chartered Engineer
27 56 (7.64%) Azure

Senior Skill Set
Co-occurring Skills and Capabilities in Scotland by Category

The follow tables expand on the table above by listing co-occurrences grouped by category. The same employment type, locality and period is covered with up to 20 co-occurrences shown in each of the following categories:

Application Platforms
1 6 (0.82%) Confluence
2 5 (0.68%) Apache
2 5 (0.68%) Apache Airflow
2 5 (0.68%) SAS
3 4 (0.55%) SharePoint
4 3 (0.41%) Apache Spark
4 3 (0.41%) NetWeaver
5 1 (0.14%) CMS
5 1 (0.14%) Microsoft Exchange
5 1 (0.14%) Mule
5 1 (0.14%) Umbraco
Applications
1 101 (13.78%) Microsoft Office
2 40 (5.46%) Windchill
3 2 (0.27%) Microsoft Project
4 1 (0.14%) Microsoft Excel
Business Applications
1 40 (5.46%) Teamcenter
2 8 (1.09%) Infor LN
2 8 (1.09%) SAP BPC
3 3 (0.41%) NetSuite
4 2 (0.27%) Aladdin
5 1 (0.14%) Dynamics CRM
5 1 (0.14%) SAP S/4HANA
Cloud Services
1 62 (8.46%) AWS
2 56 (7.64%) Azure
3 46 (6.28%) GCP
4 21 (2.86%) SaaS
5 13 (1.77%) GitHub
5 13 (1.77%) Power Platform
6 10 (1.36%) Microsoft 365
7 6 (0.82%) AWS Lambda
7 6 (0.82%) Azure DevOps
7 6 (0.82%) Serverless
8 5 (0.68%) Adobe Analytics
8 5 (0.68%) Azure Machine Learning
8 5 (0.68%) Google Analytics
9 4 (0.55%) CloudBees
9 4 (0.55%) OneDrive
10 3 (0.41%) dbt
10 3 (0.41%) IaaS
10 3 (0.41%) PaaS
11 2 (0.27%) Amazon EC2
11 2 (0.27%) Cloud Computing
Communications & Networking
1 11 (1.50%) TCP/IP
2 9 (1.23%) Modbus
3 8 (1.09%) VPN
4 7 (0.95%) Ethernet
4 7 (0.95%) RS-232
5 6 (0.82%) Wireless
6 4 (0.55%) DHCP
6 4 (0.55%) DNS
6 4 (0.55%) Firewall
6 4 (0.55%) HTTP
6 4 (0.55%) IPsec
6 4 (0.55%) SSL
6 4 (0.55%) VLAN
7 3 (0.41%) LAN
8 2 (0.27%) Cisco Nexus
8 2 (0.27%) Internet
9 1 (0.14%) Multicast
9 1 (0.14%) Network Security
9 1 (0.14%) RTP
9 1 (0.14%) RTSP
Database & Business Intelligence
1 17 (2.32%) MySQL
2 16 (2.18%) Tableau
3 12 (1.64%) PostgreSQL
4 11 (1.50%) Power BI
5 10 (1.36%) NoSQL
6 9 (1.23%) SQL Server
7 8 (1.09%) Big Data
8 5 (0.68%) DynamoDB
8 5 (0.68%) Elasticsearch
9 4 (0.55%) Data Warehouse
9 4 (0.55%) Geospatial Data
9 4 (0.55%) MongoDB
10 3 (0.41%) Amazon RDS
10 3 (0.41%) Looker
10 3 (0.41%) RDBMS
10 3 (0.41%) Relational Database
10 3 (0.41%) SAP HANA
11 2 (0.27%) Data Mining
11 2 (0.27%) Hadoop
11 2 (0.27%) SQL Server Reporting Services
Development Applications
1 22 (3.00%) Jenkins
2 20 (2.73%) Visual Studio
3 19 (2.59%) Git
4 13 (1.77%) JIRA
5 12 (1.64%) Oracle Forms
6 8 (1.09%) webpack
7 7 (0.95%) Cypress.io
7 7 (0.95%) GitLab
8 5 (0.68%) IBM UrbanCode
8 5 (0.68%) JUnit
9 4 (0.55%) Maven
10 3 (0.41%) SonarQube
10 3 (0.41%) Sonatype Nexus
11 2 (0.27%) Gradle
11 2 (0.27%) LabVIEW
11 2 (0.27%) Mockito
12 1 (0.14%) MLflow
12 1 (0.14%) Postman
12 1 (0.14%) Selenium
12 1 (0.14%) Subversion
General
1 156 (21.28%) Finance
2 155 (21.15%) Social Skills
3 99 (13.51%) Presentation Skills
4 85 (11.60%) Games
5 78 (10.64%) Retail
6 75 (10.23%) Banking
7 71 (9.69%) Analytical Skills
8 68 (9.28%) Telecoms
9 34 (4.64%) Inclusion and Diversity
10 30 (4.09%) Public Sector
11 26 (3.55%) Local Government
12 22 (3.00%) Electronics
13 8 (1.09%) Marketing
13 8 (1.09%) Police
14 7 (0.95%) Manufacturing
15 6 (0.82%) Financial Institution
16 4 (0.55%) Law
16 4 (0.55%) Legal
16 4 (0.55%) Tech for Good
16 4 (0.55%) Wholesale Banking
Libraries, Frameworks & Software Standards
1 42 (5.73%) HTML
2 41 (5.59%) CSS
3 36 (4.91%) React
4 23 (3.14%) .NET
5 19 (2.59%) Spring
5 19 (2.59%) Spring Boot
6 16 (2.18%) Node.js
7 15 (2.05%) AngularJS
8 14 (1.91%) Laravel
9 13 (1.77%) RESTful
10 10 (1.36%) .NET Framework
10 10 (1.36%) LAMP
11 9 (1.23%) Kafka
11 9 (1.23%) Redux
12 8 (1.09%) .NET Core
13 7 (0.95%) MFC
14 6 (0.82%) Playwright
15 5 (0.68%) GraphQL
15 5 (0.68%) Jest
16 4 (0.55%) Yocto
Miscellaneous
1 123 (16.78%) Management Information System
2 28 (3.82%) SCADA
3 16 (2.18%) Product Ownership
3 16 (2.18%) Public Cloud
4 13 (1.77%) Mobile App
5 12 (1.64%) Device Driver
6 10 (1.36%) Onboarding
7 7 (0.95%) Cloud Native
7 7 (0.95%) Greenfield Project
8 6 (0.82%) Distributed Systems
9 5 (0.68%) Mainframe
10 4 (0.55%) Replication
10 4 (0.55%) Self-Motivation
11 3 (0.41%) Enterprise Software
11 3 (0.41%) Life Science
11 3 (0.41%) Mobile Banking
11 3 (0.41%) Renewable Energy
11 3 (0.41%) Virtual Team
12 2 (0.27%) Credit Risk
12 2 (0.27%) FPGA
Operating Systems
1 41 (5.59%) Linux
2 23 (3.14%) Windows
3 16 (2.18%) Embedded Linux
4 13 (1.77%) Unix
5 8 (1.09%) Windows Server
6 5 (0.68%) Windows Server 2016
6 5 (0.68%) Windows Server 2019
7 2 (0.27%) Android
7 2 (0.27%) Red Hat Enterprise Linux
7 2 (0.27%) VMS
8 1 (0.14%) AIX
8 1 (0.14%) Apple iOS
8 1 (0.14%) FreeRTOS
8 1 (0.14%) Rocky
8 1 (0.14%) Solaris
8 1 (0.14%) VxWorks
Processes & Methodologies
1 131 (17.87%) Decision-Making
1 131 (17.87%) Problem-Solving
2 124 (16.92%) Mentoring
3 117 (15.96%) Agile
4 115 (15.69%) Risk Management
5 102 (13.92%) Risk Assessment
6 98 (13.37%) Systems Engineering
7 95 (12.96%) Software Engineering
8 83 (11.32%) Coaching
9 70 (9.55%) FMEA
10 69 (9.41%) Mathematics
11 50 (6.82%) CI/CD
12 47 (6.41%) Data Management
13 45 (6.14%) DevOps
14 44 (6.00%) Configuration Management
14 44 (6.00%) Microservices
15 42 (5.73%) Project Management
16 40 (5.46%) 3D Modelling
16 40 (5.46%) PDM
16 40 (5.46%) PLM
Programming Languages
1 64 (8.73%) Java
2 50 (6.82%) JavaScript
3 43 (5.87%) C++
3 43 (5.87%) SQL
4 41 (5.59%) Python
5 31 (4.23%) C
6 28 (3.82%) TypeScript
7 27 (3.68%) C#
8 21 (2.86%) PHP
9 11 (1.50%) Go
9 11 (1.50%) PowerShell
10 9 (1.23%) Rust
11 8 (1.09%) Bash
12 5 (0.68%) JCL
12 5 (0.68%) Shell Script
13 3 (0.41%) ABAP
13 3 (0.41%) Embedded C
14 2 (0.27%) Ruby
15 1 (0.14%) Objective-C
15 1 (0.14%) VB
Qualifications
1 352 (48.02%) Degree
2 324 (44.20%) BPSS Clearance
3 59 (8.05%) Chartered Engineer
4 34 (4.64%) ACCA
5 28 (3.82%) Numerate Degree
6 17 (2.32%) Master's Degree
7 14 (1.91%) CISSP
8 8 (1.09%) CIMA
9 5 (0.68%) Microsoft Certification
9 5 (0.68%) SC Cleared
9 5 (0.68%) Security Cleared
10 4 (0.55%) CISA
10 4 (0.55%) Computer Science Degree
10 4 (0.55%) Oracle Certification
11 2 (0.27%) CCA
11 2 (0.27%) CCIE
11 2 (0.27%) CCNP
11 2 (0.27%) Cisco Certification
11 2 (0.27%) CISM
12 1 (0.14%) ISEB
Quality Assurance & Compliance
1 98 (13.37%) IEC 61508
2 70 (9.55%) Def Stans
3 34 (4.64%) GAAP
3 34 (4.64%) IFRS
4 28 (3.82%) ARP4754
4 28 (3.82%) DO-254
5 23 (3.14%) HAZOP
6 12 (1.64%) QA
7 10 (1.36%) Accessibility
8 4 (0.55%) Cyber Essentials
8 4 (0.55%) PCI DSS
8 4 (0.55%) Sarbanes-Oxley
9 2 (0.27%) ISO/IEC 27001
9 2 (0.27%) ITGC
9 2 (0.27%) SOC 2
10 1 (0.14%) SLA
10 1 (0.14%) WCAG
System Software
1 25 (3.41%) Docker
2 13 (1.77%) Embedded Firmware
2 13 (1.77%) Firmware
3 8 (1.09%) Hyper-V
4 3 (0.41%) VMware Infrastructure
5 2 (0.27%) Active Directory
Systems Management
1 26 (3.55%) Kubernetes
2 23 (3.14%) Functional Safety
3 18 (2.46%) Terraform
4 7 (0.95%) Ansible
5 5 (0.68%) CA Endevor
6 4 (0.55%) Dell DRAC
7 3 (0.41%) Grafana
7 3 (0.41%) Prometheus
8 2 (0.27%) Istio
8 2 (0.27%) Microsoft Intune
8 2 (0.27%) Puppet
9 1 (0.14%) Kubeflow
9 1 (0.14%) Opsgenie
9 1 (0.14%) Progress Chef
9 1 (0.14%) Single Sign-On
Vendors
1 66 (9.00%) BT
2 13 (1.77%) Microsoft
2 13 (1.77%) Oracle
3 12 (1.64%) SAP
4 8 (1.09%) Cognos
4 8 (1.09%) Infor
5 6 (0.82%) Google
6 5 (0.68%) Adobe
6 5 (0.68%) IBM
7 4 (0.55%) IBM Sterling
7 4 (0.55%) Tealium
8 3 (0.41%) VMware
9 2 (0.27%) Charles River
9 2 (0.27%) Cisco
9 2 (0.27%) EMC
9 2 (0.27%) Mentor Graphics
9 2 (0.27%) New Relic
9 2 (0.27%) Red Hat
9 2 (0.27%) ServiceNow
9 2 (0.27%) Twitter