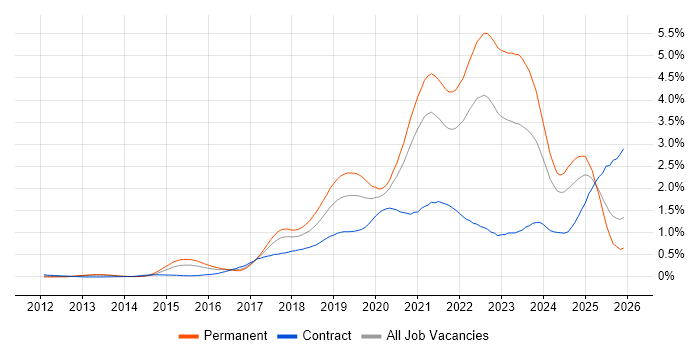
GCP Jobs in the South West

Google Cloud Platform (GCP)
England > South West

The following table provides summary statistics for permanent job vacancies advertised in the South West with a requirement for GCP skills. Included is a benchmarking guide to the salaries offered in vacancies that have cited GCP over the 6 months to 25 April 2024 with a comparison to the same period in the previous 2 years.

6 months to
25 Apr 2024
Same period 2023 Same period 2022
Rank 87 66 88
Rank change year-on-year -21 +22 -12
Permanent jobs citing GCP 283 329 299
As % of all permanent jobs advertised in the South West 3.09% 4.68% 3.78%
As % of the Cloud Services category 10.31% 12.18% 8.98%
Number of salaries quoted 166 212 191
10th Percentile £37,000 £37,885 £38,750
25th Percentile £47,813 £46,250 £47,500
Median annual salary (50th Percentile) £70,000 £65,000 £60,000
Median % change year-on-year +7.69% +8.33% +14.29%
75th Percentile £85,000 £84,056 £75,000
90th Percentile £95,769 £109,250 £86,250
England median annual salary £80,000 £80,000 £80,000
% change year-on-year - - +10.34%

All Cloud Skills
South West

GCP is in the Cloud Services category. The following table is for comparison with the above and provides summary statistics for all permanent job vacancies advertised in the South West with a requirement for cloud computing skills.

Permanent vacancies with a requirement for cloud computing skills 2,744 2,701 3,328
As % of all permanent jobs advertised in the South West 30.00% 38.39% 42.09%
Number of salaries quoted 2,118 1,702 2,438
10th Percentile £29,000 £30,025 £31,250
25th Percentile £37,813 £38,750 £38,750
Median annual salary (50th Percentile) £52,500 £52,500 £51,500
Median % change year-on-year - +1.94% +8.87%
75th Percentile £70,000 £70,000 £70,000
90th Percentile £82,500 £82,500 £85,000
England median annual salary £57,500 £65,000 £62,500
% change year-on-year -11.54% +4.00% +4.17%

GCP
Job Vacancy Trend in the South West

Job postings citing GCP as a proportion of all IT jobs advertised in the South West.

Job vacancy trend for GCP in the South West

GCP
Salary Trend in the South West

3-month moving average salary quoted in jobs citing GCP in the South West.

Salary trend for GCP in the South West

GCP
Salary Histogram in the South West

Salary distribution for jobs citing GCP in the South West over the 6 months to 25 April 2024.

Salary histogram for GCP in the South West

GCP
Job Locations in the South West

The table below looks at the demand and provides a guide to the median salaries quoted in IT jobs citing GCP within the South West region over the 6 months to 25 April 2024. The 'Rank Change' column provides an indication of the change in demand within each location based on the same 6 month period last year.

Location Rank Change
on Same Period
Last Year
Matching
Permanent
IT Job Ads
Median Salary
Past 6 Months
Median Salary
% Change
on Same Period
Last Year
Live
Jobs
Bristol -21 136 £77,500 +12.10% 35
Gloucestershire +12 50 £70,000 -1.75% 20
Dorset -11 28 £37,000 -10.03% 3
Devon +2 19 £40,000 -14.07% 5
Somerset 0 19 £66,250 +32.50%
Wiltshire +6 17 £80,000 -15.79% 3
Cornwall - 9 £45,000 - 1
GCP
England

GCP
Co-occurring Skills and Capabilities in the South West by Category

The follow tables expand on the table above by listing co-occurrences grouped by category. The same employment type, locality and period is covered with up to 20 co-occurrences shown in each of the following categories:

Application Platforms
1 29 (10.25%) Apache Spark
2 27 (9.54%) Microsoft Exchange
3 25 (8.83%) Apache
4 6 (2.12%) Apache Airflow
4 6 (2.12%) SharePoint
5 4 (1.41%) SharePoint 2010
5 4 (1.41%) SharePoint 2013
6 3 (1.06%) Captiva
6 3 (1.06%) FileNet
6 3 (1.06%) WebSphere
7 2 (0.71%) Apache Solr
7 2 (0.71%) nginx
8 1 (0.35%) CMS
8 1 (0.35%) Confluence
8 1 (0.35%) Luigi
8 1 (0.35%) Mule
Business Applications
1 2 (0.71%) SAP FI-GL
Cloud Services
1 187 (66.08%) AWS
2 181 (63.96%) Azure
3 43 (15.19%) Microsoft 365
4 36 (12.72%) Azure DevOps
5 27 (9.54%) GitHub
6 23 (8.13%) SaaS
7 20 (7.07%) GitHub Actions
8 17 (6.01%) Serverless
9 15 (5.30%) AWS CloudFormation
10 14 (4.95%) Amazon EKS
11 13 (4.59%) AWS Lambda
11 13 (4.59%) OpenShift
12 12 (4.24%) OCI
13 11 (3.89%) Cloud Computing
13 11 (3.89%) Datadog
13 11 (3.89%) Power Platform
14 10 (3.53%) PaaS
15 9 (3.18%) IaaS
16 6 (2.12%) Snowflake
16 6 (2.12%) Vertex AI
Communications & Networking
1 21 (7.42%) Firewall
2 13 (4.59%) AMQP
2 13 (4.59%) LAN
2 13 (4.59%) WAN
3 7 (2.47%) SAN
4 6 (2.12%) DNS
4 6 (2.12%) Network Security
4 6 (2.12%) Software-Defined Networking
5 5 (1.77%) GSM
5 5 (1.77%) MPLS
5 5 (1.77%) NetScaler
5 5 (1.77%) PABX
5 5 (1.77%) VLAN
5 5 (1.77%) VSAT
5 5 (1.77%) Wi-Fi
5 5 (1.77%) WLAN
6 3 (1.06%) Cisco ASA
6 3 (1.06%) SD-WAN
7 2 (0.71%) HTTPS
7 2 (0.71%) IPsec
Database & Business Intelligence
1 89 (31.45%) BigQuery
2 76 (26.86%) Looker
3 64 (22.61%) Data Warehouse
4 35 (12.37%) Big Data
5 28 (9.89%) MySQL
6 27 (9.54%) NoSQL
7 26 (9.19%) Data Lake
8 24 (8.48%) Hadoop
8 24 (8.48%) SQL Server
9 21 (7.42%) Relational Database
10 13 (4.59%) Cloudera CDH
11 11 (3.89%) PostgreSQL
11 11 (3.89%) Tableau
12 8 (2.83%) Flink
12 8 (2.83%) Power BI
13 7 (2.47%) Bigtable
14 5 (1.77%) Airbyte
14 5 (1.77%) Amazon Redshift
14 5 (1.77%) Redshift Spectrum
15 4 (1.41%) Oracle Database
Development Applications
1 24 (8.48%) Jenkins
2 23 (8.13%) Git
3 14 (4.95%) Oracle Forms
4 9 (3.18%) GitLab
4 9 (3.18%) Maven
5 6 (2.12%) JIRA
6 5 (1.77%) Selenium
6 5 (1.77%) SonarQube
7 4 (1.41%) IBM UrbanCode
8 1 (0.35%) Bitbucket
8 1 (0.35%) Sonatype Nexus
General
1 77 (27.21%) Analytical Skills
2 71 (25.09%) Finance
3 61 (21.55%) Banking
4 32 (11.31%) Billing
5 23 (8.13%) Retail
6 17 (6.01%) Social Skills
7 16 (5.65%) Presentation Skills
8 13 (4.59%) Aerospace
9 12 (4.24%) Tech for Good
10 8 (2.83%) Influencing Skills
11 3 (1.06%) Retail Banking
11 3 (1.06%) Telecoms
12 2 (0.71%) General Ledger
12 2 (0.71%) Public Sector
12 2 (0.71%) Publishing
13 1 (0.35%) Documentation Skills
13 1 (0.35%) Health Technology
13 1 (0.35%) Inclusion and Diversity
13 1 (0.35%) Legal
Job Titles
1 47 (16.61%) Data Engineer
2 41 (14.49%) Senior
3 37 (13.07%) Architect
3 37 (13.07%) Data Manager
4 36 (12.72%) Software Engineer
5 34 (12.01%) Developer
5 34 (12.01%) Engineering Manager
6 29 (10.25%) DevOps Engineer
7 25 (8.83%) Platform Engineer
7 25 (8.83%) Principal Data Engineer
7 25 (8.83%) Principal Engineer
8 18 (6.36%) 2nd Line Support
9 17 (6.01%) Lead
10 15 (5.30%) Senior DevOps
10 15 (5.30%) Senior DevOps Engineer
10 15 (5.30%) Software Developer
11 14 (4.95%) 2nd Line Engineer
11 14 (4.95%) 2nd Line Support Engineer
11 14 (4.95%) Support Engineer
12 13 (4.59%) DV Cleared Software Engineer
Libraries, Frameworks & Software Standards
1 42 (14.84%) React
2 32 (11.31%) AngularJS
3 27 (9.54%) Node.js
4 24 (8.48%) Kafka
5 21 (7.42%) REST
5 21 (7.42%) Spring
6 17 (6.01%) Spring Boot
7 16 (5.65%) gRPC
7 16 (5.65%) RabbitMQ
8 13 (4.59%) Material-UI
8 13 (4.59%) OpenAPI
8 13 (4.59%) Swagger
9 12 (4.24%) CSS
9 12 (4.24%) HTML
10 10 (3.53%) .NET
10 10 (3.53%) Apache Beam
10 10 (3.53%) RESTful
11 6 (2.12%) Symfony
11 6 (2.12%) Vue
12 5 (1.77%) jQuery
Miscellaneous
1 47 (16.61%) Product Ownership
2 33 (11.66%) Self-Motivation
3 30 (10.60%) Public Cloud
4 20 (7.07%) Cloud Native
5 11 (3.89%) Data Centre
6 10 (3.53%) Data Structures
7 9 (3.18%) Private Cloud
8 8 (2.83%) Algorithms
9 7 (2.47%) PKI
9 7 (2.47%) VAX
10 6 (2.12%) CCTV
11 5 (1.77%) Greenfield Project
11 5 (1.77%) Management Information System
11 5 (1.77%) Replication
11 5 (1.77%) Virtual Team
12 4 (1.41%) Blockchain
12 4 (1.41%) Distributed Systems
12 4 (1.41%) Mainframe
13 3 (1.06%) DataPower
13 3 (1.06%) Taxonomies
Operating Systems
1 39 (13.78%) Linux
2 27 (9.54%) Windows
3 19 (6.71%) Red Hat Enterprise Linux
4 18 (6.36%) Windows Server
5 13 (4.59%) CentOS
5 13 (4.59%) Debian
5 13 (4.59%) Ubuntu
6 11 (3.89%) Unix
7 7 (2.47%) Windows 10
7 7 (2.47%) Windows 7
7 7 (2.47%) Windows Server 2008
7 7 (2.47%) Windows Server 2016
8 6 (2.12%) Apple iOS
9 4 (1.41%) Android
Processes & Methodologies
1 159 (56.18%) Agile
2 115 (40.64%) DevOps
3 95 (33.57%) Problem-Solving
4 94 (33.22%) Data Engineering
5 74 (26.15%) CI/CD
6 70 (24.73%) Platform Engineering
7 60 (21.20%) ETL
7 60 (21.20%) Scrum
8 53 (18.73%) Data Modelling
9 52 (18.37%) Data Pipeline
10 50 (17.67%) Software Engineering
11 48 (16.96%) Mentoring
12 42 (14.84%) Infrastructure as Code
12 42 (14.84%) Project Management
13 38 (13.43%) Collaborative Working
14 36 (12.72%) Line Management
15 33 (11.66%) Containerisation
16 32 (11.31%) Backlog Management
16 32 (11.31%) Business Strategy
16 32 (11.31%) Product Backlog
Programming Languages
1 66 (23.32%) Java
2 62 (21.91%) Python
3 51 (18.02%) SQL
4 43 (15.19%) JavaScript
5 21 (7.42%) TypeScript
6 15 (5.30%) Go
6 15 (5.30%) Scala
7 14 (4.95%) C#
8 11 (3.89%) PHP
9 9 (3.18%) Bash
10 7 (2.47%) PowerShell
10 7 (2.47%) Rust
11 4 (1.41%) Kotlin
12 3 (1.06%) Shell Script
13 2 (0.71%) Bicep
13 2 (0.71%) C++
14 1 (0.35%) Embedded C++
14 1 (0.35%) Groovy
14 1 (0.35%) Ruby
14 1 (0.35%) VB
Qualifications
1 43 (15.19%) Security Cleared
2 28 (9.89%) SC Cleared
3 26 (9.19%) DV Cleared
4 20 (7.07%) Degree
5 6 (2.12%) Computer Science Degree
6 4 (1.41%) MCITP
6 4 (1.41%) MCSE
6 4 (1.41%) Microsoft Certification
7 2 (0.71%) CompTIA Security+
7 2 (0.71%) Network+ Certification
8 1 (0.35%) CCNP
8 1 (0.35%) CCSP
8 1 (0.35%) Cisco Certification
8 1 (0.35%) CISSP
8 1 (0.35%) Numerate Degree
8 1 (0.35%) OCP
8 1 (0.35%) Oracle Certification
Quality Assurance & Compliance
1 34 (12.01%) QA
2 33 (11.66%) GDPR
3 15 (5.30%) Data Quality
4 8 (2.83%) ISO/IEC 27001
5 4 (1.41%) SLA
6 2 (0.71%) Cyber Essentials
6 2 (0.71%) NIST
7 1 (0.35%) GRC
7 1 (0.35%) HIPAA
7 1 (0.35%) PCI DSS
7 1 (0.35%) SOC 2
System Software
1 53 (18.73%) Docker
2 28 (9.89%) VMware Infrastructure
3 27 (9.54%) Active Directory
4 19 (6.71%) Hyper-V
5 13 (4.59%) XenApp
6 8 (2.83%) XenDesktop
7 4 (1.41%) VMware Workstation
8 2 (0.71%) Apache Flume
Systems Management
1 80 (28.27%) Kubernetes
2 56 (19.79%) Terraform
3 25 (8.83%) Ansible
4 21 (7.42%) Puppet
5 16 (5.65%) Prometheus
6 12 (4.24%) Nagios
7 11 (3.89%) Grafana
8 10 (3.53%) Microsoft Intune
9 8 (2.83%) Progress Chef
9 8 (2.83%) SCCM
10 7 (2.47%) EMC VPLEX
11 5 (1.77%) Argo
11 5 (1.77%) OfficeScan
11 5 (1.77%) WSUS
12 4 (1.41%) Istio
13 2 (0.71%) CASB
14 1 (0.35%) Consul
14 1 (0.35%) Packer
Vendors
1 180 (63.60%) Google
2 63 (22.26%) Microsoft
3 36 (12.72%) VMware
4 31 (10.95%) Oracle
5 22 (7.77%) Red Hat
6 16 (5.65%) Cisco
7 15 (5.30%) Citrix
8 13 (4.59%) SaltStack
9 12 (4.24%) Centreon
10 9 (3.18%) HP
11 8 (2.83%) Dell
11 8 (2.83%) EMC
11 8 (2.83%) Symantec
11 8 (2.83%) Teradata
12 7 (2.47%) Sybase
12 7 (2.47%) Veeam
13 6 (2.12%) SAP
14 5 (1.77%) Alcatel-Lucent
14 5 (1.77%) CheckPoint
14 5 (1.77%) Fortinet