PowerShell Jobs in the South West

Windows PowerShell
England > South West

The table below provides summary statistics for permanent job vacancies advertised in the South West requiring PowerShell skills. It includes a benchmarking guide to the annual salaries offered in vacancies that cited PowerShell over the 6 months leading up to 26 July 2024, comparing them to the same period in the previous two years.

6 months to
26 Jul 2024
Same period 2023 Same period 2022
Rank 106 79 98
Rank change year-on-year -27 +19 -33
Permanent jobs citing PowerShell 189 242 311
As % of all permanent jobs advertised in the South West 2.15% 3.89% 3.40%
As % of the Programming Languages category 8.11% 10.50% 7.22%
Number of salaries quoted 106 121 228
10th Percentile £31,500 £28,500 £31,680
25th Percentile £36,563 £40,000 £36,250
Median annual salary (50th Percentile) £50,000 £52,500 £47,500
Median % change year-on-year -4.76% +10.53% +5.56%
75th Percentile £56,938 £73,750 £58,813
90th Percentile £61,084 £85,000 £69,125
England median annual salary £57,500 £60,000 £58,500
% change year-on-year -4.17% +2.56% +6.36%

All Programming Languages
South West

PowerShell falls under the Programming Languages category. For comparison with the information above, the following table provides summary statistics for all permanent job vacancies requiring coding skills in the South West.

Permanent vacancies with a requirement for coding skills 2,330 2,305 4,309
As % of all permanent jobs advertised in the South West 26.50% 37.04% 47.09%
Number of salaries quoted 1,711 1,609 2,766
10th Percentile £32,500 £33,000 £31,680
25th Percentile £42,500 £42,500 £38,750
Median annual salary (50th Percentile) £55,000 £55,000 £52,500
Median % change year-on-year - +4.76% +10.53%
75th Percentile £68,750 £71,250 £68,750
90th Percentile £80,000 £82,500 £82,500
England median annual salary £60,000 £65,000 £62,500
% change year-on-year -7.69% +4.00% +8.70%

PowerShell
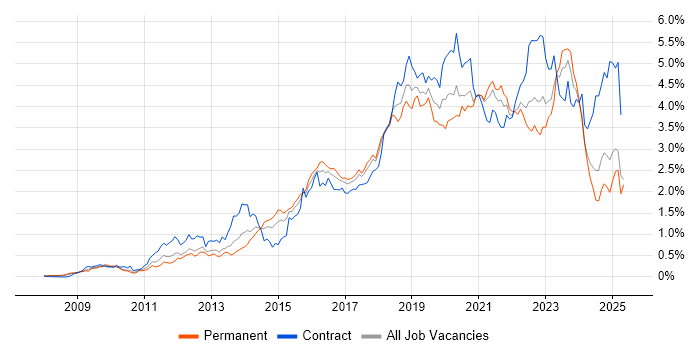
Job Vacancy Trend in the South West

Job postings citing PowerShell as a proportion of all IT jobs advertised in the South West.

Job vacancy trend for PowerShell in the South West

PowerShell
Salary Trend in the South West

3-month moving average salary quoted in jobs citing PowerShell in the South West.

Salary trend for PowerShell in the South West

PowerShell
Salary Histogram in the South West

Salary distribution for jobs citing PowerShell in the South West over the 6 months to 26 July 2024.

Salary histogram for PowerShell in the South West

PowerShell
Job Locations in the South West

The table below looks at the demand and provides a guide to the median salaries quoted in IT jobs citing PowerShell within the South West region over the 6 months to 26 July 2024. The 'Rank Change' column provides an indication of the change in demand within each location based on the same 6 month period last year.

Location Rank Change
on Same Period
Last Year
Matching
Permanent
IT Job Ads
Median Salary
Past 6 Months
Median Salary
% Change
on Same Period
Last Year
Live
Jobs
Gloucestershire -3 86 £52,500 -6.25% 5
Bristol -30 37 £43,750 -20.45% 15
Wiltshire +3 30 £50,500 -17.55% 3
Devon +2 19 £40,603 +29.10% 3
Somerset +8 8 £48,750 -2.68% 9
Dorset -17 8 £50,000 +17.65% 1
PowerShell
England

PowerShell
Co-occurring Skills and Capabilities in the South West by Category

The follow tables expand on the table above by listing co-occurrences grouped by category. The same employment type, locality and period is covered with up to 20 co-occurrences shown in each of the following categories:

Application Platforms
1 36 (19.05%) Microsoft Exchange
2 34 (17.99%) SharePoint
3 1 (0.53%) IIS
Applications
1 21 (11.11%) Microsoft Office
2 1 (0.53%) Microsoft Excel
Cloud Services
1 98 (51.85%) Azure
2 68 (35.98%) Microsoft 365
3 40 (21.16%) AWS
3 40 (21.16%) SaaS
4 30 (15.87%) Entra ID
5 27 (14.29%) OpenShift
6 21 (11.11%) IaaS
7 17 (8.99%) PaaS
8 14 (7.41%) Power Platform
9 12 (6.35%) OneDrive
10 3 (1.59%) AWS CloudFormation
10 3 (1.59%) Azure Storage
10 3 (1.59%) GCP
10 3 (1.59%) Mimecast
11 2 (1.06%) Dynamics 365
11 2 (1.06%) GitHub
11 2 (1.06%) GitHub Actions
11 2 (1.06%) Power Automate
11 2 (1.06%) WhatsApp
12 1 (0.53%) Serverless
Communications & Networking
1 48 (25.40%) DNS
2 37 (19.58%) DHCP
3 35 (18.52%) TCP/IP
4 34 (17.99%) Firewall
5 30 (15.87%) SAN
6 24 (12.70%) HTTP
6 24 (12.70%) WAN
7 14 (7.41%) SD-WAN
8 13 (6.88%) LAN
8 13 (6.88%) Remote Desktop
9 10 (5.29%) Wireless
10 8 (4.23%) Internet
11 7 (3.70%) Skype
12 6 (3.17%) NAS
13 5 (2.65%) Fibre Channel
14 3 (1.59%) Network Security
14 3 (1.59%) VSAN
15 2 (1.06%) IP Telephony
15 2 (1.06%) VoIP
16 1 (0.53%) WLAN
Database & Business Intelligence
1 27 (14.29%) MongoDB
2 12 (6.35%) SQL Server
3 7 (3.70%) MySQL
4 3 (1.59%) SQL Server Integration Services
5 2 (1.06%) Data Warehouse
5 2 (1.06%) Power BI
6 1 (0.53%) Amazon RDS
6 1 (0.53%) SQL Server Reporting Services
Development Applications
1 7 (3.70%) Artifactory
1 7 (3.70%) Vagrant
2 5 (2.65%) Jenkins
3 3 (1.59%) Bitbucket
3 3 (1.59%) Eclipse
3 3 (1.59%) Git
3 3 (1.59%) JMeter
3 3 (1.59%) MSI
3 3 (1.59%) Robot Framework
3 3 (1.59%) SonarQube
3 3 (1.59%) SQL Server Management Studio (SSMS)
4 2 (1.06%) Visual Studio
5 1 (0.53%) TeamCity
General
1 34 (17.99%) Finance
2 29 (15.34%) Aerospace
3 27 (14.29%) Social Skills
4 19 (10.05%) Inclusion and Diversity
5 16 (8.47%) Public Sector
6 15 (7.94%) Legal
7 10 (5.29%) Analytical Skills
8 7 (3.70%) Banking
9 5 (2.65%) Military
10 3 (1.59%) Marketing
10 3 (1.59%) Social Housing
11 2 (1.06%) Games
11 2 (1.06%) Law
11 2 (1.06%) Welsh Language
12 1 (0.53%) Documentation Skills
12 1 (0.53%) Manufacturing
12 1 (0.53%) Retail
Job Titles
1 77 (40.74%) Infrastructure Engineer
2 43 (22.75%) Senior
3 34 (17.99%) Administrator
4 30 (15.87%) Senior Infrastructure Engineer
5 25 (13.23%) DBA
6 24 (12.70%) DV Cleared DBA
7 17 (8.99%) DevOps Engineer
7 17 (8.99%) Support Engineer
8 15 (7.94%) Analyst
9 14 (7.41%) 3rd Line Engineer
9 14 (7.41%) 3rd Line Infrastructure Engineer
9 14 (7.41%) 3rd Line Support
10 12 (6.35%) IT Engineer
11 11 (5.82%) 2nd/3rd Line Infrastructure Engineer
11 11 (5.82%) 2nd/3rd Line Support
11 11 (5.82%) 2nd/3rd Line Support Engineer
11 11 (5.82%) 3rd Line Infrastructure Support
11 11 (5.82%) 3rd Line Support Engineer
11 11 (5.82%) Infrastructure Support
11 11 (5.82%) Infrastructure Support Engineer
Libraries, Frameworks & Software Standards
1 7 (3.70%) YAML
2 3 (1.59%) Elastic Stack
2 3 (1.59%) Software Packaging
3 2 (1.06%) JSON
3 2 (1.06%) REST
3 2 (1.06%) RESTful
3 2 (1.06%) XML
4 1 (0.53%) CSS
4 1 (0.53%) HTML
4 1 (0.53%) HTML5 Canvas
Miscellaneous
1 13 (6.88%) Replication
2 11 (5.82%) Driving Licence
3 10 (5.29%) Clustering
3 10 (5.29%) Management Information System
4 8 (4.23%) Self-Motivation
5 7 (3.70%) Cloud Native
5 7 (3.70%) Cyberattack
5 7 (3.70%) PKI
6 6 (3.17%) Data Centre
7 5 (2.65%) Fat Client
7 5 (2.65%) Thin Client
8 3 (1.59%) Client/Server
8 3 (1.59%) VAX
9 2 (1.06%) Distributed Denial-of-Service
9 2 (1.06%) iPhone
9 2 (1.06%) Onboarding
10 1 (0.53%) CSOC
10 1 (0.53%) Cyber Threat
10 1 (0.53%) Security Posture
10 1 (0.53%) Team-Oriented Environment
Operating Systems
1 132 (69.84%) Windows
2 84 (44.44%) Linux
3 43 (22.75%) Windows Server 2016
4 42 (22.22%) Windows Server
5 39 (20.63%) Windows Server 2012
6 36 (19.05%) Windows Server 2019
7 32 (16.93%) Red Hat Enterprise Linux
8 26 (13.76%) CentOS
9 21 (11.11%) Windows 10
10 9 (4.76%) Apple iOS
11 8 (4.23%) Android
12 5 (2.65%) Unix
13 3 (1.59%) Windows 7
13 3 (1.59%) Windows Server 2008
14 2 (1.06%) Windows 2000
14 2 (1.06%) Windows 8
14 2 (1.06%) Windows XP
15 1 (0.53%) Debian
15 1 (0.53%) Ubuntu
Processes & Methodologies
1 79 (41.80%) Infrastructure Engineering
2 52 (27.51%) DevOps
3 35 (18.52%) Agile
4 33 (17.46%) Actionable Insight
5 32 (16.93%) Mentoring
6 29 (15.34%) Collaborative Working
7 28 (14.81%) ITIL
8 25 (13.23%) Performance Monitoring
9 24 (12.70%) Capacity Management
9 24 (12.70%) Database Tuning
9 24 (12.70%) Software Architecture
9 24 (12.70%) Storage Management
9 24 (12.70%) User Experience
10 22 (11.64%) Problem-Solving
11 20 (10.58%) Infrastructure as Code
12 19 (10.05%) CI/CD
13 17 (8.99%) Roadmaps
14 13 (6.88%) Customer Service
14 13 (6.88%) Cybersecurity
15 10 (5.29%) Service Delivery
Programming Languages
1 75 (39.68%) Bash
2 46 (24.34%) Python
3 45 (23.81%) SQL
4 25 (13.23%) Java
5 10 (5.29%) C#
5 10 (5.29%) Ruby
6 8 (4.23%) JavaScript
7 7 (3.70%) C++
7 7 (3.70%) Go
8 4 (2.12%) Perl
8 4 (2.12%) T-SQL
9 3 (1.59%) Bicep
10 2 (1.06%) Lua
10 2 (1.06%) Shell Script
10 2 (1.06%) Tcl
11 1 (0.53%) VB
Qualifications
1 75 (39.68%) Security Cleared
2 60 (31.75%) DV Cleared
3 34 (17.99%) SC Cleared
4 24 (12.70%) Degree
5 11 (5.82%) MCP
6 9 (4.76%) Microsoft Certification
7 8 (4.23%) CCA
7 8 (4.23%) Citrix Certification
8 7 (3.70%) DBS Check
9 5 (2.65%) Computer Science Degree
10 4 (2.12%) MCSE
11 3 (1.59%) Azure Certification
12 2 (1.06%) BPSS Clearance
12 2 (1.06%) MCDST
12 2 (1.06%) MCITP
12 2 (1.06%) MCSA
13 1 (0.53%) CCNA
13 1 (0.53%) Cisco Certification
13 1 (0.53%) Microsoft Certified Master
13 1 (0.53%) VMware Certified Professional (VCP)
Quality Assurance & Compliance
1 3 (1.59%) ISO/IEC 27001
2 2 (1.06%) QA
3 1 (0.53%) Data Quality
3 1 (0.53%) GDPR
3 1 (0.53%) ISO/IEC 27002 (supersedes ISO/IEC 17799)
3 1 (0.53%) NIST
System Software
1 66 (34.92%) Active Directory
2 62 (32.80%) VMware Infrastructure
3 54 (28.57%) Hyper-V
4 33 (17.46%) Docker
5 14 (7.41%) vSphere
6 11 (5.82%) XenApp
7 9 (4.76%) Virtual Machines
8 8 (4.23%) XenDesktop
9 6 (3.17%) Virtual Desktop
10 5 (2.65%) Microsoft App-V
10 5 (2.65%) RACF
10 5 (2.65%) VMware NSX
11 3 (1.59%) Terminal Services
11 3 (1.59%) VMware ESXi
12 1 (0.53%) Firmware
12 1 (0.53%) KVM
12 1 (0.53%) Virtual Servers
Systems Management
1 33 (17.46%) Kubernetes
2 32 (16.93%) Ansible
3 28 (14.81%) Microsoft Intune
4 27 (14.29%) SCCM
5 26 (13.76%) Puppet
6 18 (9.52%) Terraform
7 8 (4.23%) Backup Exec
7 8 (4.23%) Microsoft Clustering
7 8 (4.23%) Symantec Endpoint Protection
8 7 (3.70%) Packer
9 6 (3.17%) Active Directory Federation Services
9 6 (3.17%) Microsoft Data Protection Manager
10 5 (2.65%) Failover Clustering
10 5 (2.65%) SCOM
11 4 (2.12%) SCVMM
12 3 (1.59%) EMC VPLEX
12 3 (1.59%) McAfee ePO
12 3 (1.59%) Nagios
13 2 (1.06%) Progress Chef
13 2 (1.06%) vRealize
Vendors
1 108 (57.14%) Microsoft
2 78 (41.27%) VMware
3 58 (30.69%) Red Hat
4 29 (15.34%) Oracle
5 17 (8.99%) Citrix
5 17 (8.99%) Veeam
6 9 (4.76%) Cisco
6 9 (4.76%) Dell
7 8 (4.23%) Fortinet
7 8 (4.23%) N-able
7 8 (4.23%) Symantec
7 8 (4.23%) Veritas
8 7 (3.70%) ServiceNow
9 5 (2.65%) CyberArk
10 4 (2.12%) HP
11 3 (1.59%) Atlassian
11 3 (1.59%) Centreon
11 3 (1.59%) EMC
11 3 (1.59%) McAfee
11 3 (1.59%) Sybase