Linux Jobs in the South West

Linux
England > South West

The table below provides summary statistics for permanent job vacancies advertised in the South West requiring Linux skills. It includes a benchmarking guide to the annual salaries offered in vacancies that cited Linux over the 6 months leading up to 7 June 2025, comparing them to the same period in the previous two years.

6 months to
7 Jun 2025
Same period 2024 Same period 2023
Rank 37 17 19
Rank change year-on-year -20 +2 -2
Permanent jobs citing Linux 213 898 716
As % of all permanent jobs advertised in the South West 5.92% 8.80% 10.93%
As % of the Operating Systems category 42.86% 52.55% 57.70%
Number of salaries quoted 126 545 311
10th Percentile £35,000 £35,000 £36,000
25th Percentile £37,500 £43,750 £44,750
Median annual salary (50th Percentile) £46,500 £52,500 £55,000
Median % change year-on-year -11.43% -4.55% +4.76%
75th Percentile £60,000 £70,000 £68,750
90th Percentile £73,750 £82,500 £77,500
England median annual salary £60,000 £55,000 £63,500
% change year-on-year +9.09% -13.39% +5.83%

All Operating Systems
South West

Linux falls under the Operating Systems category. For comparison with the information above, the following table provides summary statistics for all permanent job vacancies requiring operating system skills in the South West.

Permanent vacancies with a requirement for operating system skills 497 1,709 1,241
As % of all permanent jobs advertised in the South West 13.81% 16.75% 18.95%
Number of salaries quoted 327 1,265 717
10th Percentile £28,750 £27,500 £26,250
25th Percentile £31,750 £33,500 £32,500
Median annual salary (50th Percentile) £40,000 £47,500 £47,500
Median % change year-on-year -15.79% - -5.00%
75th Percentile £52,500 £60,000 £62,500
90th Percentile £68,750 £75,000 £73,750
England median annual salary £44,000 £45,000 £52,500
% change year-on-year -2.22% -14.29% -

Linux
Job Vacancy Trend in the South West

Job postings citing Linux as a proportion of all IT jobs advertised in the South West.
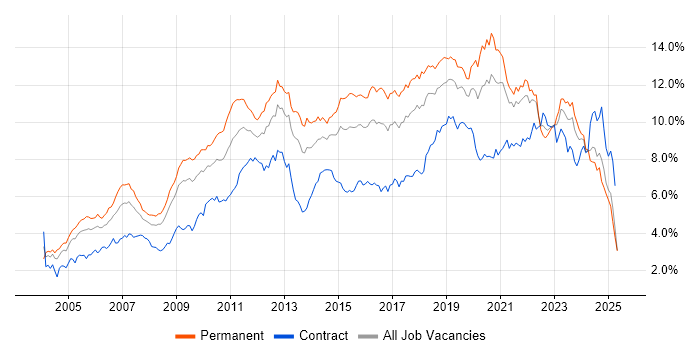
Job vacancy trend for Linux in the South West

Linux
Salary Trend in the South West

3-month moving average salary quoted in jobs citing Linux in the South West.

Salary trend for Linux in the South West

Linux
Salary Histogram in the South West

Salary distribution for jobs citing Linux in the South West over the 6 months to 7 June 2025.

Salary histogram for Linux in the South West

Linux
Job Locations in the South West

The table below looks at the demand and provides a guide to the median salaries quoted in IT jobs citing Linux within the South West region over the 6 months to 7 June 2025. The 'Rank Change' column provides an indication of the change in demand within each location based on the same 6 month period last year.

Location Rank Change
on Same Period
Last Year
Matching
Permanent
IT Job Ads
Median Salary
Past 6 Months
Median Salary
% Change
on Same Period
Last Year
Live
Jobs
Gloucestershire -15 56 £57,500 +4.55% 91
Bristol -17 47 £46,500 -22.50% 67
Wiltshire -7 44 £40,000 -20.00% 33
Devon -11 31 £48,750 +30.00% 22
Somerset -5 20 £40,000 -3.61% 24
Dorset -5 14 £50,000 - 8
Linux
England

Linux
Co-occurring Skills and Capabilities in the South West by Category

The follow tables expand on the table above by listing co-occurrences grouped by category. The same employment type, locality and period is covered with up to 20 co-occurrences shown in each of the following categories:

Application Platforms
1 13 (6.10%) OpenEdge
2 11 (5.16%) IIS
3 7 (3.29%) Apache
3 7 (3.29%) Microsoft Exchange
4 5 (2.35%) OpenStack
5 1 (0.47%) Apache Solr
5 1 (0.47%) Confluence
5 1 (0.47%) nginx
Applications
1 1 (0.47%) Simulink
1 1 (0.47%) Weka
Business Applications
1 2 (0.94%) MFGPRO
2 1 (0.47%) Oracle Payables
Cloud Services
1 34 (15.96%) AWS
2 29 (13.62%) Azure
3 22 (10.33%) Microsoft 365
4 6 (2.82%) Pulumi
5 5 (2.35%) GCP
6 4 (1.88%) AWS Lambda
6 4 (1.88%) Entra ID
6 4 (1.88%) Serverless
7 3 (1.41%) Azure ExpressRoute
7 3 (1.41%) IaaS
7 3 (1.41%) SaaS
8 2 (0.94%) Amazon EC2
8 2 (0.94%) Amazon ECS
8 2 (0.94%) Amazon EKS
8 2 (0.94%) Amazon S3
8 2 (0.94%) Apigee
8 2 (0.94%) Google Kubernetes Engine
9 1 (0.47%) Azure AKS
9 1 (0.47%) GitHub Actions
9 1 (0.47%) OpenShift
Communications & Networking
1 33 (15.49%) VPN
2 31 (14.55%) Firewall
3 21 (9.86%) DNS
4 18 (8.45%) VLAN
5 17 (7.98%) DHCP
6 16 (7.51%) WAN
7 12 (5.63%) LAN
8 11 (5.16%) VoIP
9 10 (4.69%) ADSL
10 7 (3.29%) SD-WAN
10 7 (3.29%) Wi-Fi
11 6 (2.82%) Broadband
12 5 (2.35%) Internet
13 4 (1.88%) 5G
13 4 (1.88%) IPv4
14 3 (1.41%) MPLS
14 3 (1.41%) TCP/IP
14 3 (1.41%) Unified Communications
15 2 (0.94%) IPsec
15 2 (0.94%) OSPF
Database & Business Intelligence
1 17 (7.98%) Amazon RDS
2 14 (6.57%) SQL Server
3 12 (5.63%) Relational Database
4 10 (4.69%) NoSQL
5 8 (3.76%) MongoDB
6 7 (3.29%) Elasticsearch
6 7 (3.29%) RDBMS
7 3 (1.41%) Azure SQL Database
7 3 (1.41%) MySQL
8 2 (0.94%) PostgreSQL
8 2 (0.94%) SQLite
9 1 (0.47%) Big Data
9 1 (0.47%) Couchbase
9 1 (0.47%) Oracle Database
Development Applications
1 46 (21.60%) JIRA
2 31 (14.55%) Visual Studio
3 12 (5.63%) Git
4 10 (4.69%) GitLab
5 6 (2.82%) Eclipse
5 6 (2.82%) Eclipse RCP
5 6 (2.82%) Jaeger
5 6 (2.82%) Jenkins
6 5 (2.35%) JUnit
7 2 (0.94%) Bitbucket
7 2 (0.94%) Maven
7 2 (0.94%) SonarQube
7 2 (0.94%) Sonatype Nexus
7 2 (0.94%) WebSpeed
8 1 (0.47%) CMake
8 1 (0.47%) Cucumber
8 1 (0.47%) GDB
8 1 (0.47%) Robot Framework
8 1 (0.47%) Subversion
8 1 (0.47%) WiX
General
1 55 (25.82%) Social Skills
2 29 (13.62%) Finance
3 27 (12.68%) Avionics
4 24 (11.27%) Manufacturing
5 19 (8.92%) Inclusion and Diversity
6 18 (8.45%) Analytical Skills
6 18 (8.45%) Presentation Skills
7 9 (4.23%) Marketing
7 9 (4.23%) Telecoms
8 8 (3.76%) Aerospace
9 7 (3.29%) Electronics
9 7 (3.29%) Retail
10 5 (2.35%) Legal
10 5 (2.35%) Public Sector
11 3 (1.41%) Automotive
12 2 (0.94%) Banking
13 1 (0.47%) Documentation Skills
13 1 (0.47%) Fire and Rescue
13 1 (0.47%) Local Government
13 1 (0.47%) Police
Job Titles
1 45 (21.13%) Senior
2 29 (13.62%) Developer
3 28 (13.15%) Software Engineer
4 25 (11.74%) Administrator
5 22 (10.33%) Systems Administrator
6 19 (8.92%) Support Engineer
7 17 (7.98%) Analyst
8 16 (7.51%) ERP Developer
8 16 (7.51%) IT Support
8 16 (7.51%) Progress Developer
8 16 (7.51%) Technical Engineer
8 16 (7.51%) Technical Support
8 16 (7.51%) Technical Support Engineer
9 15 (7.04%) IT Analyst
9 15 (7.04%) IT Support Analyst
9 15 (7.04%) Support Analyst
10 14 (6.57%) Lead
11 13 (6.10%) Test Engineer
12 11 (5.16%) Cloud Engineer
13 10 (4.69%) 3rd Line Support Analyst
Libraries, Frameworks & Software Standards
1 12 (5.63%) HTML
2 9 (4.23%) React
3 7 (3.29%) Elastic Stack
3 7 (3.29%) Hibernate
4 6 (2.82%) CSS
4 6 (2.82%) JSP
4 6 (2.82%) Middleware
4 6 (2.82%) OpenTelemetry
5 5 (2.35%) .NET
5 5 (2.35%) Laravel
5 5 (2.35%) RESTful
6 4 (1.88%) JSF
7 3 (1.41%) OpenCL
7 3 (1.41%) Symfony
7 3 (1.41%) Yii
8 2 (0.94%) EDI
8 2 (0.94%) Pandas
8 2 (0.94%) Spring
8 2 (0.94%) Spring Boot
9 1 (0.47%) XML
Miscellaneous
1 21 (9.86%) e-Learning
2 17 (7.98%) Satnav
3 10 (4.69%) Data Centre
4 6 (2.82%) Linux Command Line
5 5 (2.35%) GNSS
5 5 (2.35%) Hybrid Cloud
5 5 (2.35%) Public Cloud
5 5 (2.35%) Self-Motivation
6 4 (1.88%) Cyberattack
6 4 (1.88%) Product Ownership
6 4 (1.88%) Self-Driving Car
7 3 (1.41%) CUDA
7 3 (1.41%) Device Driver
7 3 (1.41%) Management Information System
7 3 (1.41%) PCIe
8 2 (0.94%) Cloud Security Posture
8 2 (0.94%) FPGA
8 2 (0.94%) Onboarding
8 2 (0.94%) Security Posture
8 2 (0.94%) VHDL
Operating Systems
1 78 (36.62%) Windows
2 29 (13.62%) Windows Server
3 10 (4.69%) Unix
4 5 (2.35%) Android
5 4 (1.88%) Red Hat Enterprise Linux
5 4 (1.88%) Windows Server 2019
6 3 (1.41%) Windows 10
6 3 (1.41%) Windows Server 2016
7 2 (0.94%) Mac OS
8 1 (0.47%) Apple iOS
8 1 (0.47%) CentOS
8 1 (0.47%) CoreOS
8 1 (0.47%) Embedded Linux
8 1 (0.47%) Rocky
8 1 (0.47%) Solaris
8 1 (0.47%) Ubuntu
Processes & Methodologies
1 45 (21.13%) Problem-Solving
2 40 (18.78%) Mathematics
2 40 (18.78%) Software Engineering
3 36 (16.90%) Physics
4 33 (15.49%) User Experience
5 30 (14.08%) Test Automation
6 28 (13.15%) Mentoring
7 27 (12.68%) Quality Management
7 27 (12.68%) UX Design
8 24 (11.27%) DevOps
9 23 (10.80%) Containerisation
9 23 (10.80%) High Availability
9 23 (10.80%) Infrastructure as Code
10 22 (10.33%) Agile
11 21 (9.86%) B2B
11 21 (9.86%) Cybersecurity
11 21 (9.86%) Innovative Thinking
11 21 (9.86%) ITIL
11 21 (9.86%) Software Testing
12 19 (8.92%) Customer Service
Programming Languages
1 72 (33.80%) Python
2 42 (19.72%) C
3 33 (15.49%) Java
4 31 (14.55%) JavaScript
5 27 (12.68%) Bash
5 27 (12.68%) PowerShell
5 27 (12.68%) SQL
6 23 (10.80%) C++
7 16 (7.51%) Progress 4GL
8 14 (6.57%) Go
9 12 (5.63%) PHP
10 8 (3.76%) Rust
10 8 (3.76%) TypeScript
11 6 (2.82%) C#
11 6 (2.82%) Perl
12 4 (1.88%) Ada
12 4 (1.88%) R
13 3 (1.41%) Clojure
14 2 (0.94%) MATLAB
14 2 (0.94%) Tcl
Qualifications
1 71 (33.33%) Degree
1 71 (33.33%) Security Cleared
2 39 (18.31%) DV Cleared
3 29 (13.62%) SC Cleared
4 19 (8.92%) Cisco Certification
5 17 (7.98%) CCNP
6 16 (7.51%) HNC
6 16 (7.51%) HND
6 16 (7.51%) RHCSA
7 14 (6.57%) AWS Certification
8 12 (5.63%) BPSS Clearance
9 11 (5.16%) Network+ Certification
10 10 (4.69%) A+ Certification
11 7 (3.29%) ISTQB
12 4 (1.88%) CISSP
13 3 (1.41%) Microsoft Certification
14 2 (0.94%) (ISC)2 CCSP
14 2 (0.94%) CCNA
14 2 (0.94%) CISM
14 2 (0.94%) MCSA
Quality Assurance & Compliance
1 21 (9.86%) SLA
2 4 (1.88%) PMO
3 3 (1.41%) QA
4 1 (0.47%) Def Stans
4 1 (0.47%) GDPR
4 1 (0.47%) ISO 9001
4 1 (0.47%) MISRA
4 1 (0.47%) PCI DSS
System Software
1 33 (15.49%) Docker
2 19 (8.92%) Active Directory
3 14 (6.57%) VMware Infrastructure
4 7 (3.29%) VMware ESXi
5 5 (2.35%) Firmware
5 5 (2.35%) vSphere
6 3 (1.41%) Hyper-V
7 1 (0.47%) Embedded Firmware
7 1 (0.47%) LXC
7 1 (0.47%) Samba
7 1 (0.47%) Virtual Servers
7 1 (0.47%) VMware NSX
Systems Management
1 28 (13.15%) Ansible
2 27 (12.68%) Terraform
3 25 (11.74%) Kubernetes
4 18 (8.45%) Microsoft Intune
5 7 (3.29%) Prometheus
6 6 (2.82%) Argo
6 6 (2.82%) Kibana
6 6 (2.82%) Kustomize
6 6 (2.82%) Puppet
7 2 (0.94%) Istio
7 2 (0.94%) Podman
8 1 (0.47%) Grafana
8 1 (0.47%) Nagios
8 1 (0.47%) Progress Chef
8 1 (0.47%) SCCM
Vendors
1 73 (34.27%) Microsoft
2 28 (13.15%) Cisco
3 21 (9.86%) Red Hat
3 21 (9.86%) VMware
4 16 (7.51%) Progress
4 16 (7.51%) Salesforce
5 8 (3.76%) Google
5 8 (3.76%) Oracle
5 8 (3.76%) Veeam
6 6 (2.82%) Atlassian
7 5 (2.35%) Graphcore
8 4 (1.88%) Extreme Networks
8 4 (1.88%) Intel
8 4 (1.88%) SAP
9 3 (1.41%) CheckPoint
9 3 (1.41%) SolarWinds
9 3 (1.41%) Zscaler
10 2 (0.94%) Fortinet
10 2 (0.94%) HP
10 2 (0.94%) QAD