SC Cleared Jobs in the South West

Security Check (SC) Clearance
England > South West

The following table provides summary statistics for permanent job vacancies advertised in the South West with a requirement for SC Cleared qualifications. Included is a benchmarking guide to the salaries offered over the 6 months to 2 December 2023 with a comparison to the same period in the previous 2 years.

6 months to
2 Dec 2023
Same period 2022 Same period 2021
Rank 8 24 29
Rank change year-on-year +16 +5 0
Permanent jobs citing SC Cleared 764 793 644
As % of all permanent jobs advertised in the South West 16.27% 9.78% 8.80%
As % of the Qualifications category 35.40% 24.11% 27.37%
Number of salaries quoted 488 377 349
10th Percentile £31,500 £28,750 £37,750
25th Percentile £45,000 £37,500 £45,000
Median annual salary (50th Percentile) £55,000 £53,500 £60,050
Median % change year-on-year +2.80% -10.91% +9.18%
75th Percentile £70,000 £72,500 £73,750
90th Percentile £81,250 £78,750 £82,500
England median annual salary £57,500 £57,500 £60,050
% change year-on-year - -4.25% +9.18%

All Academic and Professional Certifications
South West

SC Cleared is in the Academic Qualifications and Professional Certifications category. The following table is for comparison with the above and provides summary statistics for all permanent job vacancies advertised in the South West with a requirement for academic qualifications or professional certifications.

Permanent vacancies requiring academic qualifications or professional certifications 2,158 3,289 2,353
As % of all permanent jobs advertised in the South West 45.94% 40.57% 32.17%
Number of salaries quoted 1,356 1,376 1,223
10th Percentile £29,440 £27,428 £28,750
25th Percentile £40,000 £36,188 £37,500
Median annual salary (50th Percentile) £50,000 £50,000 £48,750
Median % change year-on-year - +2.56% -2.50%
75th Percentile £68,750 £65,000 £67,500
90th Percentile £80,000 £77,500 £75,000
England median annual salary £57,500 £56,000 £55,000
% change year-on-year +2.68% +1.82% -

SC Cleared
Job Vacancy Trend in the South West

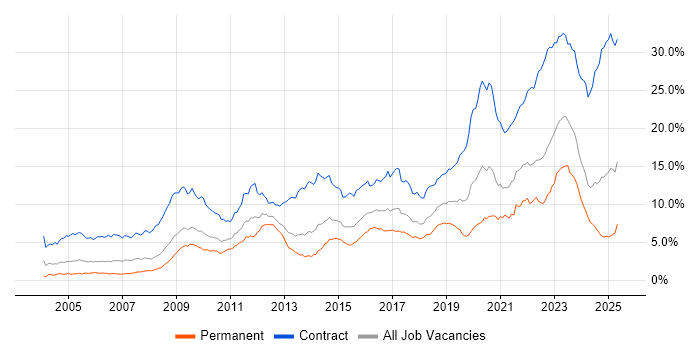
Job postings citing SC Cleared as a proportion of all IT jobs advertised in the South West.

Job vacancy trend for SC Cleared in the South West

SC Cleared
Salary Trend in the South West

3-month moving average salary quoted in jobs citing SC Cleared in the South West.

Salary trend for SC Cleared in the South West

SC Cleared
Salary Histogram in the South West

Salary distribution for jobs citing SC Cleared in the South West over the 6 months to 2 December 2023.

Salary histogram for SC Cleared in the South West

SC Cleared
Job Locations in the South West

The table below looks at the demand and provides a guide to the median salaries quoted in IT jobs citing SC Cleared within the South West region over the 6 months to 2 December 2023. The 'Rank Change' column provides an indication of the change in demand within each location based on the same 6 month period last year.

Location Rank Change
on Same Period
Last Year
Matching
Permanent
IT Job Ads
Median Salary
Past 6 Months
Median Salary
% Change
on Same Period
Last Year
Live
Jobs
Bristol +21 222 £61,750 +5.11% 109
Gloucestershire +9 202 £51,500 -6.36% 42
Wiltshire +9 163 £49,000 -10.91% 43
Dorset +29 75 £67,500 +50.00% 19
Devon +21 25 £54,500 +13.07% 32
Somerset -14 18 £28,290 +8.81% 13
Cornwall +19 1 £31,500 -
Avon - 1 - - 27
SC Cleared
England

SC Cleared
Co-occurring Skills and Capabilities in the South West by Category

The follow tables expand on the table above by listing co-occurrences grouped by category. The same employment type, locality and period is covered with up to 20 co-occurrences shown in each of the following categories:

Application Platforms
1 32 (4.19%) SharePoint
2 18 (2.36%) Confluence
3 7 (0.92%) JBoss
3 7 (0.92%) Red Hat Fuse
3 7 (0.92%) SharePoint 2010
3 7 (0.92%) SharePoint 2013
4 6 (0.79%) Apache Spark
4 6 (0.79%) MS Exchange
5 5 (0.65%) OpenStack
6 4 (0.52%) Apache
7 2 (0.26%) Headless CMS
7 2 (0.26%) MS Project Server
8 1 (0.13%) Anypoint
8 1 (0.13%) Apache Airflow
8 1 (0.13%) Apache Pulsar
8 1 (0.13%) ArcGIS
8 1 (0.13%) BizTalk Server
8 1 (0.13%) GeoServer
8 1 (0.13%) WebSphere
8 1 (0.13%) WebSphere Application Server
Applications
1 36 (4.71%) Microsoft Office
2 11 (1.44%) Microsoft Project
3 6 (0.79%) Microsoft Excel
3 6 (0.79%) OrCAD
4 4 (0.52%) Windchill
5 2 (0.26%) Acrobat
5 2 (0.26%) Microsoft PowerPoint
6 1 (0.13%) CATIA
6 1 (0.13%) Trello
Business Applications
1 16 (2.09%) Maximo
2 14 (1.83%) Sparx Enterprise Architect
3 13 (1.70%) Primavera
4 1 (0.13%) ENOVIA
4 1 (0.13%) Oracle EBS R12
4 1 (0.13%) Oracle ERP
4 1 (0.13%) Oracle iSupplier
4 1 (0.13%) Oracle SCM
Cloud Services
1 145 (18.98%) Azure
2 112 (14.66%) AWS
3 62 (8.12%) Microsoft 365
4 46 (6.02%) Serverless
5 45 (5.89%) Azure DevOps
6 34 (4.45%) Power Platform
7 31 (4.06%) Cloud Computing
8 22 (2.88%) SaaS
9 21 (2.75%) OpenShift
10 18 (2.36%) AWS Lambda
11 16 (2.09%) GCP
12 10 (1.31%) Amazon EC2
13 9 (1.18%) Amazon S3
14 8 (1.05%) Entra ID
15 6 (0.79%) AWS Step Functions
16 5 (0.65%) Amazon ECS
16 5 (0.65%) Amazon MSK
16 5 (0.65%) Azure Event Grid
16 5 (0.65%) Azure Logic Apps
16 5 (0.65%) Power Automate
Communications & Networking
1 35 (4.58%) HTTP
2 34 (4.45%) DNS
3 30 (3.93%) Firewall
4 25 (3.27%) Software-Defined Networking
5 23 (3.01%) Network Security
5 23 (3.01%) TCP/IP
6 22 (2.88%) DHCP
7 21 (2.75%) WAN
8 19 (2.49%) Internet
8 19 (2.49%) SMTP
9 16 (2.09%) Software-Defined Radio
9 16 (2.09%) SSL
10 13 (1.70%) SAN
11 11 (1.44%) LAN
12 10 (1.31%) Cisco ASA
12 10 (1.31%) NAS
13 9 (1.18%) BGP
13 9 (1.18%) Cisco IPT
14 7 (0.92%) VPN
14 7 (0.92%) Wireless
Database & Business Intelligence
1 40 (5.24%) SQL Server
2 23 (3.01%) Power BI
3 22 (2.88%) PostgreSQL
4 21 (2.75%) Data Warehouse
5 20 (2.62%) Big Data
5 20 (2.62%) NoSQL
6 18 (2.36%) MySQL
7 17 (2.23%) Amazon RDS
7 17 (2.23%) GIS
8 13 (1.70%) DynamoDB
9 10 (1.31%) MongoDB
9 10 (1.31%) Relational Database
10 9 (1.18%) RDBMS
11 6 (0.79%) Amazon Redshift
11 6 (0.79%) Apache Hive
12 5 (0.65%) Apache Cassandra
12 5 (0.65%) Elasticsearch
12 5 (0.65%) Hadoop
12 5 (0.65%) Parquet
13 4 (0.52%) Oracle Database
Development Applications
1 49 (6.41%) Git
2 28 (3.66%) JIRA
3 23 (3.01%) GitLab
4 22 (2.88%) Jenkins
5 20 (2.62%) Visual Studio
6 17 (2.23%) Bitbucket
7 16 (2.09%) Team Foundation Server
8 14 (1.83%) Selenium
9 11 (1.44%) Rational DOORS
10 9 (1.18%) Artifactory
10 9 (1.18%) Sonatype Nexus
11 8 (1.05%) Cypress.io
12 7 (0.92%) IntelliJ
13 5 (0.65%) JUnit
14 4 (0.52%) AutoIt
14 4 (0.52%) CppUnit
14 4 (0.52%) Cucumber
14 4 (0.52%) eggPlant
15 3 (0.39%) CMake
15 3 (0.39%) Rational Rhapsody
General
1 119 (15.58%) Social Skills
2 96 (12.57%) Military
3 54 (7.07%) Finance
3 54 (7.07%) Public Sector
4 33 (4.32%) Presentation Skills
5 30 (3.93%) Aerospace
6 22 (2.88%) Telecoms
7 20 (2.62%) Games
7 20 (2.62%) Manufacturing
7 20 (2.62%) Police
8 19 (2.49%) Analytical Skills
8 19 (2.49%) Electronics
9 16 (2.09%) Organisational Skills
10 14 (1.83%) Inclusion and Diversity
10 14 (1.83%) Influencing Skills
10 14 (1.83%) Marketing
11 12 (1.57%) Retail
12 8 (1.05%) Legal
13 6 (0.79%) Automotive
13 6 (0.79%) Avionics
Job Titles
1 155 (20.29%) Senior
2 108 (14.14%) Developer
3 82 (10.73%) Software Engineer
4 78 (10.21%) Architect
5 75 (9.82%) Infrastructure Engineer
6 45 (5.89%) Solutions Architect
7 39 (5.10%) Lead
8 38 (4.97%) Project Manager
9 36 (4.71%) Senior Software Engineer
10 35 (4.58%) Systems Engineer
11 32 (4.19%) DevOps Engineer
12 29 (3.80%) Senior Developer
13 27 (3.53%) Senior Wintel Engineer
13 27 (3.53%) Wintel Engineer
14 25 (3.27%) Android Developer
14 25 (3.27%) VMware Engineer
15 23 (3.01%) Azure Engineer
16 21 (2.75%) Java Engineer
16 21 (2.75%) Presales Solution Architect
16 21 (2.75%) VMware Infrastructure Engineer
Libraries, Frameworks & Software Standards
1 43 (5.63%) .NET
2 34 (4.45%) REST
3 28 (3.66%) AngularJS
4 22 (2.88%) React
4 22 (2.88%) Spring
5 19 (2.49%) Web Services
5 19 (2.49%) XML
6 17 (2.23%) JSON
6 17 (2.23%) Unity (Game Engine)
7 16 (2.09%) .NET Core
8 15 (1.96%) Elastic Stack
9 14 (1.83%) RESTful
10 13 (1.70%) ModSecurity
11 11 (1.44%) HTML
11 11 (1.44%) Kafka
12 10 (1.31%) .NET Framework
13 9 (1.18%) ASP.NET
13 9 (1.18%) J2EE
13 9 (1.18%) Java EE
13 9 (1.18%) Ruby on Rails
Miscellaneous
1 46 (6.02%) Private Cloud
2 32 (4.19%) Virtual Reality
3 28 (3.66%) Management Information System
4 18 (2.36%) Algorithms
4 18 (2.36%) Cyber Threat
4 18 (2.36%) Data Centre
5 15 (1.96%) Augmented Reality
6 14 (1.83%) Cyber Defence
6 14 (1.83%) Self-Motivation
7 11 (1.44%) Embedded Systems
8 10 (1.31%) PKI
9 9 (1.18%) FPGA
10 8 (1.05%) Clustering
10 8 (1.05%) Fat Client
10 8 (1.05%) Thin Client
11 7 (0.92%) Public Cloud
11 7 (0.92%) VHDL
12 6 (0.79%) Mobile App
12 6 (0.79%) Operational Technology
13 5 (0.65%) Distributed Systems
Operating Systems
1 100 (13.09%) Windows
2 95 (12.43%) Linux
3 61 (7.98%) Windows Server
4 32 (4.19%) Android
5 31 (4.06%) Red Hat Enterprise Linux
6 14 (1.83%) Windows Server 2016
7 12 (1.57%) Windows Server 2012
7 12 (1.57%) Windows Server 2019
8 11 (1.44%) Unix
8 11 (1.44%) Windows 10
9 8 (1.05%) CentOS
10 6 (0.79%) Ubuntu
11 4 (0.52%) Windows 7
12 3 (0.39%) Apple iOS
13 1 (0.13%) CoreOS
13 1 (0.13%) Data ONTAP
13 1 (0.13%) Debian
13 1 (0.13%) Mac OS
13 1 (0.13%) Solaris
13 1 (0.13%) Windows Server 2008
Processes & Methodologies
1 203 (26.57%) Actionable Insight
2 193 (25.26%) Agile
3 157 (20.55%) Software Engineering
4 133 (17.41%) DevOps
5 109 (14.27%) Problem-Solving
6 88 (11.52%) Infrastructure Engineering
7 87 (11.39%) Scrum
8 63 (8.25%) Analytics
9 60 (7.85%) Coaching
10 59 (7.72%) Unit Testing
11 57 (7.46%) Open Source
12 56 (7.33%) Cybersecurity
13 55 (7.20%) Project Delivery
13 55 (7.20%) UML
14 54 (7.07%) Software Testing
15 51 (6.68%) Full Stack Development
15 51 (6.68%) Validation
16 48 (6.28%) Business Intelligence
17 45 (5.89%) CI/CD
17 45 (5.89%) Mentoring
Programming Languages
1 143 (18.72%) Java
2 136 (17.80%) Python
3 67 (8.77%) PowerShell
4 63 (8.25%) C#
5 61 (7.98%) JavaScript
6 54 (7.07%) Bash
7 52 (6.81%) SQL
8 30 (3.93%) C++
9 26 (3.40%) C
10 20 (2.62%) Ruby
10 20 (2.62%) TypeScript
11 19 (2.49%) R
12 12 (1.57%) Kotlin
13 9 (1.18%) Go
14 7 (0.92%) MATLAB
14 7 (0.92%) Perl
15 6 (0.79%) PL/SQL
16 4 (0.52%) Shell Script
16 4 (0.52%) VB
17 3 (0.39%) PHP
Qualifications
1 764 (100.00%) Security Cleared
2 174 (22.77%) DV Cleared
3 132 (17.28%) Degree
4 57 (7.46%) BPSS Clearance
5 25 (3.27%) CISSP
6 21 (2.75%) Master's Degree
7 19 (2.49%) TOGAF Certification
8 18 (2.36%) CREST Certified
9 17 (2.23%) CISM
10 15 (1.96%) GIAC
11 13 (1.70%) CISA
11 13 (1.70%) Computer Science Degree
12 11 (1.44%) Microsoft Certification
13 10 (1.31%) Cisco Certification
14 8 (1.05%) CCNA
15 7 (0.92%) ISTQB
16 6 (0.79%) APMP
16 6 (0.79%) CCNP
16 6 (0.79%) ISACA
16 6 (0.79%) MCPD
Quality Assurance & Compliance
1 25 (3.27%) QA
2 23 (3.01%) ISO/IEC 15288
3 21 (2.75%) ISO/IEC 27001
4 20 (2.62%) NCSC
5 12 (1.57%) NIST
6 10 (1.31%) Cyber Essentials
6 10 (1.31%) Cyber Essentials PLUS
7 9 (1.18%) Accessibility
8 7 (0.92%) ISO 9001
9 6 (0.79%) ARP4754
9 6 (0.79%) IEC 61508
9 6 (0.79%) JSP 440
9 6 (0.79%) RMADS
9 6 (0.79%) Software Quality Assurance
10 5 (0.65%) GRC
11 4 (0.52%) Data Quality
12 3 (0.39%) SLA
13 2 (0.26%) Def Stans
13 2 (0.26%) MISRA
13 2 (0.26%) NIST 800
System Software
1 97 (12.70%) VMware Infrastructure
2 68 (8.90%) Active Directory
3 61 (7.98%) Docker
4 58 (7.59%) Hyper-V
5 28 (3.66%) Virtual Machines
6 25 (3.27%) Virtual Servers
7 13 (1.70%) vSphere
8 12 (1.57%) VMware ESXi
9 8 (1.05%) VMware NSX
10 7 (0.92%) Firmware
11 6 (0.79%) HDFS
12 4 (0.52%) Embedded Firmware
13 1 (0.13%) Citrix Hypervisor
13 1 (0.13%) NFS
Systems Management
1 73 (9.55%) Kubernetes
2 59 (7.72%) Ansible
3 35 (4.58%) vCenter Server
4 34 (4.45%) SCCM
5 29 (3.80%) Terraform
6 25 (3.27%) VxRail
7 20 (2.62%) Puppet
8 10 (1.31%) Packer
9 9 (1.18%) Grafana
9 9 (1.18%) Prometheus
10 8 (1.05%) Failover Clustering
10 8 (1.05%) Microsoft Clustering
10 8 (1.05%) Microsoft Data Protection Manager
10 8 (1.05%) SCOM
11 6 (0.79%) McAfee ePO
12 5 (0.65%) Oozie
12 5 (0.65%) Progress Chef
13 4 (0.52%) Docker Swarm
14 3 (0.39%) HP Quality Center
15 2 (0.26%) Nagios
Vendors
1 169 (22.12%) Microsoft
2 103 (13.48%) VMware
3 25 (3.27%) Red Hat
4 24 (3.14%) Citrix
5 23 (3.01%) Cisco
6 21 (2.75%) Oracle
7 18 (2.36%) IBM
8 14 (1.83%) SolarWinds
8 14 (1.83%) Sparx
9 11 (1.44%) Fortinet
9 11 (1.44%) SAP
10 10 (1.31%) HP
10 10 (1.31%) Splunk
11 9 (1.18%) Remedy
12 8 (1.05%) Juniper
12 8 (1.05%) Meraki
13 6 (0.79%) Cadence
13 6 (0.79%) Google
13 6 (0.79%) McAfee
14 5 (0.65%) BMC