Retail Jobs in the South West

Retailing
England > South West

The table below looks at the prevalence of the term Retail in permanent job vacancies advertised in the South West. Included is a benchmarking guide to the salaries offered in vacancies that have cited Retail over the 6 months to 2 December 2023 with a comparison to the same period over the previous 2 years.

6 months to
2 Dec 2023
Same period 2022 Same period 2021
Rank 44 48 38
Rank change year-on-year +4 -10 +75
Permanent jobs citing Retail 297 515 513
As % of all permanent jobs advertised in the South West 6.32% 6.35% 7.01%
As % of the General category 11.35% 9.59% 12.09%
Number of salaries quoted 217 304 161
10th Percentile £30,000 £28,350 £32,500
25th Percentile £36,750 £37,885 £37,500
Median annual salary (50th Percentile) £47,557 £50,000 £50,000
Median % change year-on-year -4.89% - +14.29%
75th Percentile £67,070 £70,000 £71,000
90th Percentile £82,648 £83,365 £75,000
England median annual salary £57,500 £60,000 £57,500
% change year-on-year -4.17% +4.35% -

All General Skills
South West

Retail is in the General Skills category. The following table is for comparison with the above and provides summary statistics for all permanent job vacancies advertised in the South West with a requirement for common skills.

Permanent vacancies with a requirement for common skills 2,616 5,371 4,242
As % of all permanent jobs advertised in the South West 55.70% 66.25% 57.99%
Number of salaries quoted 1,777 2,876 2,595
10th Percentile £30,000 £27,250 £27,500
25th Percentile £38,591 £35,000 £36,750
Median annual salary (50th Percentile) £52,500 £50,000 £47,500
Median % change year-on-year +5.00% +5.26% +5.56%
75th Percentile £70,000 £64,254 £63,750
90th Percentile £85,000 £77,715 £76,412
England median annual salary £60,000 £60,000 £60,000
% change year-on-year - - +4.35%

Retail
Job Vacancy Trend in the South West

Job postings citing Retail as a proportion of all IT jobs advertised in the South West.
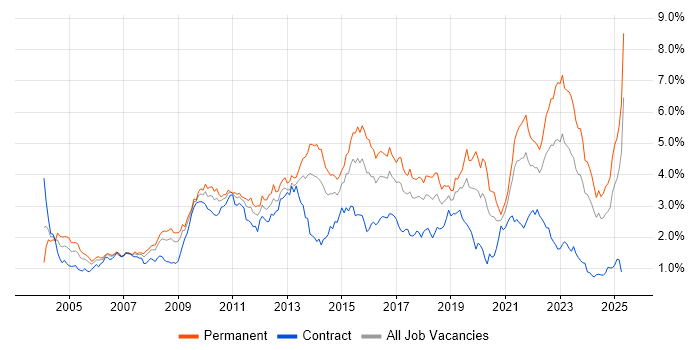
Job vacancy trend for Retail in the South West

Retail
Salary Trend in the South West

3-month moving average salary quoted in jobs citing Retail in the South West.

Salary trend for Retail in the South West

Retail
Salary Histogram in the South West

Salary distribution for jobs citing Retail in the South West over the 6 months to 2 December 2023.

Salary histogram for Retail in the South West

Retail
Job Locations in the South West

The table below looks at the demand and provides a guide to the median salaries quoted in IT jobs citing Retail within the South West region over the 6 months to 2 December 2023. The 'Rank Change' column provides an indication of the change in demand within each location based on the same 6 month period last year.

Location Rank Change
on Same Period
Last Year
Matching
Permanent
IT Job Ads
Median Salary
Past 6 Months
Median Salary
% Change
on Same Period
Last Year
Live
Jobs
Bristol +26 168 £47,557 -20.74% 58
Devon -7 53 £38,398 +5.20% 41
Wiltshire +18 34 £50,702 +10.82% 35
Gloucestershire -11 22 £59,556 +25.38% 12
Somerset +24 10 £35,232 -41.28% 12
Dorset -8 5 £55,000 -15.38% 16
Cornwall +23 1 £40,000 +33.33% 2
Retail
England

Retail
Co-occurring Skills and Capabilities in the South West by Category

The follow tables expand on the table above by listing co-occurrences grouped by category. The same employment type, locality and period is covered with up to 20 co-occurrences shown in each of the following categories:

Application Platforms
1 12 (4.04%) Apache
1 12 (4.04%) Apache Spark
2 10 (3.37%) Confluence
2 10 (3.37%) Oracle Application Server
3 6 (2.02%) SharePoint
4 4 (1.35%) OpenStack
4 4 (1.35%) SAS
5 2 (0.67%) Jetty
5 2 (0.67%) Tomcat
6 1 (0.34%) Apache Solr
6 1 (0.34%) CMS
Applications
1 39 (13.13%) Microsoft Office
2 14 (4.71%) Microsoft Excel
3 2 (0.67%) InfoPath
4 1 (0.34%) Siemens NX
4 1 (0.34%) Sketch
Business Applications
1 4 (1.35%) Teamcenter
2 2 (0.67%) SAP CS
3 1 (0.34%) Dynamics CRM
3 1 (0.34%) Dynamics NAV
Cloud Services
1 53 (17.85%) Power Platform
2 35 (11.78%) AWS
2 35 (11.78%) GCP
3 34 (11.45%) Azure
4 17 (5.72%) Microsoft 365
5 15 (5.05%) GitHub
6 14 (4.71%) GitHub Actions
6 14 (4.71%) PaaS
7 11 (3.70%) SaaS
8 10 (3.37%) Google Analytics
8 10 (3.37%) IaaS
8 10 (3.37%) Snowflake
8 10 (3.37%) Vertex AI
9 7 (2.36%) Entra ID
9 7 (2.36%) Serverless
10 5 (1.68%) Amazon S3
10 5 (1.68%) AWS Lambda
10 5 (1.68%) Cloud Computing
11 4 (1.35%) Amazon EC2
11 4 (1.35%) CloudFront
Communications & Networking
1 27 (9.09%) WAN
2 23 (7.74%) SD-WAN
3 21 (7.07%) 5G
4 12 (4.04%) Internet
5 9 (3.03%) Firewall
6 7 (2.36%) TCP/IP
7 6 (2.02%) DNS
7 6 (2.02%) Network Security
7 6 (2.02%) VPN
8 5 (1.68%) HTTP
8 5 (1.68%) LAN
9 4 (1.35%) F5 BIG-IP GTM
9 4 (1.35%) F5 BIG-IP LTM
9 4 (1.35%) SMTP
10 3 (1.01%) Wi-Fi
11 2 (0.67%) Cisco Firepower
11 2 (0.67%) Extranet
11 2 (0.67%) NGFW
11 2 (0.67%) Unified Communications
12 1 (0.34%) HSRP
Database & Business Intelligence
1 49 (16.50%) Power BI
2 43 (14.48%) Data Warehouse
3 36 (12.12%) NoSQL
4 31 (10.44%) Tableau
5 25 (8.42%) Big Data
6 20 (6.73%) MySQL
6 20 (6.73%) PostgreSQL
6 20 (6.73%) SQL Server
7 18 (6.06%) Data Lake
8 13 (4.38%) Data Mart
8 13 (4.38%) Relational Database
8 13 (4.38%) SQL Server Integration Services
8 13 (4.38%) SQL Server Reporting Services
9 12 (4.04%) Oracle BI EE
10 10 (3.37%) BigQuery
10 10 (3.37%) Bigtable
10 10 (3.37%) Looker
10 10 (3.37%) Star Schema
11 5 (1.68%) Amazon RDS
11 5 (1.68%) DynamoDB
Development Applications
1 17 (5.72%) JIRA
2 15 (5.05%) Git
2 15 (5.05%) Jenkins
3 13 (4.38%) Oracle Forms
4 8 (2.69%) LabVIEW
5 6 (2.02%) Maven
6 5 (1.68%) Visual Studio
7 3 (1.01%) SonarQube
7 3 (1.01%) Spinnaker
8 2 (0.67%) JUnit
8 2 (0.67%) Sonatype Nexus
9 1 (0.34%) Ant
9 1 (0.34%) Artifactory
9 1 (0.34%) Eclipse
9 1 (0.34%) IBM UrbanCode
9 1 (0.34%) Selenium
9 1 (0.34%) SoapUI
9 1 (0.34%) Team Foundation Server
9 1 (0.34%) TestNG
General
1 139 (46.80%) Finance
2 100 (33.67%) Banking
3 93 (31.31%) Social Skills
4 62 (20.88%) Analytical Skills
5 45 (15.15%) Marketing
6 26 (8.75%) Presentation Skills
7 23 (7.74%) Aerospace
8 21 (7.07%) Legal
9 18 (6.06%) Influencing Skills
10 10 (3.37%) Retail Finance
11 9 (3.03%) Inclusion and Diversity
12 8 (2.69%) Organisational Skills
13 7 (2.36%) Retail Banking
14 4 (1.35%) Telecoms
15 3 (1.01%) Manufacturing
15 3 (1.01%) Police
16 2 (0.67%) Automotive
16 2 (0.67%) Electronics
16 2 (0.67%) Public Sector
17 1 (0.34%) Military
Job Titles
1 67 (22.56%) Senior
2 45 (15.15%) Analyst
3 32 (10.77%) Architect
4 23 (7.74%) Solutions Architect
5 18 (6.06%) DevOps Engineer
6 17 (5.72%) Developer
7 16 (5.39%) Data Analyst
8 15 (5.05%) Software Engineer
9 13 (4.38%) Lead
9 13 (4.38%) Senior Analyst
10 11 (3.70%) Senior DevOps
10 11 (3.70%) Senior DevOps Engineer
11 10 (3.37%) Business Intelligence Analyst
11 10 (3.37%) Designer
11 10 (3.37%) Project Manager
12 9 (3.03%) Cloud Engineer
12 9 (3.03%) Graduate
12 9 (3.03%) Linux Engineer
13 8 (2.69%) AWS Engineer
13 8 (2.69%) Pricing Data Analyst
Libraries, Frameworks & Software Standards
1 25 (8.42%) HTML
2 24 (8.08%) RESTful
3 21 (7.07%) Kafka
4 17 (5.72%) Web Services
5 13 (4.38%) CSS
5 13 (4.38%) OpenID
6 9 (3.03%) Spring Boot
7 8 (2.69%) Hibernate
7 8 (2.69%) JSON
7 8 (2.69%) React
8 6 (2.02%) Node.js
8 6 (2.02%) RabbitMQ
8 6 (2.02%) XML
9 5 (1.68%) REST
9 5 (1.68%) Spring
10 4 (1.35%) CSS3
10 4 (1.35%) EDI
10 4 (1.35%) HTML5
10 4 (1.35%) LAMP
10 4 (1.35%) Laravel
Miscellaneous
1 27 (9.09%) Self-Motivation
2 26 (8.75%) Product Ownership
3 18 (6.06%) Data Structures
4 17 (5.72%) Cloud Native
5 16 (5.39%) GNSS
6 13 (4.38%) NHS
6 13 (4.38%) Public Cloud
7 11 (3.70%) Blockchain
8 10 (3.37%) Life Science
9 9 (3.03%) Pricing Data
10 7 (2.36%) Mainframe
11 5 (1.68%) Management Information System
11 5 (1.68%) Robotics
11 5 (1.68%) Security Posture
12 4 (1.35%) Data Centre
12 4 (1.35%) Onboarding
12 4 (1.35%) Online Banking
12 4 (1.35%) Tandem
13 3 (1.01%) Credit Risk
14 2 (0.67%) Algorithms
Operating Systems
1 34 (11.45%) Unix
2 28 (9.43%) Linux
3 27 (9.09%) Windows
4 13 (4.38%) AIX
5 12 (4.04%) Android
6 11 (3.70%) Apple iOS
7 5 (1.68%) Windows Server
8 3 (1.01%) Windows 7
8 3 (1.01%) Windows Server 2008
8 3 (1.01%) Windows XP
9 2 (0.67%) Windows 10
10 1 (0.34%) Debian
10 1 (0.34%) Embedded Linux
10 1 (0.34%) Mac OS
Processes & Methodologies
1 156 (52.53%) Agile
2 93 (31.31%) Analytics
3 79 (26.60%) Problem-Solving
4 67 (22.56%) Business Intelligence
5 61 (20.54%) Decision-Making
6 41 (13.80%) Cybersecurity
6 41 (13.80%) DevOps
7 35 (11.78%) CI/CD
7 35 (11.78%) Scrum
8 34 (11.45%) Customer Service
8 34 (11.45%) Software Engineering
8 34 (11.45%) Test Automation
9 33 (11.11%) Collaborative Working
10 31 (10.44%) Data Analytics
10 31 (10.44%) Machine Learning
11 29 (9.76%) Roadmaps
11 29 (9.76%) Visualisation
12 27 (9.09%) Infrastructure as Code
13 25 (8.42%) Artificial Intelligence
14 24 (8.08%) B2B
Programming Languages
1 70 (23.57%) SQL
2 58 (19.53%) Python
3 27 (9.09%) JavaScript
4 23 (7.74%) Java
5 17 (5.72%) PL/SQL
6 15 (5.05%) PHP
7 12 (4.04%) VBA
8 10 (3.37%) MATLAB
9 8 (2.69%) Ruby
10 7 (2.36%) Bash
11 6 (2.02%) PowerShell
12 5 (1.68%) C++
13 4 (1.35%) Kotlin
13 4 (1.35%) Perl
13 4 (1.35%) Rust
14 3 (1.01%) C#
14 3 (1.01%) Groovy
14 3 (1.01%) TypeScript
15 2 (0.67%) Scala
15 2 (0.67%) Swift
Qualifications
1 46 (15.49%) Security Cleared
2 39 (13.13%) Degree
3 12 (4.04%) SC Cleared
4 9 (3.03%) AWS Certification
5 8 (2.69%) HND
6 5 (1.68%) Cisco Certification
7 4 (1.35%) AWS Certified Solutions Architect
7 4 (1.35%) CISMP
7 4 (1.35%) PMP
8 3 (1.01%) CCNP
9 2 (0.67%) Azure Certification
9 2 (0.67%) CCNA
9 2 (0.67%) ITIL Certification
9 2 (0.67%) MCAD
9 2 (0.67%) Microsoft Certification
9 2 (0.67%) PMI Certification
10 1 (0.34%) Computer Science Degree
10 1 (0.34%) ISTQB Advanced Certification
10 1 (0.34%) ISTQB Foundation Certification
10 1 (0.34%) ITIL Foundation Certificate
Quality Assurance & Compliance
1 14 (4.71%) SLA
2 13 (4.38%) Data Quality
3 8 (2.69%) GRC
4 6 (2.02%) Accessibility
4 6 (2.02%) ISO/IEC 27001
5 5 (1.68%) PMO
5 5 (1.68%) QA
6 4 (1.35%) Cyber Essentials
6 4 (1.35%) GDPR
7 3 (1.01%) Actionable Recommendations
8 2 (0.67%) PCI DSS
9 1 (0.34%) COSHH
9 1 (0.34%) Cyber Essentials PLUS
9 1 (0.34%) NEBOSH
9 1 (0.34%) NIST
System Software
1 13 (4.38%) Docker
2 12 (4.04%) Active Directory
3 2 (0.67%) Virtual Machines
4 1 (0.34%) KVM
4 1 (0.34%) QEMU
4 1 (0.34%) VMware Infrastructure
Systems Management
1 25 (8.42%) Terraform
2 22 (7.41%) Kubernetes
3 12 (4.04%) Microsoft Intune
4 11 (3.70%) SCCM
5 8 (2.69%) Ansible
6 5 (1.68%) Istio
7 1 (0.34%) Grafana
Vendors
1 70 (23.57%) Microsoft
2 32 (10.77%) Oracle
3 31 (10.44%) Google
4 15 (5.05%) Teradata
5 12 (4.04%) ServiceNow
6 10 (3.37%) iManage
7 7 (2.36%) Cisco
7 7 (2.36%) ESRI
8 5 (1.68%) Apple
8 5 (1.68%) Siemens
9 4 (1.35%) CheckPoint
9 4 (1.35%) Citrix
9 4 (1.35%) F5
9 4 (1.35%) Fortinet
9 4 (1.35%) Rackspace
10 3 (1.01%) Okta
10 3 (1.01%) SAP
10 3 (1.01%) VMware
11 2 (0.67%) Nintex
11 2 (0.67%) Remedy