AWS Jobs in the South West

Amazon Web Services (AWS)
England > South West

The table below provides summary statistics for permanent job vacancies advertised in the South West requiring AWS skills. It includes a benchmarking guide to the annual salaries offered in vacancies that cited AWS over the 6 months leading up to 31 May 2025, comparing them to the same period in the previous two years.

6 months to
31 May 2025
Same period 2024 Same period 2023
Rank 18 13 8
Rank change year-on-year -5 -5 0
Permanent jobs citing AWS 314 950 1,081
As % of all permanent jobs advertised in the South West 8.85% 9.70% 16.30%
As % of the Cloud Services category 35.80% 34.58% 41.69%
Number of salaries quoted 242 609 626
10th Percentile £42,500 £37,500 £36,625
25th Percentile £47,666 £47,500 £45,000
Median annual salary (50th Percentile) £60,000 £60,000 £60,000
Median % change year-on-year - - -4.00%
75th Percentile £75,000 £77,500 £77,500
90th Percentile £95,000 £86,250 £88,750
England median annual salary £72,500 £70,000 £75,000
% change year-on-year +3.57% -6.67% -

All Cloud Skills
South West

AWS falls under the Cloud Services category. For comparison with the information above, the following table provides summary statistics for all permanent job vacancies requiring cloud computing skills in the South West.

Permanent vacancies with a requirement for cloud computing skills 877 2,747 2,593
As % of all permanent jobs advertised in the South West 24.73% 28.04% 39.11%
Number of salaries quoted 687 2,121 1,620
10th Percentile £29,750 £28,500 £30,500
25th Percentile £37,500 £37,500 £38,463
Median annual salary (50th Percentile) £55,000 £52,500 £55,000
Median % change year-on-year +4.76% -4.55% +4.76%
75th Percentile £70,000 £68,750 £70,000
90th Percentile £88,000 £82,500 £83,750
England median annual salary £60,000 £57,500 £65,000
% change year-on-year +4.35% -11.54% +4.00%

AWS
Job Vacancy Trend in the South West

Job postings citing AWS as a proportion of all IT jobs advertised in the South West.
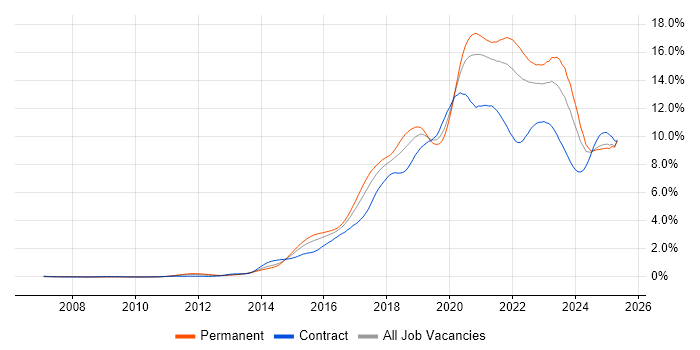
Job vacancy trend for AWS in the South West

AWS
Salary Trend in the South West

3-month moving average salary quoted in jobs citing AWS in the South West.

Salary trend for AWS in the South West

AWS
Salary Histogram in the South West

Salary distribution for jobs citing AWS in the South West over the 6 months to 31 May 2025.

Salary histogram for AWS in the South West

AWS
Job Locations in the South West

The table below looks at the demand and provides a guide to the median salaries quoted in IT jobs citing AWS within the South West region over the 6 months to 31 May 2025. The 'Rank Change' column provides an indication of the change in demand within each location based on the same 6 month period last year.

Location Rank Change
on Same Period
Last Year
Matching
Permanent
IT Job Ads
Median Salary
Past 6 Months
Median Salary
% Change
on Same Period
Last Year
Live
Jobs
Bristol -3 148 £60,000 -7.69% 140
Gloucestershire -18 48 £65,000 +8.33% 113
Wiltshire +32 36 £60,000 -11.11% 22
Dorset -5 31 £48,750 +8.33% 22
Devon +10 28 £55,000 -4.35% 24
Somerset -7 14 £62,500 +25.00% 18
Cornwall +6 2 £50,000 +25.00%
AWS
England

AWS
Co-occurring Skills and Capabilities in the South West by Category

The follow tables expand on the table above by listing co-occurrences grouped by category. The same employment type, locality and period is covered with up to 20 co-occurrences shown in each of the following categories:

Application Platforms
1 7 (2.23%) Confluence
2 4 (1.27%) Microsoft Exchange
3 3 (0.96%) nginx
4 2 (0.64%) Apache
4 2 (0.64%) Apache Airflow
4 2 (0.64%) CMS
4 2 (0.64%) Drupal
5 1 (0.32%) Apache Spark
5 1 (0.32%) Joomla!
5 1 (0.32%) Luigi
5 1 (0.32%) Oracle Application Server
5 1 (0.32%) WordPress
Applications
1 5 (1.59%) Microsoft Office
Business Applications
1 2 (0.64%) Dynamics AX
Cloud Services
1 151 (48.09%) Azure
2 60 (19.11%) GCP
3 56 (17.83%) Serverless
4 42 (13.38%) AWS Lambda
5 30 (9.55%) Amazon S3
6 21 (6.69%) GitHub
7 20 (6.37%) Amazon EC2
7 20 (6.37%) Microsoft 365
8 17 (5.41%) Power Platform
9 13 (4.14%) Snowflake
10 12 (3.82%) Entra ID
11 10 (3.18%) GitHub Actions
11 10 (3.18%) SaaS
12 7 (2.23%) Azure DevOps
12 7 (2.23%) Pulumi
13 6 (1.91%) Amazon SageMaker
14 5 (1.59%) Amazon EKS
14 5 (1.59%) AWS CloudTrail
14 5 (1.59%) AWS Step Functions
14 5 (1.59%) Cloud Computing
Communications & Networking
1 30 (9.55%) Firewall
2 20 (6.37%) Network Security
3 19 (6.05%) VPN
4 17 (5.41%) Broadband
5 13 (4.14%) WAN
6 11 (3.50%) Internet
7 8 (2.55%) SD-WAN
8 7 (2.23%) DNS
8 7 (2.23%) LAN
9 6 (1.91%) VLAN
10 5 (1.59%) DHCP
11 4 (1.27%) IPv4
11 4 (1.27%) SSL
12 3 (0.96%) DMZ
12 3 (0.96%) OSPF
12 3 (0.96%) TCP/IP
12 3 (0.96%) VoIP
12 3 (0.96%) Wi-Fi
12 3 (0.96%) Wireshark
13 2 (0.64%) Reverse Proxy
Database & Business Intelligence
1 42 (13.38%) MySQL
2 27 (8.60%) NoSQL
3 25 (7.96%) Relational Database
4 23 (7.32%) PostgreSQL
5 16 (5.10%) Amazon RDS
6 15 (4.78%) Power BI
7 14 (4.46%) SQL Server
8 12 (3.82%) Data Warehouse
8 12 (3.82%) MongoDB
9 11 (3.50%) DynamoDB
10 10 (3.18%) BigQuery
11 8 (2.55%) Big Data
11 8 (2.55%) RDBMS
12 7 (2.23%) Elasticsearch
13 6 (1.91%) Tableau
14 5 (1.59%) Data Hub
14 5 (1.59%) Data Lake
14 5 (1.59%) Looker
15 4 (1.27%) Amazon Aurora
16 3 (0.96%) Oracle ODI
Development Applications
1 52 (16.56%) Git
2 19 (6.05%) GitLab
3 15 (4.78%) Jenkins
3 15 (4.78%) JIRA
4 9 (2.87%) Selenium
5 7 (2.23%) JUnit
6 6 (1.91%) Jaeger
7 5 (1.59%) Cypress.io
8 4 (1.27%) Locust
9 2 (0.64%) CircleCI
9 2 (0.64%) Cucumber
9 2 (0.64%) Gatling
9 2 (0.64%) LoadRunner
9 2 (0.64%) Maven
9 2 (0.64%) Mockito
9 2 (0.64%) TestRail
9 2 (0.64%) Visual Studio
9 2 (0.64%) Zephyr
10 1 (0.32%) SpecFlow
10 1 (0.32%) Team Foundation Server
General
1 94 (29.94%) Finance
2 63 (20.06%) Social Skills
3 38 (12.10%) Analytical Skills
4 30 (9.55%) Banking
5 27 (8.60%) Inclusion and Diversity
6 22 (7.01%) Public Sector
7 19 (6.05%) Manufacturing
8 18 (5.73%) Retail
9 17 (5.41%) Law
10 14 (4.46%) Electronics
11 13 (4.14%) Games
11 13 (4.14%) Marketing
12 10 (3.18%) Influencing Skills
12 10 (3.18%) Telecoms
13 6 (1.91%) Aerospace
14 5 (1.59%) Automotive
14 5 (1.59%) Documentation Skills
15 3 (0.96%) Pharmaceutical
15 3 (0.96%) Tech for Good
16 2 (0.64%) Financial Institution
Job Titles
1 75 (23.89%) Developer
2 60 (19.11%) Lead
3 56 (17.83%) Software Engineer
4 45 (14.33%) Senior
5 26 (8.28%) Senior Developer
6 25 (7.96%) Architect
7 22 (7.01%) Cloud Engineer
7 22 (7.01%) Full-Stack Developer
8 16 (5.10%) Java Engineer
8 16 (5.10%) Security Engineer
8 16 (5.10%) Software Developer
9 15 (4.78%) Data Engineer
10 14 (4.46%) Analyst
10 14 (4.46%) Java Software Engineer
10 14 (4.46%) Team Leader
11 13 (4.14%) Full-Stack Engineer
11 13 (4.14%) PHP Developer
12 12 (3.82%) Full-Stack Software Engineer
13 11 (3.50%) Lead Cloud Engineer
14 10 (3.18%) DevOps Engineer
Libraries, Frameworks & Software Standards
1 69 (21.97%) React
2 41 (13.06%) Node.js
3 33 (10.51%) Spring Boot
4 27 (8.60%) Spring
5 26 (8.28%) CSS
6 25 (7.96%) AngularJS
6 25 (7.96%) HTML
7 21 (6.69%) Kafka
8 20 (6.37%) RESTful
9 19 (6.05%) Laravel
10 18 (5.73%) .NET
11 16 (5.10%) Vue
12 15 (4.78%) GraphQL
13 14 (4.46%) LAMP
13 14 (4.46%) REST
14 10 (3.18%) .NET Core
15 8 (2.55%) Symfony
16 7 (2.23%) Tailwind CSS
17 6 (1.91%) Next.js
17 6 (1.91%) OpenTelemetry
Miscellaneous
1 19 (6.05%) Cloud Native
2 17 (5.41%) IoT
3 15 (4.78%) Mobile App
3 15 (4.78%) Private Cloud
4 14 (4.46%) Management Information System
5 13 (4.14%) Public Cloud
6 12 (3.82%) Algorithms
7 11 (3.50%) Hybrid Cloud
8 8 (2.55%) Data Structures
8 8 (2.55%) Security Posture
8 8 (2.55%) Self-Motivation
9 7 (2.23%) Cyber Threat
9 7 (2.23%) Reinsurance
10 5 (1.59%) Product Ownership
10 5 (1.59%) Robotics
10 5 (1.59%) Video Conferencing
11 4 (1.27%) N-Tier
11 4 (1.27%) PKI
11 4 (1.27%) Security Operations Centre
12 3 (0.96%) Greenfield Project
Operating Systems
1 33 (10.51%) Linux
2 23 (7.32%) Windows
3 8 (2.55%) Windows Server
4 7 (2.23%) Unix
5 5 (1.59%) Apple iOS
6 3 (0.96%) Red Hat Enterprise Linux
6 3 (0.96%) Windows Server 2012
7 2 (0.64%) Android
Processes & Methodologies
1 111 (35.35%) Agile
2 97 (30.89%) CI/CD
3 95 (30.25%) DevOps
3 95 (30.25%) Software Engineering
4 58 (18.47%) Mentoring
4 58 (18.47%) Problem-Solving
5 56 (17.83%) Microservices
6 55 (17.52%) Full-Stack Development
7 44 (14.01%) Containerisation
8 36 (11.46%) Machine Learning
8 36 (11.46%) Roadmaps
9 35 (11.15%) Test Automation
10 34 (10.83%) Artificial Intelligence
10 34 (10.83%) Infrastructure as Code
11 30 (9.55%) Analytics
11 30 (9.55%) Business Intelligence
11 30 (9.55%) Cloud Security
11 30 (9.55%) Scrum
12 26 (8.28%) Data Modelling
13 25 (7.96%) Data Science
Programming Languages
1 90 (28.66%) Python
2 82 (26.11%) Java
3 75 (23.89%) JavaScript
4 57 (18.15%) SQL
5 43 (13.69%) TypeScript
6 32 (10.19%) PHP
7 26 (8.28%) C#
8 21 (6.69%) Bash
9 16 (5.10%) PowerShell
10 10 (3.18%) Go
11 7 (2.23%) C++
12 6 (1.91%) R
13 2 (0.64%) Julia
14 1 (0.32%) Bicep
14 1 (0.32%) C
14 1 (0.32%) Perl
14 1 (0.32%) PL/SQL
14 1 (0.32%) Rust
14 1 (0.32%) Shell Script
14 1 (0.32%) VB
Qualifications
1 70 (22.29%) Security Cleared
2 46 (14.65%) SC Cleared
3 39 (12.42%) AWS Certification
4 37 (11.78%) Degree
5 26 (8.28%) DV Cleared
6 16 (5.10%) Azure Certification
6 16 (5.10%) CISSP
7 13 (4.14%) Cisco Certification
8 11 (3.50%) CISM
9 10 (3.18%) Microsoft Certification
10 9 (2.87%) AWS Certified Solutions Architect
10 9 (2.87%) CCNA
10 9 (2.87%) Computer Science Degree
11 8 (2.55%) PhD
12 7 (2.23%) ITIL Certification
13 6 (1.91%) MCP
14 5 (1.59%) AWS Certified DevOps Engineer
15 4 (1.27%) CCNP
15 4 (1.27%) ISTQB
15 4 (1.27%) MCSA
Quality Assurance & Compliance
1 20 (6.37%) NIST
2 12 (3.82%) GDPR
2 12 (3.82%) ISO/IEC 27001
3 11 (3.50%) QA
4 7 (2.23%) Accessibility
5 6 (1.91%) NCSC
5 6 (1.91%) PCI DSS
6 3 (0.96%) Cyber Essentials
6 3 (0.96%) GMP
6 3 (0.96%) SOC 2
7 2 (0.64%) COBIT
7 2 (0.64%) Cyber Essentials PLUS
7 2 (0.64%) Data Quality
7 2 (0.64%) HIPAA
7 2 (0.64%) ISO/IEC 27002 (supersedes ISO/IEC 17799)
8 1 (0.32%) California Consumer Privacy Act
8 1 (0.32%) GRC
8 1 (0.32%) ISO 9001
System Software
1 71 (22.61%) Docker
2 15 (4.78%) Active Directory
3 8 (2.55%) Hyper-V
3 8 (2.55%) VMware Infrastructure
4 2 (0.64%) Virtual Machines
4 2 (0.64%) vSphere
5 1 (0.32%) Slurm Workload Manager
5 1 (0.32%) VMware NSX
Systems Management
1 69 (21.97%) Kubernetes
2 42 (13.38%) Terraform
3 28 (8.92%) Ansible
4 10 (3.18%) Microsoft Intune
5 9 (2.87%) Prometheus
6 8 (2.55%) Argo
7 6 (1.91%) Kustomize
7 6 (1.91%) Puppet
8 4 (1.27%) Progress Chef
8 4 (1.27%) SCCM
9 3 (0.96%) Grafana
9 3 (0.96%) Iperf
9 3 (0.96%) Single Sign-On
10 2 (0.64%) Graylog
10 2 (0.64%) Host Intrusion Detection System
10 2 (0.64%) Kibana
11 1 (0.32%) Nagios
11 1 (0.32%) Packer
11 1 (0.32%) vCenter Server
Vendors
1 30 (9.55%) Google
2 28 (8.92%) Microsoft
3 20 (6.37%) Oracle
4 17 (5.41%) Databricks
5 13 (4.14%) VMware
6 12 (3.82%) Cisco
6 12 (3.82%) Fortinet
7 6 (1.91%) SAP
8 5 (1.59%) Aruba
8 5 (1.59%) F5
8 5 (1.59%) Okta
9 3 (0.96%) Citrix
9 3 (0.96%) IBM
9 3 (0.96%) Ruckus Wireless
9 3 (0.96%) ServiceNow
9 3 (0.96%) SonicWALL
9 3 (0.96%) Twitter
10 2 (0.64%) HP
10 2 (0.64%) Red Hat
10 2 (0.64%) Sybase