Management Information System Jobs in the South West

Management Information Systems
England > South West

The table below looks at the prevalence of the term Management Information System in permanent job vacancies in the South West. Included is a benchmarking guide to the salaries offered in vacancies that cited Management Information System over the 6 months leading up to 26 July 2024, comparing them to the same period in the previous two years.

6 months to
26 Jul 2024
Same period 2023 Same period 2022
Rank 98 59 71
Rank change year-on-year -39 +12 +59
Permanent jobs citing Management Information System 208 297 411
As % of all permanent jobs advertised in the South West 2.37% 4.77% 4.49%
As % of the Miscellaneous category 8.61% 11.82% 10.88%
Number of salaries quoted 103 211 203
10th Percentile £28,000 £30,725 £31,704
25th Percentile £30,375 £39,294 £38,687
Median annual salary (50th Percentile) £45,000 £60,800 £47,520
Median % change year-on-year -25.99% +27.95% +5.60%
75th Percentile £61,885 £73,750 £65,000
90th Percentile £76,500 £85,000 £90,000
England median annual salary £50,000 £60,000 £55,000
% change year-on-year -16.67% +9.09% -

All Generic Skills
South West

Management Information System falls under the General and Transferable Skills category. For comparison with the information above, the following table provides summary statistics for all permanent job vacancies requiring generic IT skills in the South West.

Permanent vacancies with a requirement for generic IT skills 2,417 2,513 3,778
As % of all permanent jobs advertised in the South West 27.48% 40.38% 41.29%
Number of salaries quoted 1,604 1,499 1,967
10th Percentile £29,307 £28,700 £28,500
25th Percentile £37,199 £37,939 £38,750
Median annual salary (50th Percentile) £50,000 £55,000 £52,500
Median % change year-on-year -9.09% +4.76% +16.67%
75th Percentile £67,500 £72,000 £72,500
90th Percentile £82,500 £85,000 £86,250
England median annual salary £56,124 £65,000 £62,500
% change year-on-year -13.66% +4.00% +4.17%

Management Information System
Job Vacancy Trend in the South West

Job postings citing Management Information System as a proportion of all IT jobs advertised in the South West.
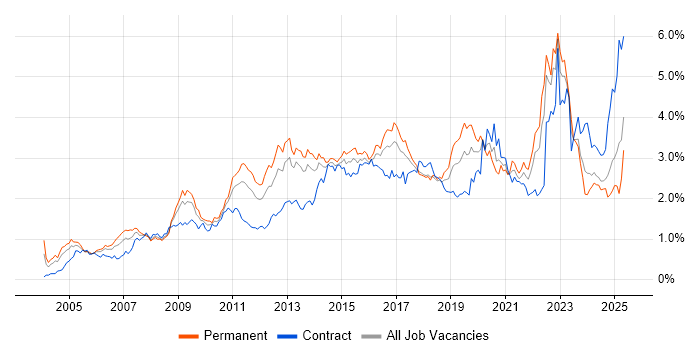
Job vacancy trend for Management Information System in the South West

Management Information System
Salary Trend in the South West

3-month moving average salary quoted in jobs citing Management Information System in the South West.

Salary trend for Management Information System in the South West

Management Information System
Salary Histogram in the South West

Salary distribution for jobs citing Management Information System in the South West over the 6 months to 26 July 2024.

Salary histogram for Management Information System in the South West

Management Information System
Job Locations in the South West

The table below looks at the demand and provides a guide to the median salaries quoted in IT jobs citing Management Information System within the South West region over the 6 months to 26 July 2024. The 'Rank Change' column provides an indication of the change in demand within each location based on the same 6 month period last year.

Location Rank Change
on Same Period
Last Year
Matching
Permanent
IT Job Ads
Median Salary
Past 6 Months
Median Salary
% Change
on Same Period
Last Year
Live
Jobs
Bristol +24 73 £60,202 +6.74% 25
Wiltshire -6 35 £38,750 -44.64% 18
Gloucestershire -31 32 £50,000 -17.76% 20
Dorset -30 30 £35,000 -42.53% 10
Devon -25 20 £39,005 -0.62% 12
Cornwall -4 12 £39,005 +10.65% 4
Somerset -32 6 £29,750 -52.40% 20
Management Information System
England

Management Information System
Co-occurring Skills and Capabilities in the South West by Category

The follow tables expand on the table above by listing co-occurrences grouped by category. The same employment type, locality and period is covered with up to 20 co-occurrences shown in each of the following categories:

Application Platforms
1 7 (3.37%) SAS
1 7 (3.37%) SharePoint
2 5 (2.40%) Microsoft Exchange
3 3 (1.44%) Confluence
4 2 (0.96%) Oracle Workflow
5 1 (0.48%) ArcGIS
5 1 (0.48%) IIS
Applications
1 10 (4.81%) Microsoft Excel
2 9 (4.33%) Microsoft Office
2 9 (4.33%) Spreadsheet
3 5 (2.40%) Microsoft PowerPoint
4 1 (0.48%) 1Password
4 1 (0.48%) Microsoft Project
Business Applications
1 7 (3.37%) Dynamics NAV
2 1 (0.48%) Dynamics CRM
2 1 (0.48%) Maximo
2 1 (0.48%) Sparx Enterprise Architect
Cloud Services
1 23 (11.06%) AWS
2 18 (8.65%) Azure
3 17 (8.17%) SaaS
4 15 (7.21%) Microsoft 365
5 12 (5.77%) Power Platform
6 10 (4.81%) Entra ID
7 7 (3.37%) IaaS
8 4 (1.92%) PaaS
9 3 (1.44%) GCP
9 3 (1.44%) WhatsApp
10 2 (0.96%) GitHub
11 1 (0.48%) Adobe Creative Cloud
11 1 (0.48%) Azure Synapse Analytics
11 1 (0.48%) Cloud Computing
11 1 (0.48%) Dynamics 365
11 1 (0.48%) Microsoft Purview
11 1 (0.48%) Mimecast
11 1 (0.48%) OneDrive
11 1 (0.48%) Snowflake
Communications & Networking
1 7 (3.37%) Firewall
2 4 (1.92%) SAN
2 4 (1.92%) TCP/IP
2 4 (1.92%) VPN
3 3 (1.44%) DHCP
3 3 (1.44%) DNS
3 3 (1.44%) WAN
4 2 (0.96%) Cisco ASA
4 2 (0.96%) MPLS
4 2 (0.96%) SD-WAN
4 2 (0.96%) VoIP
4 2 (0.96%) Wi-Fi
5 1 (0.48%) Broadband
5 1 (0.48%) Gigabit Ethernet
5 1 (0.48%) LAN
5 1 (0.48%) NetScaler
5 1 (0.48%) Network Security
5 1 (0.48%) OpenVPN
5 1 (0.48%) Wireless
5 1 (0.48%) WPA
Database & Business Intelligence
1 17 (8.17%) SQL Server
2 13 (6.25%) Oracle Database
3 11 (5.29%) Power BI
4 8 (3.85%) MySQL
4 8 (3.85%) Tableau
5 5 (2.40%) Data Vault
6 4 (1.92%) Electronic Patient Records
6 4 (1.92%) Power Query
7 2 (0.96%) Big Data
8 1 (0.48%) Data Warehouse
8 1 (0.48%) Geospatial Data
8 1 (0.48%) GIS
8 1 (0.48%) Oracle Reports
8 1 (0.48%) PowerPivot
8 1 (0.48%) Relational Database
Development Applications
1 13 (6.25%) Oracle Forms
2 6 (2.88%) JIRA
3 3 (1.44%) Bitbucket
3 3 (1.44%) Git
3 3 (1.44%) Rational DOORS
4 2 (0.96%) YouTrack
General
1 54 (25.96%) Finance
2 50 (24.04%) Social Skills
3 35 (16.83%) Banking
4 31 (14.90%) Analytical Skills
5 21 (10.10%) Legal
6 14 (6.73%) Inclusion and Diversity
6 14 (6.73%) Law
7 12 (5.77%) Investment Banking
7 12 (5.77%) Public Sector
8 11 (5.29%) Telecoms
9 9 (4.33%) Military
10 7 (3.37%) Retail
11 6 (2.88%) Influencing Skills
12 5 (2.40%) Aerospace
12 5 (2.40%) Publishing
13 4 (1.92%) Presentation Skills
14 2 (0.96%) Financial Institution
14 2 (0.96%) Marketing
15 1 (0.48%) Electronics
15 1 (0.48%) Manufacturing
Job Titles
1 26 (12.50%) Architect
2 25 (12.02%) IT Support
3 20 (9.62%) Senior
4 17 (8.17%) Technical Architect
5 16 (7.69%) Support Technician
5 16 (7.69%) Systems Engineer
6 15 (7.21%) Analyst
6 15 (7.21%) Infrastructure Engineer
6 15 (7.21%) IT Support Technician
6 15 (7.21%) IT Technician
6 15 (7.21%) Project Manager
7 12 (5.77%) Lead
8 11 (5.29%) Linux Engineer
9 9 (4.33%) Administrator
10 8 (3.85%) Linux Systems Engineer
10 8 (3.85%) Systems Administrator
11 7 (3.37%) Consultant
11 7 (3.37%) IT Manager
12 6 (2.88%) Coordinator
12 6 (2.88%) Junior
Libraries, Frameworks & Software Standards
1 5 (2.40%) Middleware
1 5 (2.40%) XML
2 3 (1.44%) .NET
3 2 (0.96%) CSS
3 2 (0.96%) EDI
3 2 (0.96%) HTML
3 2 (0.96%) X-Windows
Miscellaneous
1 22 (10.58%) Driving Licence
2 13 (6.25%) Data Centre
3 11 (5.29%) Data Protection Act
4 8 (3.85%) Freedom of Information
5 7 (3.37%) Client/Server
5 7 (3.37%) Operational Technology
6 6 (2.88%) Algorithms
6 6 (2.88%) Credit Risk
6 6 (2.88%) Market Risk
6 6 (2.88%) NHS
6 6 (2.88%) Onboarding
6 6 (2.88%) PMI
7 4 (1.92%) Analytical Mindset
7 4 (1.92%) Self-Motivation
8 3 (1.44%) Low-Code
8 3 (1.44%) Security Posture
8 3 (1.44%) VAX
9 2 (0.96%) Cyber Defence
9 2 (0.96%) Cyber Kill Chain
9 2 (0.96%) Mobile App
Operating Systems
1 39 (18.75%) Windows
2 34 (16.35%) Linux
3 22 (10.58%) Windows 10
4 17 (8.17%) Windows Server
5 9 (4.33%) Ubuntu
5 9 (4.33%) Unix
6 8 (3.85%) Debian
7 5 (2.40%) Windows Server 2016
8 4 (1.92%) Windows 7
8 4 (1.92%) Windows Server 2008
9 3 (1.44%) Windows Server 2019
10 2 (0.96%) Red Hat Enterprise Linux
11 1 (0.48%) Android
11 1 (0.48%) Apple iOS
11 1 (0.48%) Mac OS
11 1 (0.48%) Windows 8
11 1 (0.48%) Windows Server 2003
11 1 (0.48%) Windows Server 2012
Processes & Methodologies
1 71 (34.13%) Information Security
2 56 (26.92%) Problem-Solving
3 44 (21.15%) Agile
4 41 (19.71%) Project Management
5 34 (16.35%) Computer Science
6 33 (15.87%) Configuration Management
7 32 (15.38%) ITIL
7 32 (15.38%) Risk Management
8 28 (13.46%) TOGAF
9 26 (12.50%) ArchiMate
10 25 (12.02%) Customer Service
10 25 (12.02%) Service Management
11 24 (11.54%) Cybersecurity
11 24 (11.54%) ITSM
12 22 (10.58%) Change Management
13 21 (10.10%) Service Design
14 20 (9.62%) Coaching
14 20 (9.62%) MODAF
15 19 (9.13%) Service Delivery
15 19 (9.13%) Technical Architecture
Programming Languages
1 23 (11.06%) SQL
2 22 (10.58%) Python
3 10 (4.81%) PowerShell
4 7 (3.37%) Bash
5 6 (2.88%) JavaScript
5 6 (2.88%) R
6 5 (2.40%) PHP
7 4 (1.92%) C++
7 4 (1.92%) Perl
8 1 (0.48%) C#
8 1 (0.48%) Java
Qualifications
1 83 (39.90%) Security Cleared
2 77 (37.02%) Degree
3 34 (16.35%) SC Cleared
4 31 (14.90%) Computer Science Degree
5 16 (7.69%) CISSP
5 16 (7.69%) DV Cleared
6 15 (7.21%) A+ Certification
6 15 (7.21%) CISM
7 7 (3.37%) CESG Certified Professional
7 7 (3.37%) PMI Certification
8 5 (2.40%) CRISC
8 5 (2.40%) HNC
8 5 (2.40%) HND
9 4 (1.92%) CEH
9 4 (1.92%) CISA
9 4 (1.92%) Cisco Certification
10 2 (0.96%) AWS Certification
10 2 (0.96%) BPSS Clearance
10 2 (0.96%) SAFe Agilist
11 1 (0.48%) (ISC)2 CCSP
Quality Assurance & Compliance
1 26 (12.50%) SLA
2 25 (12.02%) ISO/IEC 27001
3 15 (7.21%) Cyber Essentials
4 8 (3.85%) NIST
4 8 (3.85%) PMO
4 8 (3.85%) RMADS
5 7 (3.37%) GDPR
6 6 (2.88%) JSP 440
6 6 (2.88%) NCSC
7 4 (1.92%) QA
8 3 (1.44%) Data Quality
8 3 (1.44%) GRC
8 3 (1.44%) NIST 800
9 1 (0.48%) Cyber Essentials PLUS
9 1 (0.48%) ECSS
9 1 (0.48%) HMG Security Policy Framework
9 1 (0.48%) ISO 13485
9 1 (0.48%) ISO/IEC 27002 (supersedes ISO/IEC 17799)
9 1 (0.48%) PCI DSS
9 1 (0.48%) SOC 2
System Software
1 26 (12.50%) Active Directory
2 19 (9.13%) VMware Infrastructure
3 7 (3.37%) Virtual Machines
4 5 (2.40%) RACF
5 4 (1.92%) Lustre
5 4 (1.92%) Slurm Workload Manager
6 3 (1.44%) XenApp
7 2 (0.96%) Firmware
7 2 (0.96%) vSphere
8 1 (0.48%) VMware ESXi
8 1 (0.48%) XenDesktop
Systems Management
1 5 (2.40%) Microsoft Intune
2 3 (1.44%) EMC VPLEX
2 3 (1.44%) Nagios
3 2 (0.96%) FortiGate
4 1 (0.48%) Host Intrusion Detection System
4 1 (0.48%) Oracle Enterprise Manager
4 1 (0.48%) SCCM
4 1 (0.48%) vCenter Server
4 1 (0.48%) WSUS
Vendors
1 71 (34.13%) Microsoft
2 19 (9.13%) VMware
3 18 (8.65%) Cisco
4 17 (8.17%) Oracle
5 15 (7.21%) Red Hat
6 13 (6.25%) HP
7 7 (3.37%) Salesforce
8 6 (2.88%) Alteryx
8 6 (2.88%) Pega
8 6 (2.88%) UiPath
9 5 (2.40%) CyberArk
10 4 (1.92%) Citrix
10 4 (1.92%) Veeam
11 3 (1.44%) Centreon
11 3 (1.44%) Dell
11 3 (1.44%) EMC
11 3 (1.44%) Meraki
11 3 (1.44%) Sybase
12 2 (0.96%) Kofax
12 2 (0.96%) Zoho