IBM Jobs in the South West

IBM
England > South West

The table below provides summary statistics for permanent job vacancies advertised in the South West requiring knowledge or experience of IBM products and/or services. It includes a benchmarking guide to the annual salaries offered in vacancies that cited IBM over the 6 months leading up to 24 October 2024, comparing them to the same period in the previous two years.

The figures below represent the IT labour market in general and are not representative of salaries within the International Business Machines Corporation.

6 months to
24 Oct 2024
Same period 2023 Same period 2022
Rank 187 204 144
Rank change year-on-year +17 -60 +107
Permanent jobs citing IBM 51 35 191
As % of all permanent jobs advertised in the South West 0.72% 0.68% 2.29%
As % of the Vendors category 2.54% 1.74% 5.46%
Number of salaries quoted 29 29 51
10th Percentile £40,000 £34,854 £31,275
25th Percentile £51,000 £45,000 £42,000
Median annual salary (50th Percentile) £55,000 £65,351 £57,500
Median % change year-on-year -15.84% +13.65% +21.05%
75th Percentile £77,500 £72,500 £75,000
90th Percentile £80,000 £81,312 £116,246
England median annual salary £51,619 £65,000 £56,407
% change year-on-year -20.59% +15.23% -5.99%

All Vendors
South West

IBM falls under the Vendor Products and Services category. For comparison with the information above, the following table provides summary statistics for all permanent job vacancies requiring knowledge or experience of all vendor products and services in the South West.

Permanent vacancies with a requirement for knowledge or experience of vendor products and services 2,006 2,007 3,498
As % of all permanent jobs advertised in the South West 28.44% 39.20% 41.98%
Number of salaries quoted 900 1,415 1,951
10th Percentile £29,975 £29,464 £26,750
25th Percentile £35,000 £36,750 £33,700
Median annual salary (50th Percentile) £48,000 £50,000 £45,000
Median % change year-on-year -4.00% +11.11% -
75th Percentile £63,750 £63,750 £61,250
90th Percentile £80,000 £77,715 £78,588
England median annual salary £57,500 £57,500 £56,407
% change year-on-year - +1.94% +2.56%

IBM
Job Vacancy Trend in the South West

Job postings citing IBM as a proportion of all IT jobs advertised in the South West.
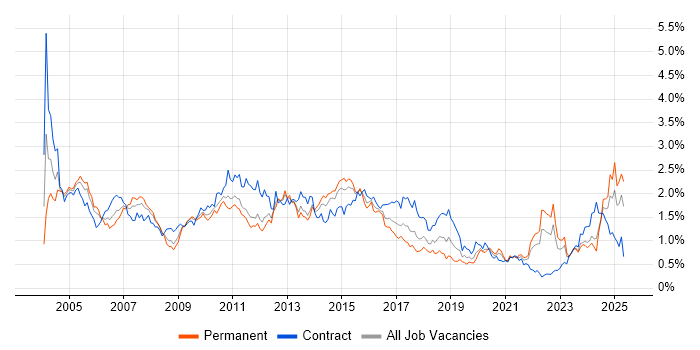
Job vacancy trend for IBM in the South West

IBM
Salary Trend in the South West

3-month moving average salary quoted in jobs citing IBM in the South West.

Salary trend for IBM in the South West

IBM
Salary Histogram in the South West

Salary distribution for jobs citing IBM in the South West over the 6 months to 24 October 2024.

Salary histogram for IBM in the South West

IBM
Job Locations in the South West

The table below looks at the demand and provides a guide to the median salaries quoted in IT jobs citing IBM within the South West region over the 6 months to 24 October 2024. The 'Rank Change' column provides an indication of the change in demand within each location based on the same 6 month period last year.

Location Rank Change
on Same Period
Last Year
Matching
Permanent
IT Job Ads
Median Salary
Past 6 Months
Median Salary
% Change
on Same Period
Last Year
Live
Jobs
Gloucestershire - 17 - - 2
Wiltshire -11 13 £75,000 +17.19% 1
Bristol +5 10 £54,000 -23.49% 3
Devon -1 5 £40,000 +14.76% 1
Dorset -13 5 £52,000 -42.22% 1
IBM
England

IBM
Co-occurring Skills and Capabilities in the South West by Category

The follow tables expand on the table above by listing co-occurrences grouped by category. The same employment type, locality and period is covered with up to 20 co-occurrences shown in each of the following categories:

Application Platforms
1 16 (31.37%) SharePoint
2 13 (25.49%) ArcGIS
Applications
1 11 (21.57%) Microsoft Office
2 3 (5.88%) Microsoft Project
3 1 (1.96%) Simulink
Business Applications
1 13 (25.49%) Maximo
2 2 (3.92%) Sparx Enterprise Architect
Cloud Services
1 17 (33.33%) Azure
1 17 (33.33%) IBM Cloud
2 8 (15.69%) AWS
3 6 (11.76%) Amazon ECR
3 6 (11.76%) Amazon EKS
3 6 (11.76%) Amazon S3
3 6 (11.76%) OCI
3 6 (11.76%) Route 53
4 3 (5.88%) Azure Stack
4 3 (5.88%) Cohesity
4 3 (5.88%) Entra ID
4 3 (5.88%) Microsoft 365
4 3 (5.88%) Miro
4 3 (5.88%) OneDrive
5 2 (3.92%) OpenShift
6 1 (1.96%) GCP
Communications & Networking
1 3 (5.88%) DNS
1 3 (5.88%) FTP
1 3 (5.88%) Network Security
1 3 (5.88%) SDH
Database & Business Intelligence
1 13 (25.49%) DB2
1 13 (25.49%) MongoDB
1 13 (25.49%) SQL Server
2 11 (21.57%) NoSQL
2 11 (21.57%) PostgreSQL
3 6 (11.76%) Amazon RDS
4 2 (3.92%) RDBMS
4 2 (3.92%) Relational Database
5 1 (1.96%) Data Warehouse
Development Applications
1 8 (15.69%) Visual Studio
2 7 (13.73%) Rational DOORS
3 5 (9.80%) JIRA
4 2 (3.92%) Jenkins
4 2 (3.92%) Rational Rhapsody
5 1 (1.96%) Rational Team Concert
General
1 20 (39.22%) Public Sector
2 17 (33.33%) Inclusion and Diversity
3 15 (29.41%) Social Skills
4 13 (25.49%) Back Office
5 8 (15.69%) Finance
5 8 (15.69%) Military
6 3 (5.88%) Retail
7 2 (3.92%) Analytical Skills
7 2 (3.92%) Presentation Skills
8 1 (1.96%) Law
8 1 (1.96%) Manufacturing
Job Titles
1 11 (21.57%) Architect
1 11 (21.57%) Full-Stack Engineer
2 10 (19.61%) Solutions Architect
3 9 (17.65%) Lead
4 6 (11.76%) .NET Architect
4 6 (11.76%) .NET Solutions Architect
4 6 (11.76%) DevOps Engineer
5 5 (9.80%) Administrator
5 5 (9.80%) DBA
6 3 (5.88%) Project Manager
6 3 (5.88%) Wintel Engineer
7 2 (3.92%) 3rd Line Engineer
7 2 (3.92%) AWS DevOps
7 2 (3.92%) AWS DevOps Engineer
7 2 (3.92%) AWS Engineer
7 2 (3.92%) Lead DevOps
7 2 (3.92%) Lead DevOps Engineer
7 2 (3.92%) Senior
7 2 (3.92%) Senior DevOps
7 2 (3.92%) Senior DevOps Engineer
Libraries, Frameworks & Software Standards
1 19 (37.25%) .NET
2 12 (23.53%) Web Services
3 11 (21.57%) ADO
3 11 (21.57%) AngularJS
3 11 (21.57%) ASP.NET
3 11 (21.57%) ASP.NET Core
3 11 (21.57%) Backbone.js
3 11 (21.57%) CSS
3 11 (21.57%) Ember.js
3 11 (21.57%) HTML
3 11 (21.57%) jQuery
3 11 (21.57%) React
3 11 (21.57%) REST
3 11 (21.57%) Twitter Bootstrap
3 11 (21.57%) Vue
4 4 (7.84%) .NET Framework
5 2 (3.92%) Spring
5 2 (3.92%) Spring XD
6 1 (1.96%) EDI
6 1 (1.96%) XML
Miscellaneous
1 18 (35.29%) Hybrid Cloud
2 17 (33.33%) Blockchain
2 17 (33.33%) e-Learning
3 15 (29.41%) Algorithms
4 11 (21.57%) Data Structures
5 3 (5.88%) Driving Licence
6 1 (1.96%) Data Centre
Operating Systems
1 14 (27.45%) Windows
2 13 (25.49%) Linux
3 11 (21.57%) Android
3 11 (21.57%) Apple iOS
4 3 (5.88%) Windows Server 2008
4 3 (5.88%) Windows Server 2012
4 3 (5.88%) Windows Server 2016
4 3 (5.88%) Windows Server 2019
5 1 (1.96%) Red Hat Enterprise Linux
5 1 (1.96%) Solaris
5 1 (1.96%) Unix
Processes & Methodologies
1 32 (62.75%) Agile
2 18 (35.29%) Artificial Intelligence
2 18 (35.29%) Mentoring
3 17 (33.33%) Coaching
4 14 (27.45%) Problem-Solving
4 14 (27.45%) TOGAF
5 13 (25.49%) Roadmaps
6 11 (21.57%) Asset Management
6 11 (21.57%) Co-Creation
6 11 (21.57%) Code Quality
6 11 (21.57%) Design Patterns
6 11 (21.57%) Design Thinking
6 11 (21.57%) Full-Stack Development
6 11 (21.57%) MVC
6 11 (21.57%) MVVM
6 11 (21.57%) Responsive Web Design
6 11 (21.57%) SOLID
6 11 (21.57%) Strategic Roadmap
6 11 (21.57%) User Experience
6 11 (21.57%) Web Development
Programming Languages
1 14 (27.45%) SQL
2 11 (21.57%) C#
2 11 (21.57%) JavaScript
3 2 (3.92%) Java
4 1 (1.96%) MATLAB
Qualifications
1 17 (33.33%) Security Cleared
2 14 (27.45%) SC Cleared
3 8 (15.69%) TOGAF Certification
4 5 (9.80%) BPSS Clearance
5 4 (7.84%) Degree
6 3 (5.88%) MCSA
6 3 (5.88%) Microsoft Certification
7 2 (3.92%) Chartered Engineer
7 2 (3.92%) DV Cleared
8 1 (1.96%) AWS Certification
8 1 (1.96%) Azure Certification
Quality Assurance & Compliance
1 2 (3.92%) COBIT
System Software
1 7 (13.73%) VMware Infrastructure
2 6 (11.76%) Active Directory
3 4 (7.84%) Hyper-V
3 4 (7.84%) VMware ESXi
4 3 (5.88%) VMware Workstation
5 2 (3.92%) Docker
Systems Management
1 7 (13.73%) Kubernetes
1 7 (13.73%) SCOM
2 6 (11.76%) Prometheus
2 6 (11.76%) SCCM
2 6 (11.76%) Terraform
3 4 (7.84%) Tivoli Identity Manager
4 1 (1.96%) Ansible
4 1 (1.96%) Rancher
4 1 (1.96%) Red Hat Satellite
Vendors
1 18 (35.29%) Red Hat
2 17 (33.33%) Microsoft
3 13 (25.49%) ESRI
4 7 (13.73%) VMware
5 6 (11.76%) Dynatrace
6 5 (9.80%) HP
7 4 (7.84%) Cisco
7 4 (7.84%) Dell
8 3 (5.88%) Citrix
8 3 (5.88%) F5
8 3 (5.88%) Juniper
8 3 (5.88%) McAfee
8 3 (5.88%) Nokia
8 3 (5.88%) Palo Alto
9 2 (3.92%) Oracle
9 2 (3.92%) Sparx
9 2 (3.92%) Sybase
10 1 (1.96%) IBM Sterling