IBM Jobs in England

IBM
UK > England

The table below provides summary statistics for permanent job vacancies advertised in England requiring knowledge or experience of IBM products and/or services. It includes a benchmarking guide to the annual salaries offered in vacancies that cited IBM over the 6 months leading up to 30 May 2025, comparing them to the same period in the previous two years.

The figures below represent the IT labour market in general and are not representative of salaries within the International Business Machines Corporation.

6 months to
30 May 2025
Same period 2024 Same period 2023
Rank 181 271 375
Rank change year-on-year +90 +104 +63
Permanent jobs citing IBM 934 904 734
As % of all permanent jobs advertised in England 1.91% 1.01% 0.85%
As % of the Vendors category 4.85% 2.83% 2.03%
Number of salaries quoted 564 386 337
10th Percentile £37,574 £32,500 £32,618
25th Percentile £57,500 £45,000 £46,250
Median annual salary (50th Percentile) £62,000 £55,000 £60,000
Median % change year-on-year +12.73% -8.33% -
75th Percentile £70,600 £71,250 £72,500
90th Percentile - £83,759 £90,000
UK median annual salary £62,000 £57,000 £60,000
% change year-on-year +8.77% -5.00% -

All Vendors
England

IBM falls under the Vendor Products and Services category. For comparison with the information above, the following table provides summary statistics for all permanent job vacancies requiring knowledge or experience of all vendor products and services in England.

Permanent vacancies with a requirement for knowledge or experience of vendor products and services 19,243 31,915 36,167
As % of all permanent jobs advertised in England 39.30% 35.67% 41.87%
Number of salaries quoted 10,619 22,623 21,033
10th Percentile £27,336 £26,500 £31,000
25th Percentile £37,500 £35,750 £41,250
Median annual salary (50th Percentile) £55,000 £50,000 £57,500
Median % change year-on-year +10.00% -13.04% +4.55%
75th Percentile £70,600 £68,750 £75,000
90th Percentile £90,000 £87,500 £92,500
UK median annual salary £54,793 £50,000 £57,500
% change year-on-year +9.59% -13.04% +4.55%

IBM
Job Vacancy Trend in England

Job postings citing IBM as a proportion of all IT jobs advertised in England.
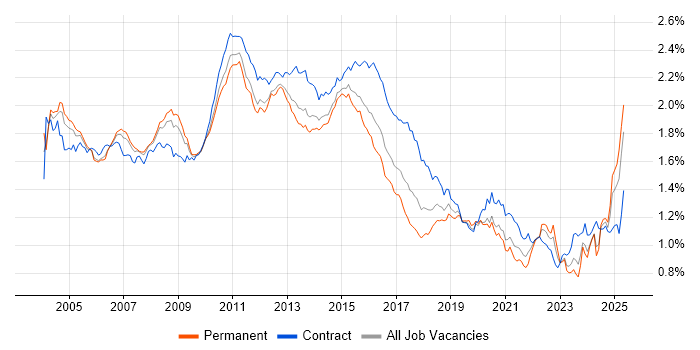
Job vacancy trend for IBM in England

IBM
Salary Trend in England

3-month moving average salary quoted in jobs citing IBM in England.

Salary trend for IBM in England

IBM
Salary Histogram in England

Salary distribution for jobs citing IBM in England over the 6 months to 30 May 2025.

Salary histogram for IBM in England

IBM
Job Locations in England

The table below looks at the demand and provides a guide to the median salaries quoted in IT jobs citing IBM within the England region over the 6 months to 30 May 2025. The 'Rank Change' column provides an indication of the change in demand within each location based on the same 6 month period last year.

Location Rank Change
on Same Period
Last Year
Matching
Permanent
IT Job Ads
Median Salary
Past 6 Months
Median Salary
% Change
on Same Period
Last Year
Live
Jobs
South East +155 577 £65,000 +23.81% 329
London +50 106 £76,250 +17.31% 115
South West +107 88 £40,101 -21.76% 148
North of England -89 69 £40,101 -37.10% 267
Midlands +16 60 £60,000 +33.33% 229
Yorkshire +61 50 £40,101 -38.31% 114
East Midlands 0 39 £40,101 -10.89% 96
East of England +22 24 £40,101 -23.62% 182
West Midlands +30 21 £67,500 +50.00% 117
North West -137 19 £40,101 -29.34% 126
IBM
UK

IBM
Co-occurring Skills and Capabilities in England by Category

The follow tables expand on the table above by listing co-occurrences grouped by category. The same employment type, locality and period is covered with up to 20 co-occurrences shown in each of the following categories:

Application Platforms
1 8 (0.86%) Confluence
2 6 (0.64%) CICS
3 4 (0.43%) IBM Domino
4 2 (0.21%) Apache
4 2 (0.21%) nginx
4 2 (0.21%) SAS
4 2 (0.21%) Tomcat
5 1 (0.11%) ArcGIS
5 1 (0.11%) IIS
5 1 (0.11%) Microsoft Exchange
5 1 (0.11%) NetWeaver
5 1 (0.11%) Oracle HTTP Server
5 1 (0.11%) Oracle SOA Suite
5 1 (0.11%) WebLogic
Applications
1 103 (11.03%) Simulink
2 7 (0.75%) Microsoft Office
3 5 (0.54%) Microsoft Excel
4 2 (0.21%) Chatbot
4 2 (0.21%) Microsoft PowerPoint
Business Applications
1 103 (11.03%) Teamcenter
2 35 (3.75%) Oracle SCM
3 10 (1.07%) IBM Planning Analytics
4 8 (0.86%) Oracle EBS
4 8 (0.86%) Postilion
4 8 (0.86%) SAP S/4HANA
5 6 (0.64%) Maximo
6 2 (0.21%) Infor SunSystems
7 1 (0.11%) Dynamics CRM
7 1 (0.11%) Oracle Subledger Accounting
Cloud Services
1 116 (12.42%) Azure
2 72 (7.71%) AWS
3 39 (4.18%) Azure DevOps
4 36 (3.85%) OCI
5 29 (3.10%) Power Platform
6 17 (1.82%) AWS Lambda
6 17 (1.82%) Serverless
7 16 (1.71%) GCP
7 16 (1.71%) SaaS
8 15 (1.61%) Amazon EC2
8 15 (1.61%) Amazon EKS
8 15 (1.61%) Amazon S3
9 14 (1.50%) Datadog
10 9 (0.96%) Collibra
10 9 (0.96%) Microsoft Purview
11 8 (0.86%) Microsoft 365
11 8 (0.86%) PaaS
12 7 (0.75%) GitHub
12 7 (0.75%) IBM Watson
13 6 (0.64%) Azure Cosmos DB
Communications & Networking
1 8 (0.86%) ATM
1 8 (0.86%) Firewall
1 8 (0.86%) SAN
2 6 (0.64%) Multicast
3 4 (0.43%) VPN
4 2 (0.21%) FTP
4 2 (0.21%) PuTTY
4 2 (0.21%) Reverse Proxy
4 2 (0.21%) TCP/IP
4 2 (0.21%) VSAN
5 1 (0.11%) GSM
5 1 (0.11%) HTTP
5 1 (0.11%) HTTPS
5 1 (0.11%) SSH
5 1 (0.11%) Unified Communications
5 1 (0.11%) WAN
Database & Business Intelligence
1 37 (3.96%) DB2
2 29 (3.10%) Power BI
3 27 (2.89%) NoSQL
4 24 (2.57%) SQL Server
5 19 (2.03%) MongoDB
6 16 (1.71%) PostgreSQL
7 14 (1.50%) Tableau
8 10 (1.07%) Metadata
9 9 (0.96%) IBM InfoSphere
10 7 (0.75%) Oracle ODI
10 7 (0.75%) QlikView
11 6 (0.64%) Relational Database
12 5 (0.54%) BusinessObjects
12 5 (0.54%) Data Warehouse
12 5 (0.54%) SAP HANA
13 4 (0.43%) Data Lake
13 4 (0.43%) OLAP
13 4 (0.43%) Oracle Reports
13 4 (0.43%) SQL Server Integration Services
13 4 (0.43%) SQL Server Reporting Services
Development Applications
1 554 (59.31%) Rational DOORS
2 61 (6.53%) JIRA
3 31 (3.32%) IntelliJ
4 30 (3.21%) Git
4 30 (3.21%) JUnit
5 29 (3.10%) Mockito
6 26 (2.78%) Jenkins
7 17 (1.82%) GitLab
8 16 (1.71%) Cucumber
9 15 (1.61%) Eclipse
9 15 (1.61%) Jasmine
9 15 (1.61%) Karma Test Runner
9 15 (1.61%) Protractor
10 14 (1.50%) Maven
11 5 (0.54%) TeamCity
12 4 (0.43%) IBM UrbanCode
12 4 (0.43%) NUnit
12 4 (0.43%) Octopus Deploy
12 4 (0.43%) SonarQube
12 4 (0.43%) Team Foundation Server
General
1 458 (49.04%) Electronics
2 219 (23.45%) Social Skills
3 105 (11.24%) Aerospace
4 103 (11.03%) Finance
5 99 (10.60%) Inclusion and Diversity
6 89 (9.53%) Public Sector
7 43 (4.60%) Banking
8 30 (3.21%) Law
9 23 (2.46%) Analytical Skills
10 20 (2.14%) Presentation Skills
11 16 (1.71%) Retail
12 11 (1.18%) Marketing
13 9 (0.96%) Manufacturing
14 8 (0.86%) Telecoms
15 5 (0.54%) Investment Banking
16 4 (0.43%) Legal
16 4 (0.43%) Pharmaceutical
17 3 (0.32%) Automotive
17 3 (0.32%) Influencing Skills
18 2 (0.21%) Aviation
Job Titles
1 454 (48.61%) Systems Engineer
2 240 (25.70%) Principal Engineer
3 238 (25.48%) Principal Systems Engineer
4 230 (24.63%) Senior
5 146 (15.63%) Senior Systems Engineer
6 103 (11.03%) Junior
6 103 (11.03%) Junior Systems Engineer
7 77 (8.24%) Architect
8 71 (7.60%) DevOps Engineer
9 70 (7.49%) Developer
10 58 (6.21%) Consultant
11 51 (5.46%) Oracle Consultant
12 48 (5.14%) Systems Architect
13 40 (4.28%) Lead
14 38 (4.07%) Azure Engineer
14 38 (4.07%) Senior DevOps
15 33 (3.53%) Radar Engineer
16 31 (3.32%) Java Developer
17 29 (3.10%) AWS DevOps
18 27 (2.89%) Azure DevOps Engineer
Libraries, Frameworks & Software Standards
1 39 (4.18%) React
2 38 (4.07%) AngularJS
3 21 (2.25%) JMS
4 18 (1.93%) Spring
4 18 (1.93%) Spring Boot
5 17 (1.82%) RabbitMQ
6 16 (1.71%) Hibernate
6 16 (1.71%) JPA
6 16 (1.71%) jQuery
7 14 (1.50%) ActiveMQ
8 13 (1.39%) .NET
9 12 (1.28%) Backbone.js
9 12 (1.28%) Bootstrap
9 12 (1.28%) Ember.js
9 12 (1.28%) IBM Integration Bus
9 12 (1.28%) JSON
10 11 (1.18%) Middleware
10 11 (1.18%) REST
10 11 (1.18%) SOAP
11 10 (1.07%) Web Services
Miscellaneous
1 376 (40.26%) Algorithms
2 156 (16.70%) Hybrid Cloud
3 96 (10.28%) e-Learning
4 74 (7.92%) Management Information System
5 24 (2.57%) Enterprise Software
6 21 (2.25%) Mainframe
7 20 (2.14%) Data Structures
8 14 (1.50%) Credit Derivative
9 12 (1.28%) Legacy Systems
10 11 (1.18%) IBM Mainframe
11 10 (1.07%) Product Ownership
12 9 (0.96%) Cloud Native
12 9 (0.96%) Virtual Team
13 8 (0.86%) Replication
13 8 (0.86%) Self-Motivation
14 7 (0.75%) Blockchain
14 7 (0.75%) Robotics
15 6 (0.64%) Data Centre
15 6 (0.64%) DataPower
16 5 (0.54%) Enterprise Storage
Operating Systems
1 59 (6.32%) Linux
2 29 (3.10%) Windows
3 24 (2.57%) zOS
4 18 (1.93%) Android
4 18 (1.93%) Apple iOS
5 7 (0.75%) Windows Server
6 6 (0.64%) Windows 10
6 6 (0.64%) Windows Server 2012
6 6 (0.64%) Windows Server 2016
6 6 (0.64%) Windows Server 2019
7 5 (0.54%) Red Hat Enterprise Linux
8 4 (0.43%) AIX
9 3 (0.32%) Unix
10 1 (0.11%) SUSE
10 1 (0.11%) Ubuntu
Processes & Methodologies
1 555 (59.42%) Systems Engineering
2 399 (42.72%) Technical Leadership
3 349 (37.37%) Signal Processing
4 264 (28.27%) Mentoring
5 203 (21.73%) Test Planning
6 161 (17.24%) Problem-Solving
7 155 (16.60%) Continuous Improvement
8 138 (14.78%) Agile
8 138 (14.78%) Model-Based Systems Engineering
9 127 (13.60%) Stakeholder Engagement
10 124 (13.28%) PLM
11 121 (12.96%) Artificial Intelligence
12 117 (12.53%) Project Management
13 112 (11.99%) DevOps
13 112 (11.99%) UML
14 106 (11.35%) Computer Science
15 104 (11.13%) Coaching
16 103 (11.03%) Creative Problem-Solving
16 103 (11.03%) Mathematics
16 103 (11.03%) Physics
Programming Languages
1 108 (11.56%) R
2 103 (11.03%) MATLAB
3 71 (7.60%) Java
4 61 (6.53%) SQL
5 24 (2.57%) Python
6 17 (1.82%) C++
7 12 (1.28%) C#
8 11 (1.18%) PL/SQL
9 9 (0.96%) JavaScript
10 8 (0.86%) JCL
11 7 (0.75%) TypeScript
12 6 (0.64%) COBOL
13 4 (0.43%) Bash
13 4 (0.43%) C
13 4 (0.43%) Groovy
14 3 (0.32%) REXX
15 2 (0.21%) Assembly Language
15 2 (0.21%) Kotlin
15 2 (0.21%) RPG IV
15 2 (0.21%) Shell Script
Qualifications
1 519 (55.57%) BPSS Clearance
2 185 (19.81%) Degree
3 101 (10.81%) Chartered Engineer
4 9 (0.96%) Security Cleared
5 6 (0.64%) SC Cleared
6 5 (0.54%) DV Cleared
7 4 (0.43%) ACCA
7 4 (0.43%) CIMA
7 4 (0.43%) Master's Degree
8 3 (0.32%) AWS Certification
8 3 (0.32%) AWS Certified Solutions Architect
8 3 (0.32%) Computer Science Degree
8 3 (0.32%) OCP
8 3 (0.32%) Oracle Certification
8 3 (0.32%) PhD
9 2 (0.21%) Azure Certification
10 1 (0.11%) CBAP
10 1 (0.11%) ISEB
10 1 (0.11%) ITIL Certification
Quality Assurance & Compliance
1 397 (42.51%) ISO/IEC 15288
2 12 (1.28%) Data Quality
3 10 (1.07%) Accessibility
3 10 (1.07%) GDPR
3 10 (1.07%) QA
4 9 (0.96%) ISO/IEC 27001
5 7 (0.75%) Sarbanes-Oxley
6 4 (0.43%) SOC 2
7 2 (0.21%) Cyber Essentials
7 2 (0.21%) SLA
8 1 (0.11%) ISO 15022
8 1 (0.11%) ISO 20022
8 1 (0.11%) NCSC
8 1 (0.11%) NIST
8 1 (0.11%) PCI DSS
System Software
1 20 (2.14%) Docker
2 8 (0.86%) Active Directory
3 7 (0.75%) Hyper-V
4 4 (0.43%) Time Sharing Option
5 3 (0.32%) PowerHA
6 2 (0.21%) Job Entry Subsystem
6 2 (0.21%) VMware Infrastructure
7 1 (0.11%) ACF2
7 1 (0.11%) NFS
7 1 (0.11%) RACF
7 1 (0.11%) VMware ESXi
Systems Management
1 28 (3.00%) Ansible
2 27 (2.89%) Terraform
3 5 (0.54%) Kubernetes
4 4 (0.43%) Graylog
4 4 (0.43%) Nagios
4 4 (0.43%) Opsgenie
5 3 (0.32%) Argo
5 3 (0.32%) Grafana
5 3 (0.32%) Istio
5 3 (0.32%) Nessus
5 3 (0.32%) Progress Chef
5 3 (0.32%) Prometheus
5 3 (0.32%) Tivoli Storage Manager
6 2 (0.21%) CA Endevor
6 2 (0.21%) NetBackup
6 2 (0.21%) QRadar
7 1 (0.11%) Backup Exec
7 1 (0.11%) McAfee ePO
7 1 (0.11%) Microsoft Intune
7 1 (0.11%) SCOM
Vendors
1 113 (12.10%) Red Hat
2 94 (10.06%) Oracle
3 56 (6.00%) Microsoft
4 35 (3.75%) SAP
5 19 (2.03%) Cisco
6 9 (0.96%) Databricks
6 9 (0.96%) Google
6 9 (0.96%) Informatica
6 9 (0.96%) Salesforce
7 7 (0.75%) Cognos
7 7 (0.75%) VMware
8 6 (0.64%) Apple
8 6 (0.64%) Dell
9 5 (0.54%) AppDynamics
9 5 (0.54%) HP
9 5 (0.54%) Splunk
10 4 (0.43%) Atlassian
10 4 (0.43%) Broadcom
10 4 (0.43%) Palo Alto
11 3 (0.32%) Hitachi