Inclusion and Diversity Job Trends in the South West

Inclusion and Diversity
England > South West

The table below looks at the prevalence of the term Inclusion and Diversity in permanent job vacancies in the South West. Included is a benchmarking guide to the salaries offered in vacancies that cited Inclusion and Diversity over the 6 months leading up to 18 September 2025, comparing them to the same period in the previous two years.

6 months to
18 Sep 2025
Same period 2024 Same period 2023
Rank 40 25 63
Rank change year-on-year -15 +38 -29
Permanent jobs citing Inclusion and Diversity 161 436 216
As % of all permanent jobs advertised in the South West 4.59% 5.79% 4.58%
As % of the General category 7.41% 12.39% 7.86%
Number of salaries quoted 66 55 60
10th Percentile £27,250 £25,000 £32,092
25th Percentile £27,707 £33,750 £35,733
Median annual salary (50th Percentile) £34,000 £42,500 £49,632
Median % change year-on-year -20.00% -14.37% +5.60%
75th Percentile £53,750 £62,200 £72,813
90th Percentile £63,623 £77,500 £85,977
England median annual salary £55,000 £60,493 £70,000
% change year-on-year -9.08% -13.58% +16.67%

All General Skills
South West

Inclusion and Diversity falls under the General Skills category. For comparison with the information above, the following table provides summary statistics for all permanent job vacancies requiring common skills in the South West.

Permanent vacancies with a requirement for common skills 2,173 3,520 2,747
As % of all permanent jobs advertised in the South West 61.96% 46.72% 58.25%
Number of salaries quoted 1,271 1,902 1,997
10th Percentile £26,500 £30,000 £28,750
25th Percentile £30,000 £37,500 £38,165
Median annual salary (50th Percentile) £43,000 £52,000 £52,500
Median % change year-on-year -17.31% -0.95% +9.38%
75th Percentile £58,750 £65,250 £70,000
90th Percentile £76,250 £81,125 £84,056
England median annual salary £55,000 £57,500 £60,000
% change year-on-year -4.35% -4.17% -

Inclusion and Diversity
Job Vacancy Trend in the South West

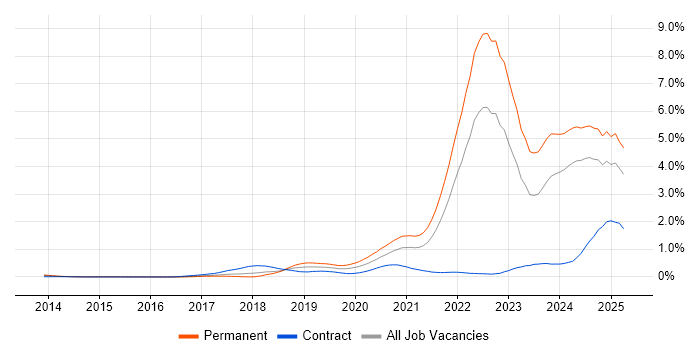
Job postings citing Inclusion and Diversity as a proportion of all IT jobs advertised in the South West.

Job vacancy trend for Inclusion and Diversity in the South West

Inclusion and Diversity
Salary Trend in the South West

Salary distribution trend for jobs in the South West citing Inclusion and Diversity.

Salary distribution trend for jobs in the South West citing Inclusion and Diversity

Inclusion and Diversity
Salary Histogram in the South West

Salary distribution for jobs citing Inclusion and Diversity in the South West over the 6 months to 18 September 2025.

Salary histogram for Inclusion and Diversity in the South West

Inclusion and Diversity
Job Locations in the South West

The table below looks at the demand and provides a guide to the median salaries quoted in IT jobs citing Inclusion and Diversity within the South West region over the 6 months to 18 September 2025. The 'Rank Change' column provides an indication of the change in demand within each location based on the same 6 month period last year.

Location Rank Change
on Same Period
Last Year
Matching
Permanent
IT Job Ads
Median Salary
Past 6 Months
Median Salary
% Change
on Same Period
Last Year
Live
Jobs
Dorset -3 67 £27,707 -47.22% 9
Gloucestershire +2 40 £37,500 - 45
Bristol +41 22 £29,500 -3.89% 39
Somerset +14 16 £37,026 - 14
Wiltshire +22 9 £55,000 -6.30% 9
Devon +4 6 £38,000 -37.62% 5
Cornwall - 1 £39,000 - 1
Inclusion and Diversity
England

Inclusion and Diversity
Co-occurring Skills and Capabilities in the South West by Category

The follow tables expand on the table above by listing co-occurrences grouped by category. The same employment type, locality and period is covered with up to 20 co-occurrences shown in each of the following categories:

Application Platforms
1 3 (1.86%) Confluence
2 1 (0.62%) Microsoft Exchange
Applications
1 8 (4.97%) Microsoft Office
2 4 (2.48%) Microsoft Excel
3 3 (1.86%) Microsoft PowerPoint
4 2 (1.24%) Adobe After Effects
4 2 (1.24%) Adobe Creative Suite
4 2 (1.24%) Adobe Premiere
4 2 (1.24%) Photoshop
5 1 (0.62%) AutoCAD
5 1 (0.62%) Revit
Business Applications
1 5 (3.11%) NetSuite
2 2 (1.24%) Integrated Workplace Management System
Cloud Services
1 32 (19.88%) AWS
2 12 (7.45%) Azure
2 12 (7.45%) Microsoft 365
3 6 (3.73%) Azure DevOps
4 5 (3.11%) Amazon EKS
5 4 (2.48%) Amazon Bedrock
5 4 (2.48%) Amazon ECS
5 4 (2.48%) Amazon S3
5 4 (2.48%) Amazon SageMaker
5 4 (2.48%) AWS Lambda
5 4 (2.48%) GCP
5 4 (2.48%) Google Analytics
5 4 (2.48%) Serverless
6 2 (1.24%) BlazeMeter
6 2 (1.24%) Dynamics 365
6 2 (1.24%) Power Platform
7 1 (0.62%) Google Workspace
7 1 (0.62%) Nutanix
7 1 (0.62%) Pulumi
7 1 (0.62%) SaaS
Communications & Networking
1 15 (9.32%) VPN
2 9 (5.59%) Wi-Fi
3 6 (3.73%) Firewall
4 5 (3.11%) ADSL
4 5 (3.11%) Cisco Firepower
4 5 (3.11%) Cisco Nexus
4 5 (3.11%) LoRaWAN
4 5 (3.11%) Modbus
4 5 (3.11%) MPLS
4 5 (3.11%) WAN
5 3 (1.86%) DNS
6 2 (1.24%) Internet
6 2 (1.24%) Wireless
7 1 (0.62%) Broadband
7 1 (0.62%) Cisco IOS
7 1 (0.62%) DHCP
7 1 (0.62%) Intranet
7 1 (0.62%) NAS
7 1 (0.62%) SAN
7 1 (0.62%) TCP/IP
Database & Business Intelligence
1 6 (3.73%) MySQL
1 6 (3.73%) Relational Database
2 5 (3.11%) Amazon Aurora
2 5 (3.11%) PostgreSQL
3 4 (2.48%) CockroachDB
4 3 (1.86%) Big Data
4 3 (1.86%) Oracle Database
4 3 (1.86%) SQL Server
5 2 (1.24%) Apache Cassandra
5 2 (1.24%) InterSystems Cache
5 2 (1.24%) NoSQL
5 2 (1.24%) Power BI
6 1 (0.62%) Data Lake
6 1 (0.62%) Data Warehouse
6 1 (0.62%) Elasticsearch
6 1 (0.62%) Qlik Sense
6 1 (0.62%) RDBMS
6 1 (0.62%) Redis
6 1 (0.62%) Snowflake Schema
6 1 (0.62%) Tableau
Development Applications
1 9 (5.59%) Jenkins
2 8 (4.97%) Selenium
3 6 (3.73%) JUnit
4 5 (3.11%) Sonatype Nexus
5 4 (2.48%) Cypress.io
5 4 (2.48%) Git
5 4 (2.48%) Locust
6 3 (1.86%) Maven
6 3 (1.86%) Mockito
7 2 (1.24%) JIRA
7 2 (1.24%) Postman
7 2 (1.24%) REST Assured
8 1 (0.62%) Cucumber
8 1 (0.62%) Jaeger
8 1 (0.62%) Robot Framework
General
1 56 (34.78%) Finance
2 45 (27.95%) Law
3 40 (24.84%) Marketing
4 35 (21.74%) Social Skills
5 22 (13.66%) Retail
6 21 (13.04%) Banking
7 17 (10.56%) Analytical Skills
8 8 (4.97%) Public Sector
9 5 (3.11%) Documentation Skills
9 5 (3.11%) Publishing
10 4 (2.48%) Back Office
11 3 (1.86%) Financial Institution
11 3 (1.86%) Games
11 3 (1.86%) Investment Banking
11 3 (1.86%) Manufacturing
12 2 (1.24%) Aviation
12 2 (1.24%) Influencing Skills
12 2 (1.24%) Military
12 2 (1.24%) Multimedia
12 2 (1.24%) Organisational Skills
Job Titles
1 33 (20.50%) Software Engineer
2 24 (14.91%) Senior
3 18 (11.18%) Account Manager
3 18 (11.18%) Lead
4 17 (10.56%) Senior Manager
5 16 (9.94%) Sales Manager
6 15 (9.32%) Python Engineer
6 15 (9.32%) Python Software Engineer
6 15 (9.32%) Sales Account Manager
6 15 (9.32%) Senior Account Manager
6 15 (9.32%) Senior Sales Manager
7 12 (7.45%) Java Engineer
7 12 (7.45%) Java Software Engineer
8 10 (6.21%) Administrator
8 10 (6.21%) Test Engineer
9 9 (5.59%) IT Support
10 8 (4.97%) IT Technician
10 8 (4.97%) Test Automation Engineer
11 7 (4.35%) IT Support Technician
11 7 (4.35%) Lead Software Engineer
Libraries, Frameworks & Software Standards
1 16 (9.94%) Spring
2 13 (8.07%) Kafka
2 13 (8.07%) React
3 11 (6.83%) Spring Boot
4 10 (6.21%) REST
5 7 (4.35%) CSS
5 7 (4.35%) HTML
6 6 (3.73%) AngularJS
6 6 (3.73%) Playwright
7 5 (3.11%) Node.js
8 4 (2.48%) pytest
8 4 (2.48%) RESTful
9 3 (1.86%) Hibernate
9 3 (1.86%) Java EE
9 3 (1.86%) JMS
10 2 (1.24%) Elastic Stack
10 2 (1.24%) HTML5
10 2 (1.24%) Middleware
11 1 (0.62%) gRPC
11 1 (0.62%) Lambda Expressions
Miscellaneous
1 16 (9.94%) Onboarding
2 14 (8.70%) Public Cloud
3 13 (8.07%) Algorithms
4 11 (6.83%) Podcast
5 9 (5.59%) e-Learning
6 8 (4.97%) Cloud Native
7 6 (3.73%) Data Structures
8 5 (3.11%) Cyberattack
8 5 (3.11%) Hybrid Cloud
8 5 (3.11%) Operational Technology
8 5 (3.11%) Self-Motivation
9 4 (2.48%) Product Ownership
9 4 (2.48%) Reference Data
9 4 (2.48%) Renewable Energy
10 3 (1.86%) Driving Licence
10 3 (1.86%) SCADA
10 3 (1.86%) Social Media
11 2 (1.24%) Data Centre
11 2 (1.24%) Video Conferencing
11 2 (1.24%) Video Editing
Operating Systems
1 13 (8.07%) Linux
2 9 (5.59%) Windows
3 8 (4.97%) Android
4 5 (3.11%) Windows Server
5 4 (2.48%) Apple iOS
6 1 (0.62%) Unix
6 1 (0.62%) Windows 10
Processes & Methodologies
1 50 (31.06%) Agile
2 42 (26.09%) Artificial Intelligence
3 37 (22.98%) Software Engineering
4 33 (20.50%) CI/CD
4 33 (20.50%) Machine Learning
5 29 (18.01%) SDLC
6 26 (16.15%) Operational Stability
6 26 (16.15%) Problem-Solving
7 24 (14.91%) Customer Service
8 23 (14.29%) B2B
9 22 (13.66%) Mentoring
10 21 (13.04%) Continuous Improvement
11 20 (12.42%) Community of Practice
12 19 (11.80%) Visualisation
13 16 (9.94%) Decision-Making
14 12 (7.45%) Analytics
14 12 (7.45%) DevOps
14 12 (7.45%) Roadmaps
15 11 (6.83%) Project Management
15 11 (6.83%) Test Automation
Programming Languages
1 35 (21.74%) Java
2 31 (19.25%) Python
3 21 (13.04%) JavaScript
4 12 (7.45%) SQL
5 6 (3.73%) Bash
5 6 (3.73%) PowerShell
6 5 (3.11%) Go
7 4 (2.48%) C++
8 2 (1.24%) C#
8 2 (1.24%) Rust
8 2 (1.24%) TypeScript
Qualifications
1 13 (8.07%) Degree
2 12 (7.45%) Security Cleared
3 9 (5.59%) DV Cleared
4 7 (4.35%) AWS Certification
5 5 (3.11%) CCDA
5 5 (3.11%) CCDP
5 5 (3.11%) CCNA
5 5 (3.11%) CCNP
5 5 (3.11%) Cisco Certification
5 5 (3.11%) DBS Check
6 3 (1.86%) SC Cleared
7 2 (1.24%) AWS Certified Developer
7 2 (1.24%) BPSS Clearance
7 2 (1.24%) CITP
7 2 (1.24%) Master's Degree
8 1 (0.62%) Azure Certification
8 1 (0.62%) HNC
8 1 (0.62%) HND
8 1 (0.62%) NVQ Level 3
8 1 (0.62%) VMware Certified Professional (VCP)
Quality Assurance & Compliance
1 4 (2.48%) Cyber Essentials
1 4 (2.48%) QA
2 2 (1.24%) Cyber Essentials PLUS
2 2 (1.24%) NIST
3 1 (0.62%) ISO 19650
3 1 (0.62%) PCI DSS
System Software
1 24 (14.91%) Docker
2 4 (2.48%) Active Directory
2 4 (2.48%) VMware Infrastructure
3 3 (1.86%) VMware ESXi
4 2 (1.24%) vSphere
5 1 (0.62%) Hyper-V
5 1 (0.62%) Virtual Machines
5 1 (0.62%) VMware NSX
Systems Management
1 21 (13.04%) Kubernetes
2 14 (8.70%) Ansible
3 10 (6.21%) Terraform
4 5 (3.11%) CASB
4 5 (3.11%) Systems Management Server (SMS)
5 4 (2.48%) Microsoft Intune
6 1 (0.62%) Argo
6 1 (0.62%) Kustomize
6 1 (0.62%) Prometheus
6 1 (0.62%) vCenter Server
Vendors
1 18 (11.18%) Microsoft
2 12 (7.45%) Cisco
3 10 (6.21%) Oracle
4 8 (4.97%) Juniper
5 7 (4.35%) Databricks
5 7 (4.35%) Fortinet
5 7 (4.35%) Google
5 7 (4.35%) Meraki
5 7 (4.35%) Palo Alto
6 6 (3.73%) ServiceNow
6 6 (3.73%) VMware
7 5 (3.11%) Aerohive Networks
7 5 (3.11%) Ekahau
7 5 (3.11%) Extreme Networks
7 5 (3.11%) SolarWinds
8 4 (2.48%) Dell
8 4 (2.48%) IBM
8 4 (2.48%) Red Hat
9 3 (1.86%) Salesforce
9 3 (1.86%) Sybase