Banking Jobs in the South West

Banking
England > South West

The table below looks at the prevalence of the term Banking in permanent job vacancies advertised in the South West. Included is a benchmarking guide to the salaries offered in vacancies that have cited Banking over the 6 months to 30 November 2023 with a comparison to the same period over the previous 2 years.

6 months to
30 Nov 2023
Same period 2022 Same period 2021
Rank 33 82 216
Rank change year-on-year +49 +134 -19
Permanent jobs citing Banking 357 305 77
As % of all permanent jobs advertised in the South West 7.53% 3.77% 1.05%
As % of the General category 13.52% 5.69% 1.82%
Number of salaries quoted 300 232 49
10th Percentile £44,192 £33,000 £30,125
25th Percentile £57,988 £47,930 £50,250
Median annual salary (50th Percentile) £70,576 £61,180 £54,500
Median % change year-on-year +15.36% +12.26% -27.33%
75th Percentile £91,934 £77,715 £81,250
90th Percentile £96,539 £90,773 £86,000
England median annual salary £76,000 £75,000 £77,500
% change year-on-year +1.33% -3.23% -

All General Skills
South West

Banking is in the General Skills category. The following table is for comparison with the above and provides summary statistics for all permanent job vacancies advertised in the South West with a requirement for common skills.

Permanent vacancies with a requirement for common skills 2,640 5,360 4,226
As % of all permanent jobs advertised in the South West 55.67% 66.21% 57.80%
Number of salaries quoted 1,797 2,874 2,573
10th Percentile £30,000 £27,250 £27,500
25th Percentile £39,745 £35,000 £36,750
Median annual salary (50th Percentile) £52,500 £50,000 £47,500
Median % change year-on-year +5.00% +5.26% +5.56%
75th Percentile £70,000 £64,191 £63,750
90th Percentile £85,000 £77,659 £76,250
England median annual salary £60,000 £60,000 £60,000
% change year-on-year - - +4.35%

Banking
Job Vacancy Trend in the South West

Job postings citing Banking as a proportion of all IT jobs advertised in the South West.
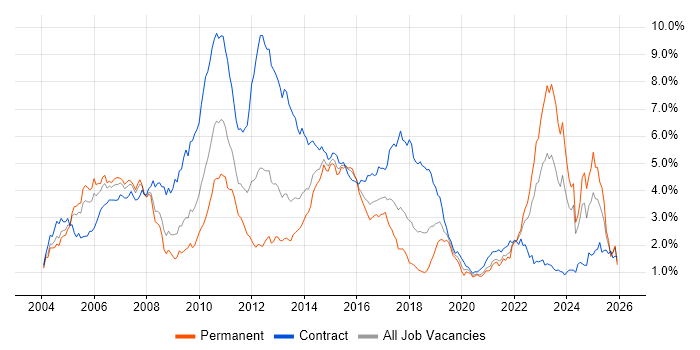
Job vacancy trend for Banking in the South West

Banking
Salary Trend in the South West

3-month moving average salary quoted in jobs citing Banking in the South West.

Salary trend for Banking in the South West

Banking
Salary Histogram in the South West

Salary distribution for jobs citing Banking in the South West over the 6 months to 30 November 2023.

Salary histogram for Banking in the South West

Banking
Job Locations in the South West

The table below looks at the demand and provides a guide to the median salaries quoted in IT jobs citing Banking within the South West region over the 6 months to 30 November 2023. The 'Rank Change' column provides an indication of the change in demand within each location based on the same 6 month period last year.

Location Rank Change
on Same Period
Last Year
Matching
Permanent
IT Job Ads
Median Salary
Past 6 Months
Median Salary
% Change
on Same Period
Last Year
Live
Jobs
Bristol +21 328 £70,576 +14.13% 15
Gloucestershire +37 15 £59,556 -4.46%
Wiltshire +9 5 £67,500 -10.00% 12
Somerset +39 4 £46,791 -20.36% 2
Dorset +32 1 £40,000 -46.67%
Devon +8 1 - - 1
Banking
England

Banking
Co-occurring Skills and Capabilities in the South West by Category

The follow tables expand on the table above by listing co-occurrences grouped by category. The same employment type, locality and period is covered with up to 20 co-occurrences shown in each of the following categories:

Application Platforms
1 24 (6.72%) Apache Spark
2 17 (4.76%) Apache
3 16 (4.48%) Confluence
4 8 (2.24%) SAS
5 4 (1.12%) Jupyter
5 4 (1.12%) Tomcat
6 3 (0.84%) Captiva
6 3 (0.84%) FileNet
6 3 (0.84%) Jetty
6 3 (0.84%) WebSphere
7 1 (0.28%) Adobe Experience Manager
Applications
1 14 (3.92%) Microsoft Excel
2 11 (3.08%) Microsoft Office
3 2 (0.56%) Microsoft PowerPoint
3 2 (0.56%) Microsoft Project
Business Applications
1 10 (2.80%) Cloudability
2 2 (0.56%) SAP FI-GL
Cloud Services
1 136 (38.10%) GCP
2 85 (23.81%) Azure
3 48 (13.45%) AWS
4 46 (12.89%) Power Platform
5 42 (11.76%) GitHub
6 35 (9.80%) PaaS
7 31 (8.68%) SaaS
8 22 (6.16%) IaaS
9 21 (5.88%) GitHub Actions
10 19 (5.32%) Vertex AI
11 18 (5.04%) Azure DevOps
12 5 (1.40%) Apigee
12 5 (1.40%) Cloud Computing
13 3 (0.84%) AWS Direct Connect
13 3 (0.84%) Azure AKS
13 3 (0.84%) Azure Cosmos DB
13 3 (0.84%) Cloud Composer
14 2 (0.56%) Azure Sentinel
14 2 (0.56%) Collibra
14 2 (0.56%) Google Kubernetes Engine
Communications & Networking
1 8 (2.24%) Firewall
2 7 (1.96%) Internet
3 4 (1.12%) F5 BIG-IP GTM
3 4 (1.12%) F5 BIG-IP LTM
3 4 (1.12%) VPN
4 2 (0.56%) Network Security
4 2 (0.56%) SMS
5 1 (0.28%) Cisco Nexus
5 1 (0.28%) VLAN
Database & Business Intelligence
1 54 (15.13%) Data Warehouse
2 50 (14.01%) NoSQL
3 46 (12.89%) Power BI
4 39 (10.92%) Data Lake
5 37 (10.36%) Big Data
6 34 (9.52%) SQL Server
7 31 (8.68%) BigQuery
8 29 (8.12%) Tableau
9 25 (7.00%) Relational Database
10 24 (6.72%) SQL Server Integration Services
11 21 (5.88%) Hadoop
11 21 (5.88%) SQL Server Reporting Services
12 18 (5.04%) MySQL
12 18 (5.04%) PostgreSQL
13 16 (4.48%) Oracle Database
14 15 (4.20%) Bigtable
14 15 (4.20%) Looker
15 13 (3.64%) Data Mart
16 10 (2.80%) Data Hub
16 10 (2.80%) Metadata
Development Applications
1 61 (17.09%) Jenkins
2 46 (12.89%) Git
3 36 (10.08%) Oracle Forms
4 25 (7.00%) JIRA
5 15 (4.20%) Maven
5 15 (4.20%) Sonatype Nexus
6 13 (3.64%) Spinnaker
7 8 (2.24%) Cucumber
7 8 (2.24%) ERwin
7 8 (2.24%) IBM UrbanCode
8 7 (1.96%) Selenium
9 6 (1.68%) SonarQube
10 3 (0.84%) Cypress.io
10 3 (0.84%) JUnit
General
1 350 (98.04%) Finance
2 103 (28.85%) Retail
3 97 (27.17%) Social Skills
4 44 (12.32%) Analytical Skills
5 35 (9.80%) Influencing Skills
6 23 (6.44%) Marketing
7 19 (5.32%) Presentation Skills
8 16 (4.48%) Retail Banking
9 13 (3.64%) Games
10 10 (2.80%) Inclusion and Diversity
10 10 (2.80%) Retail Finance
11 4 (1.12%) Advertising
11 4 (1.12%) Corporate Banking
11 4 (1.12%) Organisational Skills
11 4 (1.12%) Telecoms
12 3 (0.84%) Documentation Skills
12 3 (0.84%) Legal
12 3 (0.84%) Manufacturing
13 2 (0.56%) General Ledger
13 2 (0.56%) Pharmaceutical
Job Titles
1 85 (23.81%) Architect
2 49 (13.73%) Lead
3 41 (11.48%) Software Engineer
4 39 (10.92%) Analyst
4 39 (10.92%) Senior
5 29 (8.12%) Enterprise Architect
5 29 (8.12%) Solutions Architect
6 27 (7.56%) Data Engineer
7 24 (6.72%) Cloud Engineer
8 20 (5.60%) DevOps Engineer
9 18 (5.04%) Senior Analyst
10 17 (4.76%) Data Manager
10 17 (4.76%) Security Architect
11 16 (4.48%) Data Analyst
12 15 (4.20%) GCP Engineer
13 14 (3.92%) Developer
14 13 (3.64%) Cloud Security Engineer
14 13 (3.64%) Security Engineer
15 12 (3.36%) Commercial Architect
16 10 (2.80%) GCP Data Engineer
Libraries, Frameworks & Software Standards
1 40 (11.20%) Kafka
2 21 (5.88%) OpenID
3 20 (5.60%) RESTful
4 19 (5.32%) React
4 19 (5.32%) Spring
4 19 (5.32%) Spring Boot
5 15 (4.20%) Hibernate
6 14 (3.92%) HTML
6 14 (3.92%) Node.js
6 14 (3.92%) REST
7 13 (3.64%) JSON
8 12 (3.36%) .NET
9 11 (3.08%) AngularJS
9 11 (3.08%) Web Services
10 9 (2.52%) CSS
10 9 (2.52%) Express.js
11 7 (1.96%) Apache Beam
11 7 (1.96%) Flutter
11 7 (1.96%) Middleware
11 7 (1.96%) Quarkus
Miscellaneous
1 71 (19.89%) Public Cloud
2 51 (14.29%) Product Ownership
3 31 (8.68%) Cloud Native
4 21 (5.88%) Blockchain
4 21 (5.88%) Mainframe
5 20 (5.60%) Data Structures
6 14 (3.92%) Virtual Team
7 13 (3.64%) Private Cloud
8 9 (2.52%) Algorithms
8 9 (2.52%) Data Centre
8 9 (2.52%) Distributed Applications
8 9 (2.52%) Distributed Systems
8 9 (2.52%) Legacy Systems
9 8 (2.24%) Credit Risk
9 8 (2.24%) Data Fabric
9 8 (2.24%) Onboarding
9 8 (2.24%) Reference Data
10 7 (1.96%) Legacy Applications
10 7 (1.96%) Online Banking
10 7 (1.96%) Robotics
Operating Systems
1 37 (10.36%) Unix
2 23 (6.44%) Linux
3 13 (3.64%) AIX
3 13 (3.64%) Android
4 12 (3.36%) Apple iOS
5 10 (2.80%) Windows
6 5 (1.40%) Windows Server
7 3 (0.84%) HPUX
7 3 (0.84%) Red Hat Enterprise Linux
7 3 (0.84%) Solaris
8 1 (0.28%) CoreOS
8 1 (0.28%) zOS
Processes & Methodologies
1 331 (92.72%) Agile
2 131 (36.69%) Analytics
3 91 (25.49%) Software Engineering
4 86 (24.09%) DevOps
5 79 (22.13%) Machine Learning
6 69 (19.33%) Problem-Solving
7 68 (19.05%) CI/CD
8 62 (17.37%) Microservices
9 61 (17.09%) Roadmaps
10 57 (15.97%) Business Intelligence
11 56 (15.69%) Cybersecurity
12 53 (14.85%) Mentoring
13 51 (14.29%) Coaching
14 49 (13.73%) Cloud Security
15 47 (13.17%) Artificial Intelligence
15 47 (13.17%) Infrastructure as Code
16 44 (12.32%) Visualisation
17 43 (12.04%) Data Analytics
18 38 (10.64%) Risk Management
19 37 (10.36%) Test Automation
Programming Languages
1 97 (27.17%) SQL
2 75 (21.01%) Python
3 73 (20.45%) Java
4 36 (10.08%) JavaScript
5 20 (5.60%) Go
6 19 (5.32%) PowerShell
7 18 (5.04%) Scala
8 17 (4.76%) Bash
9 15 (4.20%) TypeScript
10 14 (3.92%) C#
11 13 (3.64%) Groovy
11 13 (3.64%) PL/SQL
12 8 (2.24%) R
12 8 (2.24%) T-SQL
13 7 (1.96%) Kotlin
13 7 (1.96%) Rust
14 4 (1.12%) Data Analysis Expressions
14 4 (1.12%) XMLA
15 2 (0.56%) Bicep
15 2 (0.56%) Swift
Qualifications
1 14 (3.92%) Security Cleared
2 7 (1.96%) AWS Certification
3 5 (1.40%) OCP
3 5 (1.40%) Oracle Certification
4 4 (1.12%) Azure Certification
4 4 (1.12%) CISMP
4 4 (1.12%) Degree
5 2 (0.56%) PMI Certification
5 2 (0.56%) TOGAF Certification
6 1 (0.28%) Tableau Certification
Quality Assurance & Compliance
1 13 (3.64%) Data Quality
2 9 (2.52%) SLA
3 8 (2.24%) Actionable Recommendations
3 8 (2.24%) GRC
4 7 (1.96%) Accessibility
4 7 (1.96%) GDPR
5 4 (1.12%) QA
6 2 (0.56%) Basel III
6 2 (0.56%) NIST
System Software
1 46 (12.89%) Docker
2 15 (4.20%) Virtual Machines
3 2 (0.56%) Apache Flume
Systems Management
1 72 (20.17%) Kubernetes
2 50 (14.01%) Terraform
3 12 (3.36%) Istio
4 6 (1.68%) Ansible
5 2 (0.56%) Argo
5 2 (0.56%) Progress Chef
5 2 (0.56%) Puppet
6 1 (0.28%) CA Endevor
Vendors
1 81 (22.69%) Google
2 40 (11.20%) Oracle
3 23 (6.44%) Teradata
4 22 (6.16%) Microsoft
5 15 (4.20%) IBM
6 9 (2.52%) ServiceNow
7 5 (1.40%) Apple
7 5 (1.40%) Cisco
7 5 (1.40%) SAP
8 4 (1.12%) BMC
8 4 (1.12%) CheckPoint
8 4 (1.12%) F5
8 4 (1.12%) Fortinet
8 4 (1.12%) Splunk
9 3 (0.84%) Dataiku
9 3 (0.84%) HP
9 3 (0.84%) Kofax
9 3 (0.84%) Pega
9 3 (0.84%) Sun
9 3 (0.84%) Unisys