Computer Science Jobs in the South West

Computer Science
England > South West

The following table provides summary statistics for permanent job vacancies advertised in the South West with a requirement for Computer Science skills. Included is a benchmarking guide to the salaries offered in vacancies that have cited Computer Science over the 6 months to 29 April 2024 with a comparison to the same period in the previous 2 years.

6 months to
29 Apr 2024
Same period 2023 Same period 2022
Rank 66 90 79
Rank change year-on-year +24 -11 -4
Permanent jobs citing Computer Science 343 241 325
As % of all permanent jobs advertised in the South West 3.73% 3.49% 4.08%
As % of the Processes & Methodologies category 4.44% 3.70% 4.29%
Number of salaries quoted 232 185 186
10th Percentile £31,000 £29,550 £26,500
25th Percentile £37,500 £36,625 £37,500
Median annual salary (50th Percentile) £51,000 £52,500 £50,000
Median % change year-on-year -2.86% +5.00% +5.26%
75th Percentile £72,500 £70,000 £62,500
90th Percentile £87,500 £82,500 £75,000
England median annual salary £60,000 £65,000 £60,000
% change year-on-year -7.69% +8.33% -

All Process and Methodology Skills
South West

Computer Science is in the Processes and Methodologies category. The following table is for comparison with the above and provides summary statistics for all permanent job vacancies advertised in the South West with a requirement for process or methodology skills.

Permanent vacancies with a requirement for process or methodology skills 7,732 6,516 7,580
As % of all permanent jobs advertised in the South West 84.15% 94.43% 95.11%
Number of salaries quoted 5,553 3,657 4,985
10th Percentile £28,500 £30,500 £30,932
25th Percentile £37,500 £39,200 £38,353
Median annual salary (50th Percentile) £50,500 £52,500 £50,000
Median % change year-on-year -3.81% +5.00% +7.42%
75th Percentile £65,000 £68,750 £65,000
90th Percentile £80,000 £81,250 £77,500
England median annual salary £55,000 £62,500 £60,000
% change year-on-year -12.00% +4.17% +9.09%

Computer Science
Job Vacancy Trend in the South West

Job postings citing Computer Science as a proportion of all IT jobs advertised in the South West.
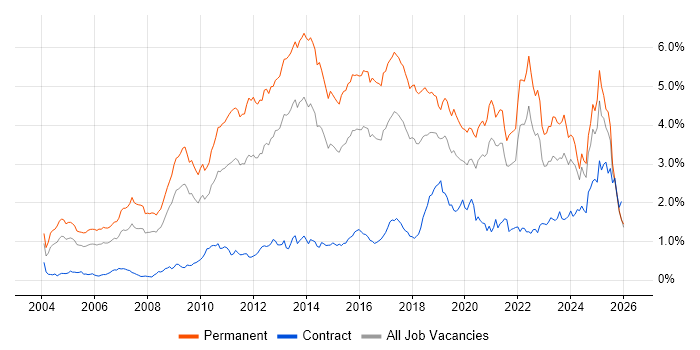
Job vacancy trend for Computer Science in the South West

Computer Science
Salary Trend in the South West

3-month moving average salary quoted in jobs citing Computer Science in the South West.

Salary trend for Computer Science in the South West

Computer Science
Salary Histogram in the South West

Salary distribution for jobs citing Computer Science in the South West over the 6 months to 29 April 2024.

Salary histogram for Computer Science in the South West

Computer Science
Job Locations in the South West

The table below looks at the demand and provides a guide to the median salaries quoted in IT jobs citing Computer Science within the South West region over the 6 months to 29 April 2024. The 'Rank Change' column provides an indication of the change in demand within each location based on the same 6 month period last year.

Location Rank Change
on Same Period
Last Year
Matching
Permanent
IT Job Ads
Median Salary
Past 6 Months
Median Salary
% Change
on Same Period
Last Year
Live
Jobs
Bristol +37 152 £59,500 -8.46% 49
Devon +9 69 £35,000 -9.09% 17
Gloucestershire +7 48 £55,000 - 7
Wiltshire -25 26 £43,000 -14.00% 10
Dorset -4 25 £47,500 +15.65% 11
Somerset +11 14 £29,500 -34.58% 9
Cornwall -13 4 - - 1
Computer Science
England

Computer Science
Co-occurring Skills and Capabilities in the South West by Category

The follow tables expand on the table above by listing co-occurrences grouped by category. The same employment type, locality and period is covered with up to 20 co-occurrences shown in each of the following categories:

Application Platforms
1 10 (2.92%) Apache Spark
2 5 (1.46%) Confluence
3 4 (1.17%) Moodle
4 3 (0.87%) Microsoft Exchange
4 3 (0.87%) Tomcat
4 3 (0.87%) WildFly
5 2 (0.58%) Apache
5 2 (0.58%) Oracle Workflow
Applications
1 24 (7.00%) Microsoft Office
2 1 (0.29%) Microsoft Excel
Cloud Services
1 52 (15.16%) AWS
2 45 (13.12%) Azure
3 17 (4.96%) GCP
4 16 (4.66%) SaaS
5 15 (4.37%) Azure DevOps
5 15 (4.37%) npm
6 13 (3.79%) GitHub
7 11 (3.21%) Microsoft 365
8 10 (2.92%) Firebase
9 9 (2.62%) Power Platform
10 7 (2.04%) Azure Functions
10 7 (2.04%) Serverless
11 3 (0.87%) PaaS
12 2 (0.58%) dbt
13 1 (0.29%) Azure Data Factory
13 1 (0.29%) IaaS
13 1 (0.29%) Power Automate
13 1 (0.29%) PowerApps
Communications & Networking
1 27 (7.87%) Network Security
2 26 (7.58%) WAN
3 21 (6.12%) SD-WAN
4 18 (5.25%) Firewall
5 17 (4.96%) 5G
6 12 (3.50%) DNS
6 12 (3.50%) Wi-Fi
7 10 (2.92%) TCP/IP
8 9 (2.62%) HTTP
8 9 (2.62%) Internet
9 8 (2.33%) LAN
10 7 (2.04%) SMTP
11 6 (1.75%) Ethernet
11 6 (1.75%) RS-232
12 4 (1.17%) SAN
13 3 (0.87%) MPLS
13 3 (0.87%) PABX
13 3 (0.87%) VLAN
13 3 (0.87%) VSAT
13 3 (0.87%) ZigBee
Database & Business Intelligence
1 24 (7.00%) SQL Server
2 17 (4.96%) Relational Database
3 14 (4.08%) Data Warehouse
4 11 (3.21%) MySQL
5 10 (2.92%) Big Data
6 9 (2.62%) Hadoop
6 9 (2.62%) Power BI
7 8 (2.33%) PostgreSQL
8 7 (2.04%) NoSQL
9 6 (1.75%) BigQuery
9 6 (1.75%) Data Lake
9 6 (1.75%) Flink
10 5 (1.46%) OLTP
10 5 (1.46%) SQL Server Integration Services
11 4 (1.17%) Redis
12 3 (0.87%) Data Mining
13 2 (0.58%) Elasticsearch
13 2 (0.58%) MongoDB
13 2 (0.58%) RDBMS
13 2 (0.58%) Tableau
Development Applications
1 45 (13.12%) Git
2 20 (5.83%) Jenkins
3 15 (4.37%) Visual Studio
4 13 (3.79%) JIRA
4 13 (3.79%) Storybook
5 5 (1.46%) Oracle Forms
5 5 (1.46%) Selenium
6 4 (1.17%) Maven
7 3 (0.87%) GitLab
8 2 (0.58%) Bitbucket
8 2 (0.58%) Burp Suite
8 2 (0.58%) Cucumber
8 2 (0.58%) JUnit
8 2 (0.58%) Metasploit
8 2 (0.58%) Rational DOORS
8 2 (0.58%) SonarQube
9 1 (0.29%) Subversion
9 1 (0.29%) WebDriver
General
1 134 (39.07%) Social Skills
2 92 (26.82%) Analytical Skills
3 50 (14.58%) Finance
4 34 (9.91%) Electronics
5 31 (9.04%) Marketing
6 23 (6.71%) Presentation Skills
7 21 (6.12%) Inclusion and Diversity
8 20 (5.83%) Military
9 18 (5.25%) Financial Institution
10 17 (4.96%) Manufacturing
11 16 (4.66%) Law
12 14 (4.08%) Aerospace
12 14 (4.08%) Aviation
13 13 (3.79%) Telecoms
14 12 (3.50%) Organisational Skills
15 11 (3.21%) Influencing Skills
16 9 (2.62%) Games
16 9 (2.62%) Legal
17 7 (2.04%) Public Sector
18 6 (1.75%) Documentation Skills
Job Titles
1 78 (22.74%) Developer
1 78 (22.74%) Senior
2 43 (12.54%) Software Engineer
3 33 (9.62%) Lead
4 28 (8.16%) Senior Software Engineer
5 26 (7.58%) Systems Engineer
6 21 (6.12%) Software Developer
7 17 (4.96%) Architect
8 16 (4.66%) Senior Developer
8 16 (4.66%) Support Engineer
9 14 (4.08%) Linux Engineer
10 13 (3.79%) Analyst
10 13 (3.79%) Linux Systems Engineer
10 13 (3.79%) Penetration Tester
10 13 (3.79%) Tester
11 12 (3.50%) Administrator
11 12 (3.50%) Data Engineer
12 11 (3.21%) Senior Manager
12 11 (3.21%) Technical Leader
13 10 (2.92%) Applications Developer
Libraries, Frameworks & Software Standards
1 49 (14.29%) AngularJS
2 33 (9.62%) React
3 30 (8.75%) .NET
4 29 (8.45%) CSS
5 27 (7.87%) HTML
6 24 (7.00%) Node.js
7 20 (5.83%) REST
8 13 (3.79%) .NET Framework
8 13 (3.79%) Sass
9 11 (3.21%) ASP.NET
10 10 (2.92%) HTML5
10 10 (2.92%) Ionic Framework
11 9 (2.62%) ASP.NET Core
11 9 (2.62%) Kafka
11 9 (2.62%) Vue
12 8 (2.33%) Lambda Expressions
12 8 (2.33%) Twitter Bootstrap
13 7 (2.04%) ASP.NET Web API
13 7 (2.04%) Entity Framework
13 7 (2.04%) Unity (Game Engine)
Miscellaneous
1 41 (11.95%) Self-Motivation
2 23 (6.71%) GNSS
3 22 (6.41%) Management Information System
4 16 (4.66%) Algorithms
4 16 (4.66%) Cloud Native
4 16 (4.66%) Mobile App
5 14 (4.08%) Product Ownership
6 11 (3.21%) Onboarding
7 10 (2.92%) Analogue Electronics
7 10 (2.92%) FPGA
7 10 (2.92%) Public Cloud
7 10 (2.92%) Robotics
8 8 (2.33%) Client/Server
8 8 (2.33%) Replication
9 7 (2.04%) Analytical Mindset
9 7 (2.04%) CUDA
9 7 (2.04%) Embedded Systems
9 7 (2.04%) Oculus
9 7 (2.04%) Tandem
9 7 (2.04%) VHDL
Operating Systems
1 76 (22.16%) Linux
2 53 (15.45%) Windows
3 22 (6.41%) Unix
4 13 (3.79%) Android
4 13 (3.79%) Apple iOS
5 10 (2.92%) Mac OS
6 8 (2.33%) Debian
6 8 (2.33%) Ubuntu
7 4 (1.17%) Windows 10
8 3 (0.87%) Red Hat Enterprise Linux
8 3 (0.87%) Windows 7
8 3 (0.87%) Windows Server 2008
8 3 (0.87%) Windows Server 2016
9 2 (0.58%) Kali Linux
10 1 (0.29%) Windows Server
10 1 (0.29%) Windows Server 2012
10 1 (0.29%) Windows Server 2019
Processes & Methodologies
1 146 (42.57%) Problem-Solving
2 83 (24.20%) Software Engineering
3 64 (18.66%) Agile
4 55 (16.03%) Project Management
5 53 (15.45%) Test Automation
6 45 (13.12%) B2B
7 44 (12.83%) Mentoring
8 43 (12.54%) CI/CD
9 42 (12.24%) Containerisation
10 41 (11.95%) Validation
11 40 (11.66%) Cybersecurity
12 38 (11.08%) DevOps
13 37 (10.79%) Defect Tracking
14 35 (10.20%) Continuous Integration
14 35 (10.20%) Requirements Analysis
15 33 (9.62%) Machine Learning
15 33 (9.62%) Project Delivery
16 31 (9.04%) Unit Testing
17 30 (8.75%) Mathematics
18 29 (8.45%) Roadmaps
Programming Languages
1 74 (21.57%) SQL
2 69 (20.12%) Python
3 68 (19.83%) JavaScript
4 50 (14.58%) Java
5 47 (13.70%) TypeScript
6 37 (10.79%) C#
7 35 (10.20%) C
7 35 (10.20%) C++
8 19 (5.54%) Bash
9 17 (4.96%) Perl
10 14 (4.08%) Scala
11 10 (2.92%) MATLAB
11 10 (2.92%) Objective-C
11 10 (2.92%) Swift
12 9 (2.62%) VB
13 7 (2.04%) PHP
13 7 (2.04%) Tcl
14 5 (1.46%) Go
14 5 (1.46%) R
15 4 (1.17%) PowerShell
Qualifications
1 304 (88.63%) Degree
2 140 (40.82%) Computer Science Degree
3 54 (15.74%) Security Cleared
4 30 (8.75%) Master's Degree
5 25 (7.29%) SC Cleared
6 12 (3.50%) DBS Check
6 12 (3.50%) DV Cleared
7 10 (2.92%) A+ Certification
7 10 (2.92%) MCP
7 10 (2.92%) Microsoft Certification
7 10 (2.92%) PMP
8 9 (2.62%) CHECK Team Member
8 9 (2.62%) OSCP
9 8 (2.33%) Cisco Certification
9 8 (2.33%) CISSP
10 6 (1.75%) CISM
10 6 (1.75%) PMI Certification
11 5 (1.46%) Chartered Engineer
11 5 (1.46%) Network+ Certification
11 5 (1.46%) RHCE
Quality Assurance & Compliance
1 27 (7.87%) PMO
2 21 (6.12%) QA
3 11 (3.21%) ISO/IEC 27001
4 9 (2.62%) NIST
5 8 (2.33%) Cyber Essentials
6 7 (2.04%) DO-254
6 7 (2.04%) IEC 61508
6 7 (2.04%) SOC 2
7 6 (1.75%) GDPR
8 5 (1.46%) ISO/IEC 12207
8 5 (1.46%) ISO/IEC 15288
8 5 (1.46%) SLA
8 5 (1.46%) SOC 1
9 3 (0.87%) Accessibility
9 3 (0.87%) Data Quality
9 3 (0.87%) JTAG
10 1 (0.29%) Actionable Recommendations
10 1 (0.29%) Government Security Classifications
10 1 (0.29%) HMG Security Policy Framework
10 1 (0.29%) ISO 9001
System Software
1 24 (7.00%) Docker
2 18 (5.25%) Firmware
3 16 (4.66%) Active Directory
4 15 (4.37%) Embedded Firmware
4 15 (4.37%) VMware Infrastructure
5 7 (2.04%) Virtual Machines
6 3 (0.87%) Hyper-V
6 3 (0.87%) KVM
6 3 (0.87%) XenApp
Systems Management
1 18 (5.25%) Kubernetes
2 6 (1.75%) Nagios
3 5 (1.46%) Rancher
3 5 (1.46%) Terraform
4 3 (0.87%) EMC VPLEX
4 3 (0.87%) OfficeScan
4 3 (0.87%) WSUS
5 2 (0.58%) Nmap
6 1 (0.29%) Ansible
6 1 (0.29%) Oracle Enterprise Manager
6 1 (0.29%) SCCM
Vendors
1 53 (15.45%) Microsoft
2 22 (6.41%) Oracle
3 15 (4.37%) Cisco
3 15 (4.37%) VMware
4 9 (2.62%) IBM
5 7 (2.04%) Altera
5 7 (2.04%) Green Hills
5 7 (2.04%) Motorola
5 7 (2.04%) Xilinx
6 6 (1.75%) Centreon
6 6 (1.75%) Google
6 6 (1.75%) Salesforce
6 6 (1.75%) Teradata
7 4 (1.17%) Fortinet
8 3 (0.87%) Alcatel-Lucent
8 3 (0.87%) Atlassian
8 3 (0.87%) CheckPoint
8 3 (0.87%) Red Hat
8 3 (0.87%) Sybase
8 3 (0.87%) Veeam