JavaScript Jobs in the Thames Valley

JavaScript (including ECMAScript)
South East > Thames Valley

The table below provides summary statistics for permanent job vacancies advertised in the Thames Valley requiring JavaScript skills. It includes a benchmarking guide to the annual salaries offered in vacancies that cited JavaScript over the 6 months leading up to 17 September 2024, comparing them to the same period in the previous two years.

6 months to
17 Sep 2024
Same period 2023 Same period 2022
Rank 19 17 15
Rank change year-on-year -2 -2 -9
Permanent jobs citing JavaScript 379 441 833
As % of all permanent jobs advertised in the Thames Valley 7.68% 10.96% 11.56%
As % of the Programming Languages category 27.77% 25.55% 27.54%
Number of salaries quoted 248 353 502
10th Percentile £38,750 £45,090 £37,500
25th Percentile £50,938 £52,500 £46,063
Median annual salary (50th Percentile) £69,375 £65,000 £60,000
Median % change year-on-year +6.73% +8.33% +9.09%
75th Percentile £82,500 £80,000 £72,500
90th Percentile £95,000 £100,000 £80,000
South East median annual salary £55,000 £60,000 £55,000
% change year-on-year -8.33% +9.09% +10.00%

All Programming Languages
Thames Valley

JavaScript falls under the Programming Languages category. For comparison with the information above, the following table provides summary statistics for all permanent job vacancies requiring coding skills in the Thames Valley.

Permanent vacancies with a requirement for coding skills 1,365 1,726 3,025
As % of all permanent jobs advertised in the Thames Valley 27.68% 42.89% 41.96%
Number of salaries quoted 847 1,133 1,748
10th Percentile £37,500 £36,500 £36,953
25th Percentile £45,000 £47,500 £45,500
Median annual salary (50th Percentile) £57,500 £60,000 £60,000
Median % change year-on-year -4.17% - +9.09%
75th Percentile £74,500 £77,500 £75,000
90th Percentile £85,000 £92,000 £82,500
South East median annual salary £55,000 £57,500 £55,000
% change year-on-year -4.35% +4.55% +5.77%

JavaScript
Job Vacancy Trend in the Thames Valley

Job postings citing JavaScript as a proportion of all IT jobs advertised in the Thames Valley.
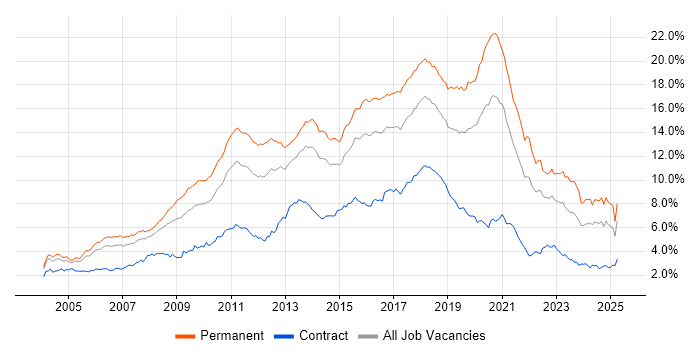
Job vacancy trend for JavaScript in the Thames Valley

JavaScript
Salary Trend in the Thames Valley

3-month moving average salary quoted in jobs citing JavaScript in the Thames Valley.

Salary trend for JavaScript in the Thames Valley

JavaScript
Salary Histogram in the Thames Valley

Salary distribution for jobs citing JavaScript in the Thames Valley over the 6 months to 17 September 2024.

Salary histogram for JavaScript in the Thames Valley

JavaScript
Job Locations in the Thames Valley

The table below looks at the demand and provides a guide to the median salaries quoted in IT jobs citing JavaScript within the Thames Valley region over the 6 months to 17 September 2024. The 'Rank Change' column provides an indication of the change in demand within each location based on the same 6 month period last year.

Location Rank Change
on Same Period
Last Year
Matching
Permanent
IT Job Ads
Median Salary
Past 6 Months
Median Salary
% Change
on Same Period
Last Year
Live
Jobs
Berkshire +2 232 £77,500 +10.71% 37
Buckinghamshire -4 83 £52,500 -19.23% 17
Oxfordshire -25 64 £63,250 +5.42% 23
JavaScript
South East

JavaScript
Co-occurring Skills and Capabilities in the Thames Valley by Category

The follow tables expand on the table above by listing co-occurrences grouped by category. The same employment type, locality and period is covered with up to 20 co-occurrences shown in each of the following categories:

Application Platforms
1 13 (3.43%) Apache
1 13 (3.43%) Tomcat
2 8 (2.11%) OpenStack
3 5 (1.32%) ArcGIS
3 5 (1.32%) GeoServer
3 5 (1.32%) IIS
3 5 (1.32%) JBoss
4 4 (1.06%) CMS
4 4 (1.06%) Red Hat Fuse
4 4 (1.06%) Sitecore CMS
5 3 (0.79%) Headless CMS
5 3 (0.79%) Kentico
5 3 (0.79%) Mendix
5 3 (0.79%) SharePoint
5 3 (0.79%) Umbraco
6 2 (0.53%) Confluence
7 1 (0.26%) WildFly
7 1 (0.26%) WordPress
Applications
1 18 (4.75%) Microsoft Excel
2 10 (2.64%) Microsoft Office
3 6 (1.58%) Acrobat
3 6 (1.58%) Fireworks
3 6 (1.58%) MS Visio
3 6 (1.58%) Photoshop
3 6 (1.58%) RoboHelp
4 4 (1.06%) Sketch
Business Applications
1 5 (1.32%) Dynamics CRM
2 2 (0.53%) Sage 200
Cloud Services
1 129 (34.04%) Azure
2 74 (19.53%) AWS
3 39 (10.29%) Azure DevOps
4 34 (8.97%) GitHub
5 30 (7.92%) Serverless
6 27 (7.12%) SaaS
7 23 (6.07%) Azure Cosmos DB
8 13 (3.43%) Azure Service Bus
9 12 (3.17%) SonarCloud
10 11 (2.90%) Amazon ECS
10 11 (2.90%) Amazon EKS
11 10 (2.64%) Power Platform
12 7 (1.85%) GCP
13 5 (1.32%) Amazon EC2
13 5 (1.32%) Amazon S3
13 5 (1.32%) Power Automate
13 5 (1.32%) Salesforce Sales Cloud
14 4 (1.06%) Azure Functions
14 4 (1.06%) Figma
14 4 (1.06%) PowerApps
Communications & Networking
1 4 (1.06%) HTTP
2 3 (0.79%) VoIP
2 3 (0.79%) Wireless
3 2 (0.53%) DNS
3 2 (0.53%) Firewall
3 2 (0.53%) Internet
3 2 (0.53%) VPN
Database & Business Intelligence
1 85 (22.43%) SQL Server
2 65 (17.15%) NoSQL
3 26 (6.86%) MySQL
4 25 (6.60%) PostgreSQL
5 23 (6.07%) Relational Database
6 20 (5.28%) Elasticsearch
7 10 (2.64%) GIS
8 6 (1.58%) Azure SQL Database
8 6 (1.58%) Power BI
9 5 (1.32%) DynamoDB
9 5 (1.32%) MongoDB
9 5 (1.32%) QGIS
10 3 (0.79%) RDBMS
10 3 (0.79%) SQL Server Reporting Services
11 2 (0.53%) Data Warehouse
11 2 (0.53%) Geospatial Data
11 2 (0.53%) MariaDB
11 2 (0.53%) Redis
12 1 (0.26%) Apache Cassandra
12 1 (0.26%) Big Data
Development Applications
1 120 (31.66%) Git
2 52 (13.72%) Cypress.io
2 52 (13.72%) Selenium
3 27 (7.12%) JIRA
4 22 (5.80%) SoapUI
5 21 (5.54%) Jenkins
6 18 (4.75%) Visual Studio
7 14 (3.69%) Octopus Deploy
8 13 (3.43%) Team Foundation Server
9 12 (3.17%) MSBuild
10 9 (2.37%) Bitbucket
10 9 (2.37%) GitLab
10 9 (2.37%) Vite
11 8 (2.11%) gulp
11 8 (2.11%) JUnit
11 8 (2.11%) PostCSS
11 8 (2.11%) rollup.js
12 4 (1.06%) JMeter
12 4 (1.06%) Mockito
12 4 (1.06%) Subversion
General
1 50 (13.19%) Social Skills
2 25 (6.60%) Analytical Skills
3 19 (5.01%) Retail
4 16 (4.22%) Multimedia
5 14 (3.69%) Finance
5 14 (3.69%) Public Sector
6 12 (3.17%) Marketing
7 10 (2.64%) Games
7 10 (2.64%) Telecoms
8 8 (2.11%) Organisational Skills
9 7 (1.85%) Automotive
10 6 (1.58%) Dutch Language
10 6 (1.58%) German Language
10 6 (1.58%) Japanese Language
11 5 (1.32%) Manufacturing
12 4 (1.06%) Influencing Skills
12 4 (1.06%) Publishing
13 3 (0.79%) Aerospace
13 3 (0.79%) Digital Health
13 3 (0.79%) Financial Institution
Job Titles
1 230 (60.69%) Developer
2 99 (26.12%) Senior
3 81 (21.37%) Senior Developer
4 62 (16.36%) Software Developer
5 42 (11.08%) Lead
6 39 (10.29%) .NET Developer
7 38 (10.03%) Software Engineer
8 35 (9.23%) Front-End Developer (Client-Side Developer)
9 28 (7.39%) Full-Stack Developer
10 27 (7.12%) Team Leader
11 26 (6.86%) Senior Front-End Developer
12 25 (6.60%) Web Developer
13 24 (6.33%) C# Developer
14 22 (5.80%) C# .NET Developer
15 20 (5.28%) Trainee Developer
16 19 (5.01%) Development Team Leader
16 19 (5.01%) Software Development Team Leader
16 19 (5.01%) Software Team Leader
17 17 (4.49%) Senior .NET Developer
17 17 (4.49%) Senior Software Developer
Libraries, Frameworks & Software Standards
1 178 (46.97%) .NET
2 168 (44.33%) React
3 155 (40.90%) HTML
4 148 (39.05%) CSS
5 77 (20.32%) HTML5
6 57 (15.04%) CSS3
7 54 (14.25%) .NET Core
8 52 (13.72%) ASP.NET
9 49 (12.93%) Jest
10 46 (12.14%) AngularJS
11 39 (10.29%) Web Services
12 36 (9.50%) XML
13 30 (7.92%) REST
14 28 (7.39%) JSON
15 26 (6.86%) RESTful
16 24 (6.33%) Node.js
17 22 (5.80%) Twitter Bootstrap
18 19 (5.01%) Spring
19 18 (4.75%) .NET Framework
20 17 (4.49%) ASP.NET Web API
Miscellaneous
1 16 (4.22%) Product Ownership
2 13 (3.43%) Algorithms
2 13 (3.43%) Distributed Systems
2 13 (3.43%) NHS
3 8 (2.11%) Animation
3 8 (2.11%) IoT
4 7 (1.85%) Enterprise Software
5 5 (1.32%) Analytical Mindset
5 5 (1.32%) Distributed Architecture
6 4 (1.06%) Mobile App
6 4 (1.06%) Self-Motivation
7 3 (0.79%) Low-Code
7 3 (0.79%) Private Cloud
7 3 (0.79%) Smartphone
7 3 (0.79%) Virtual Team
8 2 (0.53%) Client/Server
8 2 (0.53%) Cloud Native
8 2 (0.53%) Enterprise Cloud
9 1 (0.26%) Greenfield Project
9 1 (0.26%) Management Information System
Operating Systems
1 26 (6.86%) Linux
2 19 (5.01%) Windows
3 4 (1.06%) Android
3 4 (1.06%) Apple iOS
4 1 (0.26%) CentOS
4 1 (0.26%) Debian
4 1 (0.26%) Red Hat Enterprise Linux
4 1 (0.26%) Ubuntu
Processes & Methodologies
1 202 (53.30%) Agile
2 104 (27.44%) Artificial Intelligence
3 102 (26.91%) Software Engineering
4 93 (24.54%) Computer Science
5 90 (23.75%) Full-Stack Development
6 77 (20.32%) Problem-Solving
6 77 (20.32%) Propensity Modelling
7 64 (16.89%) DevOps
8 54 (14.25%) Front End Development
9 50 (13.19%) Microservices
9 50 (13.19%) Web Development
10 40 (10.55%) CI/CD
11 39 (10.29%) TDD
12 38 (10.03%) Scrum
13 36 (9.50%) MVC
14 33 (8.71%) Machine Learning
15 29 (7.65%) Design Patterns
15 29 (7.65%) User Experience
16 25 (6.60%) Code Quality
17 24 (6.33%) SDLC
Programming Languages
1 209 (55.15%) C#
2 152 (40.11%) TypeScript
3 112 (29.55%) SQL
4 70 (18.47%) Java
4 70 (18.47%) Python
5 54 (14.25%) PHP
6 15 (3.96%) Bash
7 10 (2.64%) Go
8 9 (2.37%) C++
9 7 (1.85%) Bicep
9 7 (1.85%) T-SQL
10 6 (1.58%) PowerShell
11 5 (1.32%) C
12 4 (1.06%) Objective-C
12 4 (1.06%) Shell Script
13 3 (0.79%) Kotlin
14 2 (0.53%) Ruby
14 2 (0.53%) VBScript
15 1 (0.26%) Apex Code
15 1 (0.26%) Perl
Qualifications
1 138 (36.41%) Degree
2 43 (11.35%) Computer Science Degree
3 21 (5.54%) Security Cleared
4 14 (3.69%) SC Cleared
5 13 (3.43%) Master's Degree
6 10 (2.64%) Numerate Degree
6 10 (2.64%) PhD
7 2 (0.53%) Azure Certification
7 2 (0.53%) DV Cleared
8 1 (0.26%) AWS Certification
8 1 (0.26%) BPSS Clearance
8 1 (0.26%) CTC Cleared
8 1 (0.26%) ISEB
8 1 (0.26%) ISTQB
8 1 (0.26%) ITIL Certification
Quality Assurance & Compliance
1 24 (6.33%) WCAG
2 15 (3.96%) GDPR
2 15 (3.96%) QA
3 4 (1.06%) Accessibility
4 3 (0.79%) HL7
5 1 (0.26%) ISO/IEC 15288
5 1 (0.26%) SLA
System Software
1 115 (30.34%) Docker
2 2 (0.53%) Virtual Desktop
3 1 (0.26%) Active Directory
3 1 (0.26%) Firmware
3 1 (0.26%) Hyper-V
Systems Management
1 113 (29.82%) Kubernetes
2 11 (2.90%) Terraform
3 10 (2.64%) Ansible
4 3 (0.79%) Kibana
5 2 (0.53%) Grafana
5 2 (0.53%) HP Quality Center
5 2 (0.53%) Prometheus
6 1 (0.26%) Kustomize
Vendors
1 54 (14.25%) Microsoft
2 13 (3.43%) Adobe
3 11 (2.90%) Salesforce
4 7 (1.85%) Oracle
5 5 (1.32%) ESRI
5 5 (1.32%) Rollbar
5 5 (1.32%) WSO2
5 5 (1.32%) Xamarin
6 4 (1.06%) Red Hat
6 4 (1.06%) Sitecore
7 3 (0.79%) Citrix
7 3 (0.79%) Dynatrace
7 3 (0.79%) Optimizely
7 3 (0.79%) SAP
7 3 (0.79%) Splunk
8 2 (0.53%) F5
8 2 (0.53%) HP
8 2 (0.53%) MuleSoft
8 2 (0.53%) Sage
8 2 (0.53%) ServiceNow