Telecoms Jobs in the Thames Valley

Telecommunications
South East > Thames Valley

The table below looks at the prevalence of the term Telecoms in permanent job vacancies in the Thames Valley. Included is a benchmarking guide to the salaries offered in vacancies that cited Telecoms over the 6 months leading up to 20 September 2024, comparing them to the same period in the previous two years.

6 months to
20 Sep 2024
Same period 2023 Same period 2022
Rank 60 34 60
Rank change year-on-year -26 +26 -17
Permanent jobs citing Telecoms 186 269 337
As % of all permanent jobs advertised in the Thames Valley 3.76% 6.68% 4.66%
As % of the General category 7.52% 10.59% 7.47%
Number of salaries quoted 37 77 101
10th Percentile £28,250 £30,150 £31,000
25th Percentile £34,000 £36,500 £51,250
Median annual salary (50th Percentile) £60,500 £55,000 £65,000
Median % change year-on-year +10.00% -15.38% +18.18%
75th Percentile £85,000 £72,500 £77,500
90th Percentile £112,500 £80,500 £85,000
South East median annual salary £47,500 £43,500 £56,750
% change year-on-year +9.20% -23.35% +8.10%

All General Skills
Thames Valley

Telecoms falls under the General Skills category. For comparison with the information above, the following table provides summary statistics for all permanent job vacancies requiring common skills in the Thames Valley.

Permanent vacancies with a requirement for common skills 2,472 2,540 4,509
As % of all permanent jobs advertised in the Thames Valley 49.96% 63.11% 62.40%
Number of salaries quoted 948 1,424 2,115
10th Percentile £29,750 £31,000 £29,000
25th Percentile £36,250 £40,000 £40,000
Median annual salary (50th Percentile) £50,000 £52,500 £55,000
Median % change year-on-year -4.76% -4.55% +5.77%
75th Percentile £65,000 £67,500 £70,000
90th Percentile £81,250 £80,000 £80,000
South East median annual salary £51,500 £52,500 £55,000
% change year-on-year -1.90% -4.55% +10.00%

Telecoms
Job Vacancy Trend in the Thames Valley

Job postings citing Telecoms as a proportion of all IT jobs advertised in the Thames Valley.
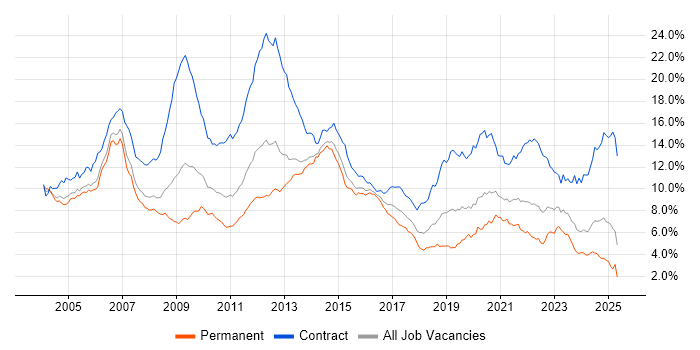
Job vacancy trend for Telecoms in the Thames Valley

Telecoms
Salary Trend in the Thames Valley

3-month moving average salary quoted in jobs citing Telecoms in the Thames Valley.

Salary trend for Telecoms in the Thames Valley

Telecoms
Salary Histogram in the Thames Valley

Salary distribution for jobs citing Telecoms in the Thames Valley over the 6 months to 20 September 2024.

Salary histogram for Telecoms in the Thames Valley

Telecoms
Job Locations in the Thames Valley

The table below looks at the demand and provides a guide to the median salaries quoted in IT jobs citing Telecoms within the Thames Valley region over the 6 months to 20 September 2024. The 'Rank Change' column provides an indication of the change in demand within each location based on the same 6 month period last year.

Location Rank Change
on Same Period
Last Year
Matching
Permanent
IT Job Ads
Median Salary
Past 6 Months
Median Salary
% Change
on Same Period
Last Year
Live
Jobs
Berkshire -1 168 £61,500 -8.89% 43
Buckinghamshire -49 10 £33,750 -38.64% 13
Oxfordshire -26 8 £60,000 +46.34% 2
Telecoms
South East

Telecoms
Co-occurring Skills and Capabilities in the Thames Valley by Category

The follow tables expand on the table above by listing co-occurrences grouped by category. The same employment type, locality and period is covered with up to 20 co-occurrences shown in each of the following categories:

Application Platforms
1 7 (3.76%) SharePoint
2 1 (0.54%) Microsoft Exchange
Applications
1 22 (11.83%) Microsoft Office
2 20 (10.75%) Microsoft Excel
3 9 (4.84%) Microsoft PowerPoint
4 3 (1.61%) MS Visio
5 1 (0.54%) AutoCAD
Business Applications
1 11 (5.91%) Dynamics CRM
Cloud Services
1 22 (11.83%) Azure
2 18 (9.68%) PaaS
3 17 (9.14%) IaaS
4 10 (5.38%) Power Platform
5 8 (4.30%) AWS
6 6 (3.23%) PowerApps
7 5 (2.69%) GCP
8 4 (2.15%) Azure Synapse Analytics
8 4 (2.15%) Power Automate
8 4 (2.15%) Serverless
9 2 (1.08%) Amazon S3
9 2 (1.08%) Azure Cosmos DB
9 2 (1.08%) Azure DevOps
9 2 (1.08%) Azure Functions
9 2 (1.08%) Azure Key Vault
9 2 (1.08%) GitHub
10 1 (0.54%) AWS CloudFormation
10 1 (0.54%) Cloud Computing
10 1 (0.54%) Microsoft 365
10 1 (0.54%) SaaS
Communications & Networking
1 6 (3.23%) MPLS
1 6 (3.23%) Wi-Fi
2 5 (2.69%) Radio Access Network
2 5 (2.69%) VoIP
2 5 (2.69%) Wireless
3 4 (2.15%) 5G
3 4 (2.15%) Firewall
3 4 (2.15%) HTTP
3 4 (2.15%) SNMP
4 3 (1.61%) Network Security
4 3 (1.61%) SD-WAN
4 3 (1.61%) WAN
5 2 (1.08%) DNS
5 2 (1.08%) Internet
5 2 (1.08%) LAN
5 2 (1.08%) Microwave Backhaul
5 2 (1.08%) Mobile Backhaul
5 2 (1.08%) Structured Cabling
5 2 (1.08%) VPN
6 1 (0.54%) IPv6
Database & Business Intelligence
1 14 (7.53%) SQL Server
2 10 (5.38%) Power BI
3 6 (3.23%) Data Warehouse
4 5 (2.69%) SQL Server Integration Services
5 4 (2.15%) Data Lake
5 4 (2.15%) NoSQL
5 4 (2.15%) Power Query
6 3 (1.61%) MySQL
7 2 (1.08%) Azure SQL Database
7 2 (1.08%) DynamoDB
7 2 (1.08%) GIS
8 1 (0.54%) Azure SQL Data Warehouse
8 1 (0.54%) SQL Server Reporting Services
Development Applications
1 4 (2.15%) JIRA
2 2 (1.08%) Bitbucket
2 2 (1.08%) Git
2 2 (1.08%) GitLab
3 1 (0.54%) Cypress.io
3 1 (0.54%) Selenium
3 1 (0.54%) SQL Server Management Studio (SSMS)
3 1 (0.54%) WebDriver
General
1 49 (26.34%) Social Skills
2 29 (15.59%) Finance
3 25 (13.44%) Legal
4 15 (8.06%) Inclusion and Diversity
5 13 (6.99%) Law
6 11 (5.91%) Analytical Skills
7 10 (5.38%) Presentation Skills
8 7 (3.76%) Marketing
9 6 (3.23%) Back Office
9 6 (3.23%) Billing
10 5 (2.69%) Banking
10 5 (2.69%) Local Government
10 5 (2.69%) Organisational Skills
10 5 (2.69%) Retail
11 4 (2.15%) Publishing
12 2 (1.08%) Public Sector
13 1 (0.54%) Electronics
13 1 (0.54%) Manufacturing
Job Titles
1 16 (8.60%) Telecoms Manager
2 14 (7.53%) Build Manager
2 14 (7.53%) Developer
3 13 (6.99%) Contracts Manager
4 12 (6.45%) Governance Manager
5 11 (5.91%) Senior
5 11 (5.91%) Software Engineer
6 10 (5.38%) Architect
7 9 (4.84%) Commercial Manager
7 9 (4.84%) Telecoms Engineer
8 8 (4.30%) Telecoms Specialist
9 7 (3.76%) Analyst
9 7 (3.76%) Commercial Contracts Manager
9 7 (3.76%) Database Developer
10 6 (3.23%) Compliance Manager
10 6 (3.23%) Junior
10 6 (3.23%) Portfolio Manager
10 6 (3.23%) Risk Manager
11 5 (2.69%) Cloud Engineer
11 5 (2.69%) Operations Director
Libraries, Frameworks & Software Standards
1 4 (2.15%) Flask
1 4 (2.15%) NETCONF
1 4 (2.15%) Node.js
1 4 (2.15%) React
2 3 (1.61%) Ajax
2 3 (1.61%) Dojo
2 3 (1.61%) FHIR
2 3 (1.61%) REST
2 3 (1.61%) SOAP
2 3 (1.61%) XML
2 3 (1.61%) XMPP
3 2 (1.08%) Lambda Expressions
4 1 (0.54%) jQuery
4 1 (0.54%) Playwright
4 1 (0.54%) Web Services
Miscellaneous
1 14 (7.53%) Self-Motivation
2 9 (4.84%) Driving Licence
3 7 (3.76%) Lidar
4 6 (3.23%) Enterprise Software
4 6 (3.23%) Handset
4 6 (3.23%) Onboarding
5 5 (2.69%) Management Information System
6 4 (2.15%) Cyber Threat
6 4 (2.15%) Tandem
7 3 (1.61%) Data Centre
7 3 (1.61%) Fibre Optics
7 3 (1.61%) IoT
7 3 (1.61%) PACS
7 3 (1.61%) Smartphone
8 2 (1.08%) CCTV
8 2 (1.08%) CMDB
8 2 (1.08%) Virtual Team
9 1 (0.54%) Blackberry
9 1 (0.54%) Frameworx
9 1 (0.54%) Video Conferencing
Operating Systems
1 11 (5.91%) Linux
2 3 (1.61%) Android
2 3 (1.61%) Apple iOS
3 2 (1.08%) Windows
4 1 (0.54%) Kali Linux
4 1 (0.54%) Windows 10
4 1 (0.54%) Windows 7
4 1 (0.54%) Windows 8
4 1 (0.54%) Windows Server
4 1 (0.54%) Windows Server 2012
4 1 (0.54%) Windows Server 2016
4 1 (0.54%) Windows Server 2019
Processes & Methodologies
1 54 (29.03%) Continuous Improvement
2 27 (14.52%) Problem-Solving
3 26 (13.98%) Business Continuity
4 25 (13.44%) Decision-Making
5 21 (11.29%) Contract Management
6 20 (10.75%) CRM
6 20 (10.75%) Information Security
7 19 (10.22%) Project Management
7 19 (10.22%) Regulatory Compliance
7 19 (10.22%) Validation
8 18 (9.68%) Risk Management
9 16 (8.60%) Project Delivery
9 16 (8.60%) Stakeholder Management
10 14 (7.53%) Business Strategy
10 14 (7.53%) Contract Negotiation
10 14 (7.53%) DevOps
11 13 (6.99%) Software Engineering
12 12 (6.45%) Data Management
12 12 (6.45%) Supplier Management
13 11 (5.91%) Change Management
Programming Languages
1 16 (8.60%) SQL
2 11 (5.91%) Python
3 9 (4.84%) JavaScript
4 8 (4.30%) Java
5 7 (3.76%) PowerShell
6 6 (3.23%) T-SQL
7 4 (2.15%) C++
7 4 (2.15%) Go
7 4 (2.15%) Kotlin
7 4 (2.15%) TypeScript
8 1 (0.54%) C#
8 1 (0.54%) VBScript
Qualifications
1 15 (8.06%) Degree
2 5 (2.69%) Security Cleared
3 3 (1.61%) Master's Degree
4 2 (1.08%) HND
5 1 (0.54%) APMP
5 1 (0.54%) AWS Certification
5 1 (0.54%) Azure Certification
5 1 (0.54%) CCNP
5 1 (0.54%) Cisco Certification
5 1 (0.54%) CISSP
5 1 (0.54%) Computer Science Degree
5 1 (0.54%) DV Cleared
5 1 (0.54%) HNC
5 1 (0.54%) ISACA
5 1 (0.54%) PMI Certification
5 1 (0.54%) PMP
5 1 (0.54%) VMware Certified Professional (VCP)
Quality Assurance & Compliance
1 24 (12.90%) SLA
2 9 (4.84%) GDPR
3 8 (4.30%) Data Quality
4 6 (3.23%) GRC
5 4 (2.15%) HIPAA
5 4 (2.15%) QA
6 3 (1.61%) HL7
6 3 (1.61%) ISO/IEC 27001
7 2 (1.08%) ISO 14001
7 2 (1.08%) ISO 22301
7 2 (1.08%) ISO 9001
7 2 (1.08%) NEBOSH
7 2 (1.08%) NIST
8 1 (0.54%) COBIT
8 1 (0.54%) ISO/IEC 27002 (supersedes ISO/IEC 17799)
8 1 (0.54%) PCI DSS
System Software
1 7 (3.76%) Docker
2 1 (0.54%) Active Directory
2 1 (0.54%) Hyper-V
2 1 (0.54%) VMware Infrastructure
Systems Management
1 4 (2.15%) Kubernetes
2 2 (1.08%) Grafana
2 2 (1.08%) Prometheus
3 1 (0.54%) Suricata
3 1 (0.54%) Terraform
Vendors
1 25 (13.44%) Microsoft
2 12 (6.45%) BT
3 10 (5.38%) Remedy
4 9 (4.84%) Openreach
5 7 (3.76%) Cisco
6 4 (2.15%) Databricks
7 3 (1.61%) Arqiva
7 3 (1.61%) Salesforce
7 3 (1.61%) SAP
7 3 (1.61%) Virgin Media
8 2 (1.08%) Juniper
8 2 (1.08%) Palo Alto
8 2 (1.08%) ServiceNow
9 1 (0.54%) ConnectWise
9 1 (0.54%) Ericsson
9 1 (0.54%) F5
9 1 (0.54%) HubSpot
9 1 (0.54%) Nokia
9 1 (0.54%) Splunk
9 1 (0.54%) VMware