Linux Jobs in the Thames Valley

Linux
South East > Thames Valley

The table below provides summary statistics for permanent job vacancies advertised in the Thames Valley requiring Linux skills. It includes a benchmarking guide to the annual salaries offered in vacancies that cited Linux over the 6 months leading up to 6 July 2025, comparing them to the same period in the previous two years.

6 months to
6 Jul 2025
Same period 2024 Same period 2023
Rank 67 34 17
Rank change year-on-year -33 -17 -5
Permanent jobs citing Linux 152 409 569
As % of all permanent jobs advertised in the Thames Valley 4.24% 5.78% 10.64%
As % of the Operating Systems category 33.63% 43.23% 52.20%
Number of salaries quoted 90 315 324
10th Percentile £39,700 £34,750 £27,625
25th Percentile £45,000 £38,750 £37,457
Median annual salary (50th Percentile) £51,000 £52,500 £52,500
Median % change year-on-year -2.86% - -4.55%
75th Percentile £69,801 £65,000 £77,500
90th Percentile £75,000 £75,750 £85,000
South East median annual salary £52,500 £55,000 £50,000
% change year-on-year -4.55% +10.00% -4.76%

All Operating Systems
Thames Valley

Linux falls under the Operating Systems category. For comparison with the information above, the following table provides summary statistics for all permanent job vacancies requiring operating system skills in the Thames Valley.

Permanent vacancies with a requirement for operating system skills 452 946 1,090
As % of all permanent jobs advertised in the Thames Valley 12.60% 13.38% 20.38%
Number of salaries quoted 345 772 672
10th Percentile £25,750 £26,525 £25,000
25th Percentile £32,500 £35,000 £30,750
Median annual salary (50th Percentile) £41,500 £42,500 £44,000
Median % change year-on-year -2.35% -3.41% -12.00%
75th Percentile £50,000 £56,506 £65,000
90th Percentile £65,000 £68,400 £80,000
South East median annual salary £40,000 £45,000 £45,000
% change year-on-year -11.11% - -3.23%

Linux
Job Vacancy Trend in the Thames Valley

Job postings citing Linux as a proportion of all IT jobs advertised in the Thames Valley.
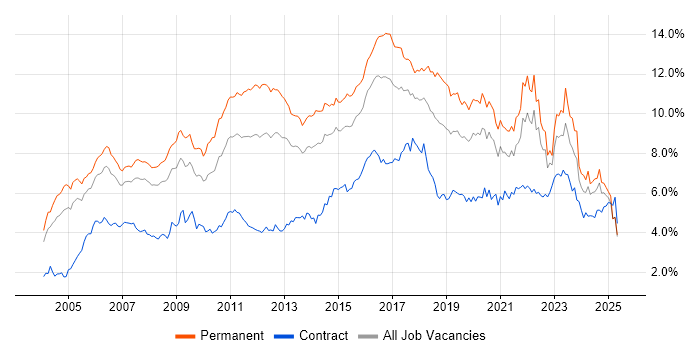
Job vacancy trend for Linux in the Thames Valley

Linux
Salary Trend in the Thames Valley

3-month moving average salary quoted in jobs citing Linux in the Thames Valley.

Salary trend for Linux in the Thames Valley

Linux
Salary Histogram in the Thames Valley

Salary distribution for jobs citing Linux in the Thames Valley over the 6 months to 6 July 2025.

Salary histogram for Linux in the Thames Valley

Linux
Job Locations in the Thames Valley

The table below looks at the demand and provides a guide to the median salaries quoted in IT jobs citing Linux within the Thames Valley region over the 6 months to 6 July 2025. The 'Rank Change' column provides an indication of the change in demand within each location based on the same 6 month period last year.

Location Rank Change
on Same Period
Last Year
Matching
Permanent
IT Job Ads
Median Salary
Past 6 Months
Median Salary
% Change
on Same Period
Last Year
Live
Jobs
Berkshire -39 62 £50,000 -13.79% 84
Oxfordshire +5 48 £55,000 +7.84% 38
Buckinghamshire -7 42 £70,000 +55.56% 20
Linux
South East

Linux
Co-occurring Skills and Capabilities in the Thames Valley by Category

The follow tables expand on the table above by listing co-occurrences grouped by category. The same employment type, locality and period is covered with up to 20 co-occurrences shown in each of the following categories:

Application Platforms
1 9 (5.92%) Microsoft Exchange
2 7 (4.61%) Confluence
3 2 (1.32%) OpenStack
3 2 (1.32%) SharePoint
4 1 (0.66%) Apache
4 1 (0.66%) SharePoint Server
Applications
1 4 (2.63%) Mozilla Thunderbird
2 2 (1.32%) Microsoft Office
2 2 (1.32%) Simulink
3 1 (0.66%) Microsoft Excel
Business Applications
1 4 (2.63%) Dynamics NAV
Cloud Services
1 38 (25.00%) AWS
2 31 (20.39%) Azure
3 18 (11.84%) Microsoft 365
4 12 (7.89%) Amazon S3
5 11 (7.24%) Amazon EC2
5 11 (7.24%) AWS KMS
6 9 (5.92%) Virtual Private Cloud
7 8 (5.26%) Serverless
8 7 (4.61%) Amazon CloudWatch
9 5 (3.29%) Amazon SQS
9 5 (3.29%) AWS CloudFormation
9 5 (3.29%) AWS Lambda
9 5 (3.29%) GCP
9 5 (3.29%) Route 53
10 4 (2.63%) Amazon ECS
10 4 (2.63%) Amazon GuardDuty
10 4 (2.63%) Entra ID
11 3 (1.97%) Amazon EKS
11 3 (1.97%) AWS CodeCommit
11 3 (1.97%) AWS CodeDeploy
Communications & Networking
1 39 (25.66%) VPN
2 37 (24.34%) TCP/IP
3 25 (16.45%) Firewall
4 13 (8.55%) DNS
5 12 (7.89%) SAN
6 9 (5.92%) WAN
7 8 (5.26%) iSCSI
8 7 (4.61%) DHCP
8 7 (4.61%) Remote Desktop
8 7 (4.61%) SD-WAN
9 5 (3.29%) Wi-Fi
10 4 (2.63%) InfiniBand
10 4 (2.63%) SSL
11 3 (1.97%) SMTP
11 3 (1.97%) VLAN
11 3 (1.97%) Wireless
12 2 (1.32%) FTP
12 2 (1.32%) Internet
12 2 (1.32%) IP Telephony
12 2 (1.32%) SSH
Database & Business Intelligence
1 24 (15.79%) MySQL
2 16 (10.53%) PostgreSQL
3 10 (6.58%) SQL Server
4 7 (4.61%) Amazon RDS
5 6 (3.95%) DynamoDB
6 5 (3.29%) Amazon Aurora
6 5 (3.29%) Relational Database
7 4 (2.63%) Metabase
8 2 (1.32%) Elasticsearch
8 2 (1.32%) Metadata
8 2 (1.32%) Power BI
8 2 (1.32%) RDBMS
9 1 (0.66%) BusinessObjects
9 1 (0.66%) DTS
9 1 (0.66%) NoSQL
9 1 (0.66%) SAP HANA
9 1 (0.66%) TimescaleDB
Development Applications
1 35 (23.03%) Cucumber
2 34 (22.37%) Robot Framework
3 20 (13.16%) Git
4 19 (12.50%) Jenkins
5 9 (5.92%) Bitbucket Server
5 9 (5.92%) JIRA
6 8 (5.26%) SonarQube
7 6 (3.95%) JUnit
8 5 (3.29%) DbUnit
8 5 (3.29%) jMock
8 5 (3.29%) Maven
8 5 (3.29%) Mockito
9 2 (1.32%) Burp Suite
9 2 (1.32%) GitLab
9 2 (1.32%) Sonatype Nexus
9 2 (1.32%) Vagrant
10 1 (0.66%) Artifactory
10 1 (0.66%) Bitbucket
10 1 (0.66%) CMake
10 1 (0.66%) Mocha
General
1 77 (50.66%) Social Skills
2 37 (24.34%) Inclusion and Diversity
3 34 (22.37%) Telecoms
4 7 (4.61%) Analytical Skills
4 7 (4.61%) Organisational Skills
5 5 (3.29%) Public Sector
6 4 (2.63%) Presentation Skills
6 4 (2.63%) Retail
7 3 (1.97%) Advertising
7 3 (1.97%) Electronics
8 2 (1.32%) Automotive
8 2 (1.32%) Games
9 1 (0.66%) Aerospace
9 1 (0.66%) Health Technology
9 1 (0.66%) Humanities
9 1 (0.66%) Pharmaceutical
9 1 (0.66%) Spanish Language
Job Titles
1 35 (23.03%) Test Engineer
2 34 (22.37%) Test Automation Engineer
3 27 (17.76%) Senior
4 19 (12.50%) Support Engineer
5 14 (9.21%) DevOps Engineer
6 12 (7.89%) Software Engineer
6 12 (7.89%) Technical Engineer
6 12 (7.89%) Technical Support
6 12 (7.89%) Technical Support Engineer
7 11 (7.24%) Developer
8 10 (6.58%) Infrastructure Engineer
8 10 (6.58%) Linux Engineer
9 8 (5.26%) Administrator
9 8 (5.26%) Applications Engineer
9 8 (5.26%) Applications Support
9 8 (5.26%) Applications Support Engineer
10 7 (4.61%) IT Engineer
10 7 (4.61%) Network Engineer
10 7 (4.61%) Senior Linux Engineer
11 6 (3.95%) IT Support
Libraries, Frameworks & Software Standards
1 9 (5.92%) Web Services
2 6 (3.95%) CSS
2 6 (3.95%) HTML
2 6 (3.95%) REST
2 6 (3.95%) Spring
3 5 (3.29%) ActiveMQ
3 5 (3.29%) AngularJS
3 5 (3.29%) Bootstrap
3 5 (3.29%) Hibernate
3 5 (3.29%) JPA
3 5 (3.29%) Laravel
3 5 (3.29%) PowerMock
3 5 (3.29%) RESTful
3 5 (3.29%) SOAP
3 5 (3.29%) Spring Batch
3 5 (3.29%) Spring Boot
3 5 (3.29%) Spring Integration
4 3 (1.97%) Elastic Stack
4 3 (1.97%) LAMP
5 2 (1.32%) React
Miscellaneous
1 41 (26.97%) Linux Command Line
2 10 (6.58%) Management Information System
3 9 (5.92%) Algorithms
3 9 (5.92%) Cloud Native
4 8 (5.26%) IoT
4 8 (5.26%) Self-Motivation
5 6 (3.95%) Data Centre
6 5 (3.29%) Replication
6 5 (3.29%) Video Conferencing
7 4 (2.63%) Distributed Systems
7 4 (2.63%) Greenfield Project
7 4 (2.63%) Self-Driving Car
8 3 (1.97%) Clustering
8 3 (1.97%) Distributed Architecture
8 3 (1.97%) Robotics
9 2 (1.32%) Acoustics
9 2 (1.32%) Cyberattack
9 2 (1.32%) Embedded Systems
9 2 (1.32%) Fibre Optics
9 2 (1.32%) Online Games
Operating Systems
1 74 (48.68%) Windows
2 18 (11.84%) Unix
3 14 (9.21%) Mac OS
4 10 (6.58%) Windows Server 2019
5 8 (5.26%) Red Hat Enterprise Linux
6 7 (4.61%) Windows Server
7 6 (3.95%) SUSE
7 6 (3.95%) Ubuntu
8 5 (3.29%) SUSE Linux Enterprise Server
9 4 (2.63%) Apple iOS
10 3 (1.97%) Windows 10
10 3 (1.97%) Windows Server 2016
11 2 (1.32%) Amazon Linux
11 2 (1.32%) Android
11 2 (1.32%) Embedded Linux
11 2 (1.32%) VMS
12 1 (0.66%) AIX
12 1 (0.66%) Kali Linux
Processes & Methodologies
1 54 (35.53%) Problem-Solving
2 50 (32.89%) DevOps
3 39 (25.66%) Test Automation
4 38 (25.00%) Mentoring
5 34 (22.37%) Coaching
5 34 (22.37%) System Testing
5 34 (22.37%) Test Management
6 21 (13.82%) Agile
7 20 (13.16%) Software Engineering
8 18 (11.84%) Computer Science
9 17 (11.18%) Containerisation
10 15 (9.87%) ITIL
11 13 (8.55%) CI/CD
12 12 (7.89%) Infrastructure Engineering
12 12 (7.89%) Physics
13 11 (7.24%) Cybersecurity
13 11 (7.24%) Mathematics
14 10 (6.58%) Patch Management
15 9 (5.92%) Microservices
15 9 (5.92%) Open Source
Programming Languages
1 85 (55.92%) Python
2 64 (42.11%) Bash
3 42 (27.63%) JavaScript
4 39 (25.66%) PowerShell
5 25 (16.45%) SQL
6 20 (13.16%) C++
7 14 (9.21%) Java
8 8 (5.26%) C
9 7 (4.61%) Korn
9 7 (4.61%) PL/SQL
9 7 (4.61%) Shell Script
10 6 (3.95%) Fortran
10 6 (3.95%) Perl
11 5 (3.29%) Go
11 5 (3.29%) MATLAB
12 4 (2.63%) PHP
13 3 (1.97%) Groovy
14 2 (1.32%) Ruby
14 2 (1.32%) Rust
15 1 (0.66%) TypeScript
Qualifications
1 65 (42.76%) Degree
2 23 (15.13%) Security Cleared
3 18 (11.84%) SC Cleared
4 11 (7.24%) Microsoft Certification
5 8 (5.26%) DV Cleared
6 7 (4.61%) Master's Degree
6 7 (4.61%) MCP
6 7 (4.61%) PhD
7 6 (3.95%) MCSE
8 4 (2.63%) A+ Certification
8 4 (2.63%) Dell Certification
9 3 (1.97%) Computer Science Degree
9 3 (1.97%) LPIC
9 3 (1.97%) MCSA
9 3 (1.97%) Numerate Degree
9 3 (1.97%) RHCE
10 2 (1.32%) AWS Certification
10 2 (1.32%) Azure Certification
10 2 (1.32%) OSCP
11 1 (0.66%) ITIL Foundation Certificate
Quality Assurance & Compliance
1 36 (23.68%) QA
2 5 (3.29%) ISO/IEC 27001
3 4 (2.63%) Cyber Essentials
3 4 (2.63%) Cyber Essentials PLUS
4 2 (1.32%) GDPR
5 1 (0.66%) GRC
5 1 (0.66%) NIST
System Software
1 35 (23.03%) Docker
2 24 (15.79%) Active Directory
3 18 (11.84%) VMware Infrastructure
4 11 (7.24%) NFS
5 10 (6.58%) Hyper-V
6 7 (4.61%) Citrix Hypervisor
7 5 (3.29%) Virtual Machines
8 4 (2.63%) Virtual Desktop
8 4 (2.63%) VMware ESXi
9 3 (1.97%) GPFS
9 3 (1.97%) Lustre
9 3 (1.97%) vCloud
10 2 (1.32%) DFS Replication
10 2 (1.32%) vSphere
11 1 (0.66%) Microsoft Virtual Server
11 1 (0.66%) Postfix
11 1 (0.66%) Virtual Servers
Systems Management
1 24 (15.79%) Kubernetes
2 17 (11.18%) Terraform
3 13 (8.55%) Ansible
4 4 (2.63%) Grafana
4 4 (2.63%) Microsoft Intune
4 4 (2.63%) Nessus
4 4 (2.63%) Prometheus
4 4 (2.63%) Proxmox
4 4 (2.63%) SCCM
5 3 (1.97%) FortiGate
5 3 (1.97%) PaperCut
6 2 (1.32%) Docker Swarm
6 2 (1.32%) Kubespray
6 2 (1.32%) Rundeck
6 2 (1.32%) ZENworks
7 1 (0.66%) Nmap
7 1 (0.66%) PowerCLI
7 1 (0.66%) SCOM
7 1 (0.66%) vCenter Server
7 1 (0.66%) vRealize
Vendors
1 30 (19.74%) Microsoft
2 21 (13.82%) VMware
3 11 (7.24%) Dell
4 8 (5.26%) Cisco
4 8 (5.26%) Red Hat
5 7 (4.61%) Splunk
6 6 (3.95%) Atlassian
6 6 (3.95%) Juniper
6 6 (3.95%) SAP
7 4 (2.63%) Apple
7 4 (2.63%) Sophos
8 3 (1.97%) Meraki
8 3 (1.97%) Oracle
9 2 (1.32%) Arista
9 2 (1.32%) Aruba
9 2 (1.32%) Extreme Networks
9 2 (1.32%) HP
9 2 (1.32%) Jaspersoft
9 2 (1.32%) Palo Alto
9 2 (1.32%) ServiceNow