PowerShell Job Trends in the Thames Valley

Windows PowerShell
South East > Thames Valley

The table below provides summary statistics and salary benchmarking for jobs advertised in the Thames Valley requiring PowerShell skills. It covers permanent job vacancies from the 6 months leading up to 28 October 2025, with comparisons to the same periods in the previous two years.

6 months to
28 Oct 2025
Same period 2024 Same period 2023
Rank 135 96 33
Rank change year-on-year -39 -63 +57
Permanent jobs citing PowerShell 57 103 232
As % of all permanent jobs in the Thames Valley 1.53% 2.37% 6.84%
As % of the Programming Languages category 9.60% 7.89% 15.97%
Number of salaries quoted 48 56 157
10th Percentile £36,250 £39,065 £30,500
25th Percentile £42,750 £41,732 £39,380
Median annual salary (50th Percentile) £46,000 £50,250 £54,500
Median % change year-on-year -8.46% -7.80% +4.81%
75th Percentile £77,500 £58,206 £60,000
90th Percentile £85,000 £66,250 £74,450
South East median annual salary £58,000 £56,252 £54,500
% change year-on-year +3.11% +3.21% -0.91%

All Programming Languages
Thames Valley

PowerShell falls under the Programming Languages category. For comparison with the information above, the following table provides summary statistics for all permanent job vacancies requiring coding skills in the Thames Valley.

Permanent vacancies with a requirement for coding skills 594 1,305 1,453
As % of all permanent jobs advertised in the Thames Valley 15.95% 30.09% 42.81%
Number of salaries quoted 386 724 1,002
10th Percentile £33,250 £37,500 £36,250
25th Percentile £41,250 £46,250 £46,100
Median annual salary (50th Percentile) £56,965 £60,000 £57,500
Median % change year-on-year -5.06% +4.35% -4.17%
75th Percentile £70,000 £75,000 £75,000
90th Percentile £83,750 £85,000 £90,000
South East median annual salary £55,000 £57,500 £55,000
% change year-on-year -4.35% +4.55% -4.35%

PowerShell
Job Vacancy Trend in the Thames Valley

Historical trend showing the proportion of permanent IT job postings citing PowerShell relative to all permanent IT jobs advertised in the Thames Valley.
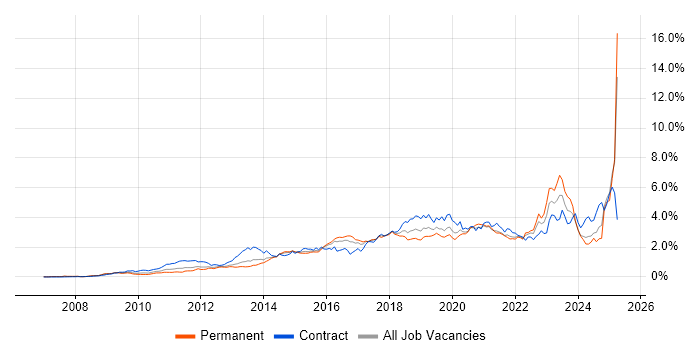
PowerShell job vacancy trend in the Thames Valley

PowerShell
Salary Trend in the Thames Valley

Salary distribution trend for jobs in the Thames Valley citing PowerShell.

Salary distribution trend for jobs in the Thames Valley citing PowerShell

PowerShell
Salary Histogram in the Thames Valley

Salary distribution for jobs citing PowerShell in the Thames Valley over the 6 months to 28 October 2025.

Salary histogram for PowerShell in the Thames Valley

PowerShell
Job Locations in the Thames Valley

The table below looks at the demand and provides a guide to the median salaries quoted in IT jobs citing PowerShell within the Thames Valley region over the 6 months to 28 October 2025. The 'Rank Change' column provides an indication of the change in demand within each location based on the same 6 month period last year.

Location Rank Change
on Same Period
Last Year
Matching
Permanent
IT Job Ads
Median Salary
Past 6 Months
Median Salary
% Change
on Same Period
Last Year
Live
Jobs
Buckinghamshire +8 25 £55,000 +22.22% 9
Berkshire -47 23 £48,000 -14.67% 50
Oxfordshire +16 9 £43,500 -3.29% 10
PowerShell
South East

PowerShell
Co-Occurring Skills & Capabilities in the Thames Valley by Category

The following tables expand on the one above by listing co-occurrences grouped by category. They cover the same employment type, locality and period, with up to 20 co-occurrences shown in each category:

Application Platforms
1 21 (36.84%) Microsoft Exchange
2 13 (22.81%) SharePoint
3 2 (3.51%) Confluence
3 2 (3.51%) IIS
4 1 (1.75%) CMS
4 1 (1.75%) Oracle Workflow
4 1 (1.75%) WordPress
Applications
1 2 (3.51%) Microsoft Office
2 1 (1.75%) Spreadsheet
Business Applications
1 1 (1.75%) NetSuite
Cloud Services
1 43 (75.44%) Azure
2 25 (43.86%) Entra ID
3 18 (31.58%) Microsoft 365
4 14 (24.56%) AWS
5 13 (22.81%) Azure DevOps
6 10 (17.54%) GitHub
6 10 (17.54%) GitHub Actions
7 8 (14.04%) Azure Key Vault
8 5 (8.77%) Amazon EC2
8 5 (8.77%) Amazon S3
8 5 (8.77%) Power Platform
8 5 (8.77%) Virtual Private Cloud
9 4 (7.02%) GCP
10 3 (5.26%) AWS CloudFormation
10 3 (5.26%) AWS Lambda
10 3 (5.26%) Azure Data Factory
10 3 (5.26%) Azure Monitor
10 3 (5.26%) SaaS
10 3 (5.26%) Serverless
11 2 (3.51%) PaaS
Communications & Networking
1 25 (43.86%) Firewall
2 23 (40.35%) DNS
3 13 (22.81%) DHCP
4 9 (15.79%) IP Telephony
5 7 (12.28%) SMTP
5 7 (12.28%) VPN
6 6 (10.53%) TCP/IP
7 4 (7.02%) Wireless
8 3 (5.26%) SD-WAN
8 3 (5.26%) WAN
9 2 (3.51%) FTP
9 2 (3.51%) HTTP
9 2 (3.51%) SAN
9 2 (3.51%) SSH
9 2 (3.51%) VLAN
10 1 (1.75%) Ethernet
10 1 (1.75%) Network Security
10 1 (1.75%) SSL
Database & Business Intelligence
1 14 (24.56%) Amazon RDS
2 11 (19.30%) SQL Server
3 4 (7.02%) MySQL
3 4 (7.02%) Power BI
4 2 (3.51%) Azure SQL Database
4 2 (3.51%) Data Lake
4 2 (3.51%) Data Mining
4 2 (3.51%) Data Warehouse
4 2 (3.51%) PostgreSQL
4 2 (3.51%) Relational Database
4 2 (3.51%) SQL Server Reporting Services
Development Applications
1 13 (22.81%) Git
2 9 (15.79%) Jenkins
3 3 (5.26%) Burp Suite
3 3 (5.26%) Metasploit
4 2 (3.51%) JIRA
4 2 (3.51%) Sonatype Nexus
4 2 (3.51%) Vagrant
5 1 (1.75%) Maven
5 1 (1.75%) MSBuild
General
1 11 (19.30%) Social Skills
2 3 (5.26%) Inclusion and Diversity
3 2 (3.51%) Analytical Skills
3 2 (3.51%) Presentation Skills
Job Titles
1 16 (28.07%) Platform Engineer
2 12 (21.05%) Lead
3 9 (15.79%) Support Technician
3 9 (15.79%) Technical Support
4 7 (12.28%) 3rd Line Engineer
5 6 (10.53%) Azure Engineer
5 6 (10.53%) Infrastructure Engineer
5 6 (10.53%) Support Engineer
6 5 (8.77%) 3rd Line Support
6 5 (8.77%) 3rd Line Support Engineer
6 5 (8.77%) Cloud Engineer
6 5 (8.77%) Microsoft 365 Engineer
6 5 (8.77%) Microsoft Engineer
6 5 (8.77%) Systems Engineer
7 4 (7.02%) Senior
8 3 (5.26%) AWS Platform Engineer
8 3 (5.26%) Cloud Network Engineer
8 3 (5.26%) Cloud Platform Engineer
8 3 (5.26%) Senior Platform Engineer
8 3 (5.26%) SOC Engineer
Libraries, Frameworks & Software Standards
1 6 (10.53%) ARM Templates
2 2 (3.51%) .NET
3 1 (1.75%) JSON
3 1 (1.75%) REST
3 1 (1.75%) SOAP
3 1 (1.75%) Web Services
3 1 (1.75%) XML
Miscellaneous
1 24 (42.11%) Onboarding
2 9 (15.79%) Data Centre
3 6 (10.53%) Linux Command Line
4 4 (7.02%) Cloud Native
4 4 (7.02%) Replication
5 3 (5.26%) Virtual Team
6 2 (3.51%) Clustering
6 2 (3.51%) NHS
7 1 (1.75%) Analytical Mindset
7 1 (1.75%) CMDB
7 1 (1.75%) Distributed Systems
7 1 (1.75%) Fibre Optics
7 1 (1.75%) Low-Code
Operating Systems
1 24 (42.11%) Windows
2 18 (31.58%) Windows Server
3 14 (24.56%) Linux
4 10 (17.54%) Mac OS
5 8 (14.04%) VMS
6 3 (5.26%) Kali Linux
7 2 (3.51%) Amazon Linux
7 2 (3.51%) Windows 10
8 1 (1.75%) Android
8 1 (1.75%) Apple iOS
8 1 (1.75%) Red Hat Enterprise Linux
Processes & Methodologies
1 22 (38.60%) Problem-Solving
2 15 (26.32%) CI/CD
2 15 (26.32%) DevOps
3 13 (22.81%) Platform Engineering
4 10 (17.54%) Containerisation
4 10 (17.54%) Observability
4 10 (17.54%) Resource Management
4 10 (17.54%) Server Management
5 9 (15.79%) Infrastructure as Code
5 9 (15.79%) RBAC
5 9 (15.79%) Task Automation
5 9 (15.79%) Technical Leadership
6 8 (14.04%) Network Virtualisation
6 8 (14.04%) Servant Leadership
7 7 (12.28%) Mentoring
8 6 (10.53%) Cloud Security
8 6 (10.53%) Cybersecurity
8 6 (10.53%) Infrastructure Engineering
8 6 (10.53%) ITIL
8 6 (10.53%) Matrix Management
Programming Languages
1 20 (35.09%) Bash
2 16 (28.07%) Python
3 9 (15.79%) SQL
4 3 (5.26%) Java
4 3 (5.26%) T-SQL
5 2 (3.51%) Bicep
5 2 (3.51%) C#
5 2 (3.51%) Groovy
5 2 (3.51%) JavaScript
5 2 (3.51%) Perl
6 1 (1.75%) Kusto Query Language
6 1 (1.75%) VB.NET
Qualifications
1 9 (15.79%) Degree
2 7 (12.28%) Security Cleared
3 6 (10.53%) SC Cleared
4 5 (8.77%) Azure Certification
5 3 (5.26%) OSCP
6 2 (3.51%) AWS Certification
6 2 (3.51%) DBS Check
6 2 (3.51%) MCSE
6 2 (3.51%) Microsoft Certification
7 1 (1.75%) CCNA
7 1 (1.75%) Cisco Certification
7 1 (1.75%) CREST Certified
7 1 (1.75%) GPEN
7 1 (1.75%) HND
7 1 (1.75%) MCP
7 1 (1.75%) MCSA
7 1 (1.75%) RHCE
7 1 (1.75%) RHCSA
Quality Assurance & Compliance
1 3 (5.26%) NIST
2 2 (3.51%) GDPR
3 1 (1.75%) HIPAA
System Software
1 32 (56.14%) Active Directory
2 15 (26.32%) Docker
3 9 (15.79%) Hyper-V
3 9 (15.79%) Terminal Services
4 7 (12.28%) VMware Infrastructure
5 4 (7.02%) Virtual Servers
6 3 (5.26%) Virtual Machines
7 2 (3.51%) DFS Replication
7 2 (3.51%) Microsoft Virtual Server
7 2 (3.51%) VMware ESXi
7 2 (3.51%) vSphere
Systems Management
1 18 (31.58%) Microsoft Intune
2 17 (29.82%) Terraform
3 11 (19.30%) Kubernetes
4 6 (10.53%) WSUS
5 4 (7.02%) Ansible
6 3 (5.26%) Nmap
7 2 (3.51%) Failover Clustering
7 2 (3.51%) Grafana
7 2 (3.51%) Prometheus
7 2 (3.51%) SCCM
7 2 (3.51%) Single Sign-On
8 1 (1.75%) Red Hat Satellite
8 1 (1.75%) SCOM
8 1 (1.75%) SCSM
Vendors
1 38 (66.67%) Microsoft
2 12 (21.05%) VMware
3 9 (15.79%) Apple
4 6 (10.53%) Citrix
5 3 (5.26%) ServiceNow
6 2 (3.51%) Cisco
6 2 (3.51%) Databricks
6 2 (3.51%) Meraki
6 2 (3.51%) Trend Micro
6 2 (3.51%) Veeam
7 1 (1.75%) Automation Anywhere
7 1 (1.75%) Blue Prism
7 1 (1.75%) HubSpot
7 1 (1.75%) Oracle
7 1 (1.75%) Red Hat
7 1 (1.75%) SolarWinds
7 1 (1.75%) UiPath