Lead Jobs in the Thames Valley

Leader
South East > Thames Valley

The median Leader salary in the Thames Valley is £75,000 per year, according to job vacancies posted during the 6 months leading to 14 May 2025.

The table below provides salary benchmarking and summary statistics, comparing them to the same period in the previous two years.

6 months to
14 May 2025
Same period 2024 Same period 2023
Rank 14 26 46
Rank change year-on-year +12 +20 +4
Permanent jobs requiring a Lead 379 467 351
As % of all permanent jobs advertised in the Thames Valley 11.20% 6.97% 5.86%
As % of the Job Titles category 13.38% 7.36% 6.53%
Number of salaries quoted 101 329 256
10th Percentile £39,000 £41,500 £41,250
25th Percentile £55,000 £47,500 £52,000
Median annual salary (50th Percentile) £75,000 £62,168 £65,000
Median % change year-on-year +20.64% -4.36% -8.45%
75th Percentile £93,250 £85,000 £77,500
90th Percentile £97,500 £95,000 £100,000
South East median annual salary £67,500 £62,500 £67,500
% change year-on-year +8.00% -7.41% -

All Permanent IT Job Vacancies
Thames Valley

For comparison with the information above, the following table provides summary statistics for all permanent IT job vacancies in the Thames Valley. Most job vacancies include a discernible job title that can be normalized. As such, the figures in the second row provide an indication of the number of permanent jobs in our overall sample.

Permanent vacancies in the Thames Valley with a recognized job title 2,832 6,343 5,375
% of permanent jobs with a recognized job title 83.66% 94.67% 89.78%
Number of salaries quoted 1,265 4,436 3,168
10th Percentile £29,000 £29,000 £29,000
25th Percentile £38,500 £36,250 £37,500
Median annual salary (50th Percentile) £55,000 £50,000 £55,000
Median % change year-on-year +10.00% -9.09% -
75th Percentile £71,250 £65,000 £72,500
90th Percentile £87,500 £78,750 £87,500
South East median annual salary £55,000 £50,000 £55,000
% change year-on-year +10.00% -9.09% -

Lead
Job Vacancy Trend in the Thames Valley

Job postings that featured Lead in the job title as a proportion of all IT jobs advertised in the Thames Valley.
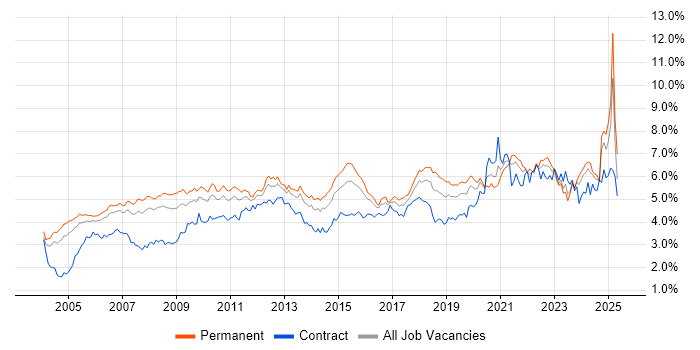
Job vacancy trend for Lead in the Thames Valley

Lead
Salary Trend in the Thames Valley

3-month moving average salary quoted in jobs citing Lead in the Thames Valley.

Salary trend for Lead in the Thames Valley

Lead
Salary Histogram in the Thames Valley

Salary distribution for jobs citing Lead in the Thames Valley over the 6 months to 14 May 2025.

Salary histogram for Lead in the Thames Valley

Lead
Job Locations in the Thames Valley

The table below looks at the demand and provides a guide to the median salaries quoted in IT jobs citing Lead within the Thames Valley region over the 6 months to 14 May 2025. The 'Rank Change' column provides an indication of the change in demand within each location based on the same 6 month period last year.

Location Rank Change
on Same Period
Last Year
Matching
Permanent
IT Job Ads
Median Salary
Past 6 Months
Median Salary
% Change
on Same Period
Last Year
Live
Jobs
Berkshire +21 306 £80,000 +6.67% 81
Buckinghamshire -21 47 £70,000 +16.67% 36
Oxfordshire -24 26 £75,000 +42.86% 30
Lead
South East

Lead Skill Set
Top 30 Co-occurring Skills and Capabilities in the Thames Valley

For the 6 months to 14 May 2025, Lead job roles required the following skills and capabilities in order of popularity. The figures indicate the absolute number co-occurrences and as a proportion of all permanent job ads across the Thames Valley region featuring Lead in the job title.

1 243 (64.12%) Law
2 156 (41.16%) Analytics
3 137 (36.15%) Degree
4 135 (35.62%) Social Skills
5 120 (31.66%) Problem-Solving
6 112 (29.55%) Stakeholder Management
7 110 (29.02%) Roadmaps
8 106 (27.97%) Azure
9 100 (26.39%) Microsoft
9 100 (26.39%) Data Management
10 99 (26.12%) Business Transformation
11 86 (22.69%) Business Intelligence
12 85 (22.43%) Computer Science
13 84 (22.16%) Data Modelling
13 84 (22.16%) Product Management
14 83 (21.90%) Data Architecture
15 82 (21.64%) SAP
16 78 (20.58%) Data Engineering
17 75 (19.79%) Agile
18 74 (19.53%) Project Management
19 71 (18.73%) Data Governance
20 70 (18.47%) Strategic Thinking
21 65 (17.15%) Data Science
22 60 (15.83%) Data Lake
22 60 (15.83%) Artificial Intelligence
23 58 (15.30%) Finance
23 58 (15.30%) Data Quality
23 58 (15.30%) Analytical Skills
24 54 (14.25%) Continuous Improvement
25 49 (12.93%) Machine Learning

Lead Skill Set
Co-occurring Skills and Capabilities in the Thames Valley by Category

The follow tables expand on the table above by listing co-occurrences grouped by category. The same employment type, locality and period is covered with up to 20 co-occurrences shown in each of the following categories:

Application Platforms
1 26 (6.86%) SharePoint
2 5 (1.32%) IBM Domino
3 3 (0.79%) CMS
4 2 (0.53%) Apache
4 2 (0.53%) Oracle Workflow
5 1 (0.26%) Apache Spark
5 1 (0.26%) Confluence
5 1 (0.26%) IIS
5 1 (0.26%) Oracle HTTP Server
5 1 (0.26%) Tomcat
5 1 (0.26%) WebLogic
Applications
1 1 (0.26%) Microsoft PowerPoint
1 1 (0.26%) Spreadsheet
Business Applications
1 3 (0.79%) Oracle EBS
1 3 (0.79%) Oracle EBS R12
1 3 (0.79%) Oracle Financials
2 2 (0.53%) Oracle ERP
2 2 (0.53%) SAP Business One
3 1 (0.26%) Oracle Payables
Cloud Services
1 106 (27.97%) Azure
2 40 (10.55%) AWS
3 35 (9.23%) GCP
4 28 (7.39%) Power Platform
5 26 (6.86%) Power Automate
5 26 (6.86%) PowerApps
6 24 (6.33%) Snowflake
7 15 (3.96%) Vertex AI
8 12 (3.17%) Azure Data Factory
8 12 (3.17%) Azure Synapse Analytics
9 6 (1.58%) Azure DevOps
9 6 (1.58%) Microsoft 365
9 6 (1.58%) Microsoft Purview
9 6 (1.58%) SaaS
10 5 (1.32%) Collibra
10 5 (1.32%) Figma
11 4 (1.06%) Amazon S3
11 4 (1.06%) Amazon SQS
11 4 (1.06%) Entra ID
12 3 (0.79%) Amazon CloudWatch
Communications & Networking
1 11 (2.90%) Wi-Fi
2 9 (2.37%) 5G
2 9 (2.37%) Bluetooth
2 9 (2.37%) LTE
3 7 (1.85%) Broadband
4 6 (1.58%) LAN
4 6 (1.58%) WAN
5 3 (0.79%) Network Security
5 3 (0.79%) SSL
6 2 (0.53%) DMZ
6 2 (0.53%) DWDM
6 2 (0.53%) Firewall
6 2 (0.53%) Internet
6 2 (0.53%) MPLS
6 2 (0.53%) Remote Desktop
6 2 (0.53%) SD-WAN
6 2 (0.53%) VPN
7 1 (0.26%) HTTP
7 1 (0.26%) Radio Access Network
7 1 (0.26%) Software-Defined Networking
Database & Business Intelligence
1 60 (15.83%) Data Lake
2 28 (7.39%) Power BI
3 27 (7.12%) Big Data
4 26 (6.86%) Tableau
5 25 (6.60%) Data Warehouse
6 24 (6.33%) Data Mining
6 24 (6.33%) Metadata
7 8 (2.11%) SQL Server
8 7 (1.85%) NoSQL
9 4 (1.06%) PostgreSQL
10 3 (0.79%) Amazon Aurora
10 3 (0.79%) Amazon RDS
10 3 (0.79%) DynamoDB
10 3 (0.79%) Electronic Patient Records
10 3 (0.79%) SQL Server Integration Services
11 2 (0.53%) MongoDB
11 2 (0.53%) MySQL
11 2 (0.53%) Oracle BI Publisher
11 2 (0.53%) Oracle Reports
11 2 (0.53%) Weaviate
Development Applications
1 11 (2.90%) Git
2 7 (1.85%) Cypress.io
2 7 (1.85%) Selenium
2 7 (1.85%) SoapUI
3 6 (1.58%) JIRA
4 3 (0.79%) Jenkins
4 3 (0.79%) JUnit
4 3 (0.79%) Maven
4 3 (0.79%) Mockito
4 3 (0.79%) SonarQube
5 2 (0.53%) Bitbucket Server
5 2 (0.53%) DbUnit
5 2 (0.53%) jMock
5 2 (0.53%) MLflow
5 2 (0.53%) Oracle Forms
5 2 (0.53%) Visual Studio
General
1 243 (64.12%) Law
2 135 (35.62%) Social Skills
3 58 (15.30%) Analytical Skills
3 58 (15.30%) Finance
4 36 (9.50%) Retail
5 23 (6.07%) Inclusion and Diversity
6 18 (4.75%) Influencing Skills
6 18 (4.75%) Legal
7 9 (2.37%) Electronics
8 5 (1.32%) Manufacturing
8 5 (1.32%) Public Sector
9 4 (1.06%) Multimedia
10 3 (0.79%) Health Technology
10 3 (0.79%) Marketing
10 3 (0.79%) Tech for Good
11 2 (0.53%) Aerospace
11 2 (0.53%) Games
11 2 (0.53%) Organisational Skills
11 2 (0.53%) Telecoms
12 1 (0.26%) Advertising
Libraries, Frameworks & Software Standards
1 16 (4.22%) React
2 11 (2.90%) .NET
3 7 (1.85%) Jest
4 6 (1.58%) AngularJS
5 4 (1.06%) SOAP
6 3 (0.79%) ActiveMQ
6 3 (0.79%) Bootstrap
6 3 (0.79%) FHIR
6 3 (0.79%) JPA
6 3 (0.79%) Kafka
6 3 (0.79%) Oracle Fusion
6 3 (0.79%) REST
6 3 (0.79%) RESTful
6 3 (0.79%) Ruby on Rails
6 3 (0.79%) Spring
6 3 (0.79%) Spring Boot
6 3 (0.79%) Swagger
7 2 (0.53%) PyTorch
7 2 (0.53%) Spring Cloud
7 2 (0.53%) TensorFlow
Miscellaneous
1 37 (9.76%) Product Ownership
2 29 (7.65%) Algorithms
3 22 (5.80%) Enterprise Software
4 9 (2.37%) IoT
4 9 (2.37%) NB-IoT
5 4 (1.06%) Cloud Native
5 4 (1.06%) Hybrid Cloud
5 4 (1.06%) Management Information System
6 3 (0.79%) Greenfield Project
6 3 (0.79%) Legacy Systems
6 3 (0.79%) NHS
6 3 (0.79%) Private Cloud
7 2 (0.53%) Data Centre
7 2 (0.53%) Data Structures
7 2 (0.53%) Distributed Systems
7 2 (0.53%) Home Automation
7 2 (0.53%) Operational Technology
7 2 (0.53%) Public Cloud
8 1 (0.26%) Mainframe
8 1 (0.26%) Thin Client
Operating Systems
1 12 (3.17%) Linux
1 12 (3.17%) Windows
2 11 (2.90%) Windows Server
3 1 (0.26%) AIX
3 1 (0.26%) Red Hat Enterprise Linux
3 1 (0.26%) SUSE
Processes & Methodologies
1 156 (41.16%) Analytics
2 120 (31.66%) Problem-Solving
3 112 (29.55%) Stakeholder Management
4 110 (29.02%) Roadmaps
5 100 (26.39%) Data Management
6 99 (26.12%) Business Transformation
7 86 (22.69%) Business Intelligence
8 85 (22.43%) Computer Science
9 84 (22.16%) Data Modelling
9 84 (22.16%) Product Management
10 83 (21.90%) Data Architecture
11 78 (20.58%) Data Engineering
12 75 (19.79%) Agile
13 74 (19.53%) Project Management
14 71 (18.73%) Data Governance
15 70 (18.47%) Strategic Thinking
16 65 (17.15%) Data Science
17 60 (15.83%) Artificial Intelligence
18 54 (14.25%) Continuous Improvement
19 49 (12.93%) Machine Learning
Programming Languages
1 48 (12.66%) Python
2 39 (10.29%) SQL
3 14 (3.69%) C#
4 13 (3.43%) JavaScript
5 11 (2.90%) Java
6 9 (2.37%) Bash
6 9 (2.37%) PowerShell
7 8 (2.11%) TypeScript
8 5 (1.32%) ABAP
9 3 (0.79%) Ruby
10 2 (0.53%) C++
10 2 (0.53%) PHP
10 2 (0.53%) PL/SQL
10 2 (0.53%) R
11 1 (0.26%) Delphi
11 1 (0.26%) Go
Qualifications
1 137 (36.15%) Degree
2 19 (5.01%) PMI Certification
2 19 (5.01%) PMP
3 16 (4.22%) Computer Science Degree
4 9 (2.37%) CompTIA Security+
4 9 (2.37%) Network+ Certification
5 6 (1.58%) Master's Degree
5 6 (1.58%) Security Cleared
6 5 (1.32%) MBA
7 4 (1.06%) CISSP
7 4 (1.06%) SC Cleared
8 3 (0.79%) Microsoft Certification
9 2 (0.53%) CCNP
9 2 (0.53%) Cisco Certification
9 2 (0.53%) CISMP
9 2 (0.53%) DV Cleared
9 2 (0.53%) MCSA
9 2 (0.53%) MCSE
9 2 (0.53%) Numerate Degree
9 2 (0.53%) TOGAF Certification
Quality Assurance & Compliance
1 58 (15.30%) Data Quality
2 27 (7.12%) QA
3 25 (6.60%) Accessibility
4 12 (3.17%) SLA
5 6 (1.58%) Sarbanes-Oxley
6 4 (1.06%) ISO/IEC 27001
6 4 (1.06%) NIST
7 3 (0.79%) HL7
7 3 (0.79%) PCI DSS
7 3 (0.79%) SNOMED CT
8 2 (0.53%) Def Stans
9 1 (0.26%) GDPR
9 1 (0.26%) ISO 14001
9 1 (0.26%) ISO 22301
9 1 (0.26%) ISO 9001
9 1 (0.26%) NEBOSH
9 1 (0.26%) SOC 2
System Software
1 14 (3.69%) Docker
2 10 (2.64%) VMware Infrastructure
3 9 (2.37%) vSphere
4 6 (1.58%) Active Directory
5 1 (0.26%) HDFS
5 1 (0.26%) Postfix
5 1 (0.26%) Virtual Desktop
5 1 (0.26%) VMware NSX
Systems Management
1 15 (3.96%) Terraform
2 13 (3.43%) Ansible
3 9 (2.37%) Kubernetes
3 9 (2.37%) Puppet
4 2 (0.53%) Grafana
4 2 (0.53%) Kubeflow
4 2 (0.53%) Prometheus
5 1 (0.26%) Argo
5 1 (0.26%) EMC NetWorker
Vendors
1 100 (26.39%) Microsoft
2 82 (21.64%) SAP
3 27 (7.12%) ServiceNow
4 24 (6.33%) IBM
5 20 (5.28%) Concur
6 19 (5.01%) Workday
7 18 (4.75%) VMware
8 15 (3.96%) Google
8 15 (3.96%) OpenAI
9 12 (3.17%) Cisco
9 12 (3.17%) Databricks
10 10 (2.64%) Oracle
10 10 (2.64%) Salesforce
11 6 (1.58%) Dell
11 6 (1.58%) NetApp
12 5 (1.32%) Informatica
13 4 (1.06%) Aruba
13 4 (1.06%) Fortinet
13 4 (1.06%) NVIDIA
13 4 (1.06%) Palo Alto