Time Management Jobs in the Thames Valley

Time Management
South East > Thames Valley

The table below provides summary statistics for permanent job vacancies advertised in the Thames Valley requiring Time Management skills. It includes a benchmarking guide to the annual salaries offered in vacancies that cited Time Management over the 6 months leading up to 13 December 2024, comparing them to the same period in the previous two years.

6 months to
13 Dec 2024
Same period 2023 Same period 2022
Rank 103 119 88
Rank change year-on-year +16 -31 -4
Permanent jobs citing Time Management 93 70 223
As % of all permanent jobs advertised in the Thames Valley 2.47% 2.00% 3.58%
As % of the Processes & Methodologies category 2.75% 2.14% 3.76%
Number of salaries quoted 32 23 87
10th Percentile £25,925 £24,450 £26,400
25th Percentile £38,750 £35,125 £35,125
Median annual salary (50th Percentile) £58,499 £47,500 £45,000
Median % change year-on-year +23.16% +5.56% -18.18%
75th Percentile £67,500 £65,000 £60,000
90th Percentile - - £66,250
South East median annual salary £55,000 £50,000 £47,500
% change year-on-year +10.00% +5.26% -

All Process and Methodology Skills
Thames Valley

Time Management falls under the Processes and Methodologies category. For comparison with the information above, the following table provides summary statistics for all permanent job vacancies requiring process or methodology skills in the Thames Valley.

Permanent vacancies with a requirement for process or methodology skills 3,384 3,270 5,933
As % of all permanent jobs advertised in the Thames Valley 89.81% 93.32% 95.16%
Number of salaries quoted 1,634 2,145 3,486
10th Percentile £35,000 £32,500 £30,000
25th Percentile £45,000 £40,000 £40,500
Median annual salary (50th Percentile) £60,000 £55,000 £55,000
Median % change year-on-year +9.09% - -
75th Percentile £75,000 £68,750 £72,500
90th Percentile £88,350 £85,000 £85,000
South East median annual salary £57,500 £54,500 £55,000
% change year-on-year +5.50% -0.91% -

Time Management
Job Vacancy Trend in the Thames Valley

Job postings citing Time Management as a proportion of all IT jobs advertised in the Thames Valley.
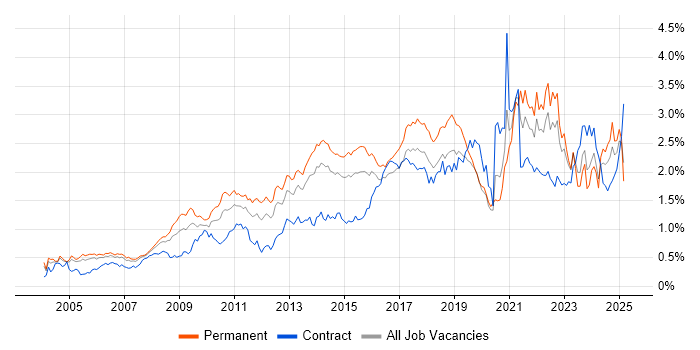
Job vacancy trend for Time Management in the Thames Valley

Time Management
Salary Trend in the Thames Valley

3-month moving average salary quoted in jobs citing Time Management in the Thames Valley.

Salary trend for Time Management in the Thames Valley

Time Management
Salary Histogram in the Thames Valley

Salary distribution for jobs citing Time Management in the Thames Valley over the 6 months to 13 December 2024.

Salary histogram for Time Management in the Thames Valley

Time Management
Job Locations in the Thames Valley

The table below looks at the demand and provides a guide to the median salaries quoted in IT jobs citing Time Management within the Thames Valley region over the 6 months to 13 December 2024. The 'Rank Change' column provides an indication of the change in demand within each location based on the same 6 month period last year.

Location Rank Change
on Same Period
Last Year
Matching
Permanent
IT Job Ads
Median Salary
Past 6 Months
Median Salary
% Change
on Same Period
Last Year
Live
Jobs
Oxfordshire +26 41 £65,000 +28.08% 7
Berkshire +1 35 £31,750 -33.16% 18
Buckinghamshire -20 17 £62,500 -3.85% 8
Time Management
South East

Time Management
Co-occurring Skills and Capabilities in the Thames Valley by Category

The follow tables expand on the table above by listing co-occurrences grouped by category. The same employment type, locality and period is covered with up to 20 co-occurrences shown in each of the following categories:

Application Platforms
1 10 (10.75%) SharePoint
2 3 (3.23%) Microsoft Exchange
2 3 (3.23%) OpenStack
3 2 (2.15%) CMS
3 2 (2.15%) Kentico
Applications
1 22 (23.66%) Microsoft Office
2 8 (8.60%) Microsoft Excel
2 8 (8.60%) Microsoft PowerPoint
3 2 (2.15%) Adobe Creative Suite
3 2 (2.15%) Adobe Illustrator
3 2 (2.15%) InDesign
3 2 (2.15%) Photoshop
4 1 (1.08%) Acrobat
4 1 (1.08%) Adobe After Effects
4 1 (1.08%) Adobe Premiere
Business Applications
1 11 (11.83%) Shopify
2 6 (6.45%) Dynamics CRM
3 1 (1.08%) Salesforce CRM
Cloud Services
1 19 (20.43%) Google Ads
1 19 (20.43%) Google Analytics
1 19 (20.43%) Google Tag Manager
2 9 (9.68%) Microsoft 365
3 6 (6.45%) IaaS
3 6 (6.45%) PaaS
4 5 (5.38%) Azure
5 2 (2.15%) AWS
5 2 (2.15%) Basecamp
5 2 (2.15%) Kontent
6 1 (1.08%) Azure AKS
6 1 (1.08%) Azure DevOps
6 1 (1.08%) Datadog
6 1 (1.08%) GCP
6 1 (1.08%) Power Platform
6 1 (1.08%) SaaS
Communications & Networking
1 5 (5.38%) Firewall
2 2 (2.15%) iSCSI
2 2 (2.15%) NGFW
2 2 (2.15%) Remote Desktop
2 2 (2.15%) SAN
3 1 (1.08%) Cisco Firepower
3 1 (1.08%) DNS
3 1 (1.08%) SD-WAN
3 1 (1.08%) TCP/IP
3 1 (1.08%) VLAN
3 1 (1.08%) VoIP
3 1 (1.08%) VPN
3 1 (1.08%) WAN
Database & Business Intelligence
1 2 (2.15%) MySQL
1 2 (2.15%) PostgreSQL
1 2 (2.15%) SQL Server
2 1 (1.08%) Power BI
Development Applications
1 2 (2.15%) JIRA
1 2 (2.15%) Visual Studio Code
General
1 45 (48.39%) Social Skills
2 33 (35.48%) Analytical Skills
3 28 (30.11%) Marketing
3 28 (30.11%) Retail
4 16 (17.20%) Organisational Skills
5 12 (12.90%) Presentation Skills
6 10 (10.75%) Telecoms
7 7 (7.53%) Public Sector
8 6 (6.45%) Automotive
8 6 (6.45%) Legal
9 5 (5.38%) Inclusion and Diversity
10 4 (4.30%) Finance
11 2 (2.15%) French Language
11 2 (2.15%) Games
11 2 (2.15%) German Language
11 2 (2.15%) Italian Language
11 2 (2.15%) Manufacturing
11 2 (2.15%) Police
11 2 (2.15%) Spanish Language
11 2 (2.15%) Turkish Language
Job Titles
1 19 (20.43%) PPC Executive
2 10 (10.75%) Architect
2 10 (10.75%) Junior
2 10 (10.75%) Support Engineer
3 9 (9.68%) Infrastructure Manager
3 9 (9.68%) Technical Engineer
3 9 (9.68%) Technical Support
3 9 (9.68%) Technical Support Engineer
4 6 (6.45%) IT Sales Executive
4 6 (6.45%) Project Engineer
4 6 (6.45%) Sales Executive
5 4 (4.30%) Azure Architect
5 4 (4.30%) Product Manager
5 4 (4.30%) Product Owner
5 4 (4.30%) Senior
5 4 (4.30%) Technical Architect
5 4 (4.30%) Virtualisation Architect
5 4 (4.30%) Virtualisation Technical Architect
6 3 (3.23%) Build Manager
6 3 (3.23%) IT Support
Libraries, Frameworks & Software Standards
1 3 (3.23%) HTML
1 3 (3.23%) OpenACC
1 3 (3.23%) OpenMP
2 2 (2.15%) .NET
Miscellaneous
1 15 (16.13%) Self-Motivation
2 8 (8.60%) Social Media
3 6 (6.45%) Data Centre
4 5 (5.38%) Driving Licence
4 5 (5.38%) Hybrid Cloud
5 4 (4.30%) Cyber Threat
5 4 (4.30%) Management Information System
5 4 (4.30%) Product Ownership
6 3 (3.23%) Algorithms
6 3 (3.23%) CUDA
7 2 (2.15%) 3D Printing
7 2 (2.15%) CCTV
7 2 (2.15%) Cloud Native
7 2 (2.15%) Cyberattack
8 1 (1.08%) Cyber Security Posture
8 1 (1.08%) Digital Media
8 1 (1.08%) Embedded Systems
8 1 (1.08%) Motion Graphics
8 1 (1.08%) Onboarding
Operating Systems
1 13 (13.98%) Windows
2 5 (5.38%) Linux
2 5 (5.38%) Red Hat Enterprise Linux
3 3 (3.23%) SUSE Linux Enterprise Server
3 3 (3.23%) Ubuntu
3 3 (3.23%) Windows 10
3 3 (3.23%) Windows Server
3 3 (3.23%) Windows Server 2019
4 1 (1.08%) Mac OS
4 1 (1.08%) Windows 7
4 1 (1.08%) Windows 8
4 1 (1.08%) Windows Server 2012
4 1 (1.08%) Windows Server 2016
Processes & Methodologies
1 40 (43.01%) Problem-Solving
2 21 (22.58%) Data Privacy
2 21 (22.58%) Digital Marketing
3 20 (21.51%) Analytics
4 19 (20.43%) Commercial Awareness
4 19 (20.43%) Marketing Strategy
4 19 (20.43%) Pay per click
5 18 (19.35%) CRM
6 16 (17.20%) ITIL
7 13 (13.98%) Decision-Making
8 12 (12.90%) Continuous Improvement
8 12 (12.90%) Cybersecurity
8 12 (12.90%) Presales
9 11 (11.83%) People Management
10 9 (9.68%) PRINCE2
10 9 (9.68%) Risk Management
11 8 (8.60%) Copywriting
11 8 (8.60%) Disaster Recovery
11 8 (8.60%) ERP
11 8 (8.60%) Information Security
Programming Languages
1 3 (3.23%) C
1 3 (3.23%) C++
1 3 (3.23%) C-shell
1 3 (3.23%) Fortran
1 3 (3.23%) Python
2 2 (2.15%) Bash
2 2 (2.15%) JavaScript
2 2 (2.15%) Korn
3 1 (1.08%) Bicep
Qualifications
1 15 (16.13%) Degree
2 5 (5.38%) Security Cleared
3 4 (4.30%) DBS Check
3 4 (4.30%) TOGAF Certification
4 3 (3.23%) BPSS Clearance
4 3 (3.23%) SC Cleared
5 1 (1.08%) CCNA
5 1 (1.08%) CCNP
5 1 (1.08%) CEH
5 1 (1.08%) Cisco Certification
5 1 (1.08%) CISM
5 1 (1.08%) CISSP
5 1 (1.08%) PRINCE2 Certification
5 1 (1.08%) SSCP
Quality Assurance & Compliance
1 9 (9.68%) SLA
2 4 (4.30%) QA
3 3 (3.23%) ISO/IEC 27001
4 2 (2.15%) NIST
5 1 (1.08%) Actionable Recommendations
5 1 (1.08%) Cyber Essentials
5 1 (1.08%) GDPR
5 1 (1.08%) ISO/IEC 20000
5 1 (1.08%) NCSC
System Software
1 7 (7.53%) Active Directory
2 6 (6.45%) Docker
3 3 (3.23%) Ceph
3 3 (3.23%) GPFS
3 3 (3.23%) Lustre
3 3 (3.23%) Slurm Workload Manager
4 2 (2.15%) Citrix Hypervisor
5 1 (1.08%) Hyper-V
5 1 (1.08%) Virtual Desktop
Systems Management
1 5 (5.38%) Kubernetes
2 3 (3.23%) Podman
3 1 (1.08%) Grafana
3 1 (1.08%) SCCM
3 1 (1.08%) Stealthwatch
3 1 (1.08%) Terraform
Vendors
1 57 (61.29%) Microsoft
2 20 (21.51%) Google
3 11 (11.83%) Pinterest
3 11 (11.83%) TikTok
4 9 (9.68%) Dell
5 8 (8.60%) Adobe
5 8 (8.60%) Salesforce
6 6 (6.45%) Apple
7 5 (5.38%) NetApp
8 3 (3.23%) Arqiva
8 3 (3.23%) Remedy
9 2 (2.15%) HP
9 2 (2.15%) Palo Alto
9 2 (2.15%) Rapid7
9 2 (2.15%) Red Hat
9 2 (2.15%) Splunk
10 1 (1.08%) Cisco
10 1 (1.08%) Meraki
10 1 (1.08%) SAP
10 1 (1.08%) ServiceNow