Service Delivery Jobs in the Thames Valley

Service Delivery
South East > Thames Valley

The following table provides summary statistics for permanent job vacancies advertised in the Thames Valley with a requirement for Service Delivery skills. Included is a benchmarking guide to the salaries offered in vacancies that have cited Service Delivery over the 6 months to 10 May 2024 with a comparison to the same period in the previous 2 years.

6 months to
10 May 2024
Same period 2023 Same period 2022
Rank 63 93 118
Rank change year-on-year +30 +25 -10
Permanent jobs citing Service Delivery 248 204 182
As % of all permanent jobs advertised in the Thames Valley 3.69% 3.41% 2.62%
As % of the Processes & Methodologies category 4.35% 3.61% 2.82%
Number of salaries quoted 181 162 115
10th Percentile £30,000 £28,000 £27,300
25th Percentile £34,500 £31,250 £36,125
Median annual salary (50th Percentile) £50,500 £42,500 £47,500
Median % change year-on-year +18.82% -10.53% +8.57%
75th Percentile £57,500 £55,438 £58,125
90th Percentile £63,750 £67,500 £68,750
South East median annual salary £49,000 £45,000 £50,000
% change year-on-year +8.89% -10.00% +5.26%

All Process and Methodology Skills
Thames Valley

Service Delivery is in the Processes and Methodologies category. The following table is for comparison with the above and provides summary statistics for all permanent job vacancies advertised in the Thames Valley with a requirement for process or methodology skills.

Permanent vacancies with a requirement for process or methodology skills 5,701 5,658 6,443
As % of all permanent jobs advertised in the Thames Valley 84.81% 94.69% 92.77%
Number of salaries quoted 3,924 3,080 3,875
10th Percentile £29,000 £29,750 £31,250
25th Percentile £37,500 £40,000 £41,939
Median annual salary (50th Percentile) £50,000 £55,000 £55,000
Median % change year-on-year -9.09% - -
75th Percentile £65,000 £72,500 £71,290
90th Percentile £80,000 £87,500 £82,500
South East median annual salary £50,000 £55,000 £55,000
% change year-on-year -9.09% - +10.00%

Service Delivery
Job Vacancy Trend in the Thames Valley

Job postings citing Service Delivery as a proportion of all IT jobs advertised in the Thames Valley.
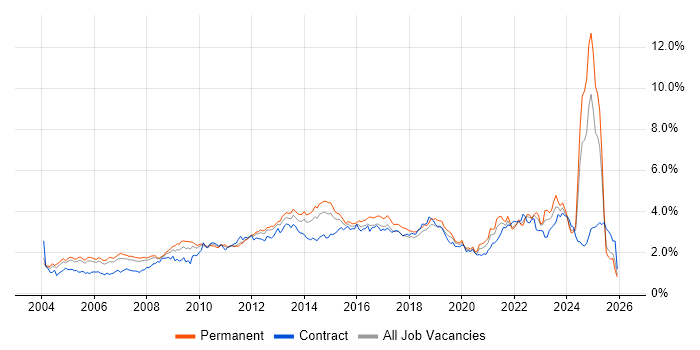
Job vacancy trend for Service Delivery in the Thames Valley

Service Delivery
Salary Trend in the Thames Valley

3-month moving average salary quoted in jobs citing Service Delivery in the Thames Valley.

Salary trend for Service Delivery in the Thames Valley

Service Delivery
Salary Histogram in the Thames Valley

Salary distribution for jobs citing Service Delivery in the Thames Valley over the 6 months to 10 May 2024.

Salary histogram for Service Delivery in the Thames Valley

Service Delivery
Job Locations in the Thames Valley

The table below looks at the demand and provides a guide to the median salaries quoted in IT jobs citing Service Delivery within the Thames Valley region over the 6 months to 10 May 2024. The 'Rank Change' column provides an indication of the change in demand within each location based on the same 6 month period last year.

Location Rank Change
on Same Period
Last Year
Matching
Permanent
IT Job Ads
Median Salary
Past 6 Months
Median Salary
% Change
on Same Period
Last Year
Live
Jobs
Berkshire +17 97 £52,500 +15.13% 34
Buckinghamshire +19 95 £55,000 +46.67% 14
Oxfordshire +22 56 £42,500 +2.41% 13
Service Delivery
South East

Service Delivery
Co-occurring Skills and Capabilities in the Thames Valley by Category

The follow tables expand on the table above by listing co-occurrences grouped by category. The same employment type, locality and period is covered with up to 20 co-occurrences shown in each of the following categories:

Application Platforms
1 11 (4.44%) Microsoft Exchange
1 11 (4.44%) SharePoint
2 2 (0.81%) Confluence
2 2 (0.81%) Exchange Server 2013
Applications
1 37 (14.92%) Microsoft Office
2 32 (12.90%) Microsoft Excel
3 12 (4.84%) Microsoft PowerPoint
4 1 (0.40%) Solid Edge
Business Applications
1 6 (2.42%) Dynamics CRM
2 5 (2.02%) Dynamics GP
Cloud Services
1 35 (14.11%) Microsoft 365
2 33 (13.31%) Azure
3 16 (6.45%) Azure DevOps
4 11 (4.44%) AWS
5 9 (3.63%) OneDrive
5 9 (3.63%) Power Platform
6 7 (2.82%) Entra ID
7 5 (2.02%) Dynamics 365
7 5 (2.02%) SuccessFactors
8 4 (1.61%) Amazon EC2
8 4 (1.61%) Amazon S3
9 2 (0.81%) Google Docs
10 1 (0.40%) Cloud Computing
10 1 (0.40%) SaaS
Communications & Networking
1 10 (4.03%) LAN
2 7 (2.82%) VPN
3 6 (2.42%) Unified Communications
4 4 (1.61%) DHCP
4 4 (1.61%) DNS
4 4 (1.61%) Firewall
4 4 (1.61%) WAN
5 3 (1.21%) Internet
5 3 (1.21%) VLAN
5 3 (1.21%) Wi-Fi
6 2 (0.81%) TCP/IP
6 2 (0.81%) VoIP
7 1 (0.40%) 5G
7 1 (0.40%) LTE
7 1 (0.40%) Radio Access Network
7 1 (0.40%) Structured Cabling
7 1 (0.40%) Wireless
Database & Business Intelligence
1 25 (10.08%) Relational Database
2 14 (5.65%) SQL Server
3 9 (3.63%) Power BI
4 6 (2.42%) Amazon RDS
5 1 (0.40%) GIS
5 1 (0.40%) MySQL
5 1 (0.40%) RDBMS
Development Applications
1 2 (0.81%) Bitbucket
1 2 (0.81%) GitLab
1 2 (0.81%) JIRA
2 1 (0.40%) MSI
General
1 83 (33.47%) Social Skills
2 61 (24.60%) Finance
3 23 (9.27%) Inclusion and Diversity
3 23 (9.27%) Public Sector
4 19 (7.66%) Analytical Skills
5 18 (7.26%) Organisational Skills
6 16 (6.45%) Legal
6 16 (6.45%) Telecoms
7 15 (6.05%) Marketing
8 12 (4.84%) Retail
9 10 (4.03%) Presentation Skills
10 9 (3.63%) Manufacturing
11 8 (3.23%) Automotive
12 6 (2.42%) Banking
12 6 (2.42%) Documentation Skills
12 6 (2.42%) Influencing Skills
12 6 (2.42%) Investment Banking
12 6 (2.42%) Private Banking
13 4 (1.61%) Law
13 4 (1.61%) Pharmaceutical
Job Titles
1 34 (13.71%) Developer
2 28 (11.29%) Service Delivery Manager
3 27 (10.89%) Delivery Manager
3 27 (10.89%) Service Manager
4 22 (8.87%) Support Engineer
5 21 (8.47%) IT Manager
6 20 (8.06%) IT Support
7 19 (7.66%) COBOL Developer
7 19 (7.66%) Mainframe Developer
8 18 (7.26%) Administrator
9 17 (6.85%) Analyst
10 15 (6.05%) HTML CSS Developer
10 15 (6.05%) HTML Developer
10 15 (6.05%) JavaScript Developer
11 14 (5.65%) Coordinator
11 14 (5.65%) Lead
12 13 (5.24%) Applications Support
12 13 (5.24%) Support Analyst
13 12 (4.84%) Applications Support Analyst
14 11 (4.44%) Desktop Engineer
Libraries, Frameworks & Software Standards
1 16 (6.45%) CSS
1 16 (6.45%) HTML
2 15 (6.05%) .NET
3 7 (2.82%) .NET Framework
3 7 (2.82%) ASP.NET
4 6 (2.42%) EDI
4 6 (2.42%) Middleware
5 2 (0.81%) RESTful
6 1 (0.40%) Leaflet
Miscellaneous
1 19 (7.66%) Mainframe
2 16 (6.45%) Driving Licence
3 14 (5.65%) Self-Motivation
4 12 (4.84%) Data Centre
5 11 (4.44%) Management Information System
6 8 (3.23%) Smartphone
7 6 (2.42%) Onboarding
8 5 (2.02%) IBM Mainframe
9 4 (1.61%) EPoS
9 4 (1.61%) Public Cloud
9 4 (1.61%) Social Media
10 2 (0.81%) Cyber Threat
10 2 (0.81%) Grid Computing
11 1 (0.40%) CCTV
11 1 (0.40%) FMCG
11 1 (0.40%) IoT
11 1 (0.40%) Low-Code
11 1 (0.40%) Molecular Biology
11 1 (0.40%) Virtual Team
Operating Systems
1 39 (15.73%) Windows
2 20 (8.06%) Windows 10
3 10 (4.03%) Linux
4 9 (3.63%) Windows 7
4 9 (3.63%) Windows Server
5 8 (3.23%) Android
5 8 (3.23%) Apple iOS
6 3 (1.21%) Mac OS
6 3 (1.21%) Unix
7 2 (0.81%) Windows 8
8 1 (0.40%) Windows XP
Processes & Methodologies
1 115 (46.37%) ITIL
2 58 (23.39%) Customer Service
3 47 (18.95%) Problem-Solving
4 39 (15.73%) ITSM
5 37 (14.92%) Service Management
6 33 (13.31%) Agile
7 23 (9.27%) DevOps
7 23 (9.27%) Stakeholder Management
8 22 (8.87%) Continuous Improvement
8 22 (8.87%) Cybersecurity
8 22 (8.87%) Service Catalogue
9 17 (6.85%) Project Management
10 16 (6.45%) Customer Experience
10 16 (6.45%) Customer Requirements
10 16 (6.45%) MVC
10 16 (6.45%) Web Development
11 14 (5.65%) Actionable Insight
12 12 (4.84%) IT Strategy
12 12 (4.84%) Time Management
12 12 (4.84%) Waterfall
Programming Languages
1 19 (7.66%) COBOL
2 18 (7.26%) JavaScript
3 14 (5.65%) SQL
4 9 (3.63%) C#
5 1 (0.40%) PowerShell
5 1 (0.40%) T-SQL
5 1 (0.40%) VBScript
Qualifications
1 66 (26.61%) Security Cleared
2 54 (21.77%) Degree
3 35 (14.11%) CTC Cleared
4 20 (8.06%) SC Cleared
5 13 (5.24%) DV Cleared
6 12 (4.84%) ITIL Foundation Certificate
7 10 (4.03%) DBS Check
8 5 (2.02%) CCNA
8 5 (2.02%) Cisco Certification
8 5 (2.02%) Microsoft Certification
9 4 (1.61%) AWS Certification
9 4 (1.61%) AWS Certified Solutions Architect
9 4 (1.61%) Azure Certification
10 3 (1.21%) A+ Certification
10 3 (1.21%) PRINCE2 Certification
11 2 (0.81%) CCENT
11 2 (0.81%) HNC
11 2 (0.81%) MCP
11 2 (0.81%) Network+ Certification
11 2 (0.81%) Server+ Certification
Quality Assurance & Compliance
1 38 (15.32%) SLA
2 13 (5.24%) QA
3 9 (3.63%) Accessibility
4 7 (2.82%) Cyber Essentials
4 7 (2.82%) ISO/IEC 27001
5 4 (1.61%) Data Quality
6 3 (1.21%) GDPR
7 1 (0.40%) NEBOSH
System Software
1 13 (5.24%) Active Directory
2 9 (3.63%) Firmware
3 8 (3.23%) Hyper-V
4 2 (0.81%) VMware Infrastructure
5 1 (0.40%) Virtual Desktop
Systems Management
1 11 (4.44%) SCCM
2 3 (1.21%) Microsoft Intune
Vendors
1 66 (26.61%) Microsoft
2 22 (8.87%) ServiceNow
3 19 (7.66%) Unisys
4 13 (5.24%) Oracle
5 11 (4.44%) SAP
6 9 (3.63%) HP
7 8 (3.23%) Salesforce
8 6 (2.42%) Apple
8 6 (2.42%) Citrix
9 5 (2.02%) Cisco
9 5 (2.02%) IBM
10 4 (1.61%) Adobe
10 4 (1.61%) BT
10 4 (1.61%) OpenText
10 4 (1.61%) VMware
11 3 (1.21%) Atlassian
11 3 (1.21%) Dell
11 3 (1.21%) Sun
12 2 (0.81%) Cadence
12 2 (0.81%) Google