Threat Analysis Jobs in the UK excluding London

Threat Analysis
UK > UK excluding London

The following table provides summary statistics for permanent job vacancies advertised in the UK excluding London with a requirement for Threat Analysis skills. Included is a benchmarking guide to the salaries offered in vacancies that have cited Threat Analysis over the 6 months to 25 May 2024 with a comparison to the same period in the previous 2 years.

6 months to
25 May 2024
Same period 2023 Same period 2022
Rank 706 413 836
Rank change year-on-year -293 +423 -138
Permanent jobs citing Threat Analysis 47 394 25
As % of all permanent jobs advertised in the UK excluding London 0.064% 0.68% 0.034%
As % of the Processes & Methodologies category 0.078% 0.71% 0.036%
Number of salaries quoted 25 48 14
10th Percentile - - -
25th Percentile £41,250 £32,500 £35,068
Median annual salary (50th Percentile) £50,000 £40,000 £45,085
Median % change year-on-year +25.00% -11.28% -30.64%
75th Percentile - £55,813 £65,000
90th Percentile £62,210 £72,650 £75,625
UK median annual salary £52,500 £47,500 £52,500
% change year-on-year +10.53% -9.52% -19.23%

All Process and Methodology Skills
UK excluding London

Threat Analysis is in the Processes and Methodologies category. The following table is for comparison with the above and provides summary statistics for all permanent job vacancies advertised in the UK excluding London with a requirement for process or methodology skills.

Permanent vacancies with a requirement for process or methodology skills 60,593 55,780 68,661
As % of all permanent jobs advertised in the UK excluding London 82.77% 95.57% 94.24%
Number of salaries quoted 41,777 28,809 41,151
10th Percentile £27,300 £30,500 £30,000
25th Percentile £36,250 £40,000 £38,750
Median annual salary (50th Percentile) £50,000 £55,000 £52,500
Median % change year-on-year -9.09% +4.76% +9.38%
75th Percentile £65,000 £70,000 £67,500
90th Percentile £77,500 £82,500 £80,000
UK median annual salary £55,000 £61,000 £60,000
% change year-on-year -9.84% +1.67% +9.09%

Threat Analysis
Job Vacancy Trend in the UK excluding London

Job postings citing Threat Analysis as a proportion of all IT jobs advertised in the UK excluding London.
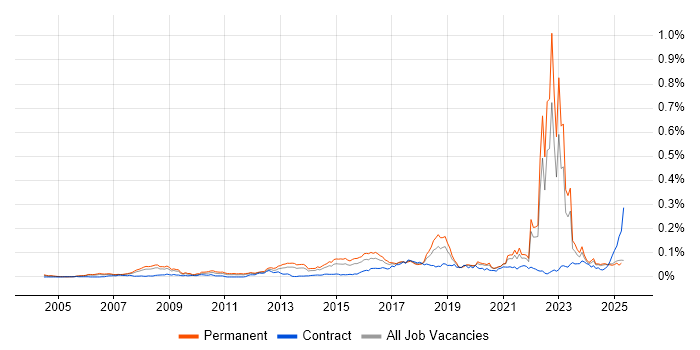
Job vacancy trend for Threat Analysis in the UK excluding London

Threat Analysis
Salary Trend in the UK excluding London

3-month moving average salary quoted in jobs citing Threat Analysis in the UK excluding London.

Salary trend for Threat Analysis in the UK excluding London

Threat Analysis
Salary Histogram in the UK excluding London

Salary distribution for jobs citing Threat Analysis in the UK excluding London over the 6 months to 25 May 2024.

Salary histogram for Threat Analysis in the UK excluding London

Threat Analysis
Job Locations in the UK excluding London

The table below looks at the demand and provides a guide to the median salaries quoted in IT jobs citing Threat Analysis within the UK excluding London region over the 6 months to 25 May 2024. The 'Rank Change' column provides an indication of the change in demand within each location based on the same 6 month period last year.

Location Rank Change
on Same Period
Last Year
Matching
Permanent
IT Job Ads
Median Salary
Past 6 Months
Median Salary
% Change
on Same Period
Last Year
Live
Jobs
Northern Ireland - 16 - - 1
North of England -146 12 £42,500 +6.25% 1
North East -3 8 £42,500 +6.75%
Midlands -91 7 £50,000 -9.09% 1
Scotland -79 6 £45,000 -
South West -30 5 £50,000 - 1
East Midlands -29 4 £50,000 +5.26% 1
West Midlands -64 3 - -
North West -132 3 £35,000 -41.67% 1
Yorkshire +23 1 £62,500 +78.57%
South East -16 1 £55,000 -2.22% 1
Threat Analysis
UK

Threat Analysis
Co-occurring Skills and Capabilities in the UK excluding London by Category

The follow tables expand on the table above by listing co-occurrences grouped by category. The same employment type, locality and period is covered with up to 20 co-occurrences shown in each of the following categories:

Application Platforms
1 6 (12.77%) IIS
Applications
1 2 (4.26%) Microsoft Excel
Cloud Services
1 14 (29.79%) AWS
2 13 (27.66%) Azure
3 11 (23.40%) Cloud Computing
4 5 (10.64%) SaaS
5 2 (4.26%) Microsoft 365
5 2 (4.26%) Power Platform
Communications & Networking
1 15 (31.91%) Firewall
2 14 (29.79%) TCP/IP
3 9 (19.15%) HTTP
3 9 (19.15%) MQTT
4 8 (17.02%) Wi-Fi
5 4 (8.51%) BGP
5 4 (8.51%) DNS
5 4 (8.51%) SAN
6 2 (4.26%) LAN
6 2 (4.26%) Unified Communications
6 2 (4.26%) WLAN
7 1 (2.13%) 802.11
7 1 (2.13%) Bluetooth
7 1 (2.13%) Intrusion Detection
7 1 (2.13%) ZigBee
Database & Business Intelligence
1 9 (19.15%) NoSQL
2 4 (8.51%) Elasticsearch
2 4 (8.51%) PostgreSQL
2 4 (8.51%) Redis
2 4 (8.51%) SQL Server
3 2 (4.26%) Power BI
3 2 (4.26%) Tableau
Development Applications
1 5 (10.64%) Rational DOORS
General
1 20 (42.55%) Social Skills
2 8 (17.02%) Public Sector
3 3 (6.38%) Analytical Skills
3 3 (6.38%) Manufacturing
4 2 (4.26%) Electronics
4 2 (4.26%) Law
5 1 (2.13%) Automotive
5 1 (2.13%) Cyber-Physical System
5 1 (2.13%) Military
5 1 (2.13%) Organisational Skills
Job Titles
1 12 (25.53%) Senior
2 9 (19.15%) Architect
2 9 (19.15%) Software Architect
3 8 (17.02%) Analyst
3 8 (17.02%) Network Specialist
3 8 (17.02%) Security Analyst
3 8 (17.02%) Senior Software Engineer
3 8 (17.02%) Software Engineer
4 5 (10.64%) Lead
5 3 (6.38%) Principal Engineer
5 3 (6.38%) Principal Software Engineer
5 3 (6.38%) Senior Windows Engineer
5 3 (6.38%) Windows Engineer
6 2 (4.26%) Consultant
6 2 (4.26%) Cybersecurity Analyst
6 2 (4.26%) Head of IT
7 1 (2.13%) Compliance Analyst
7 1 (2.13%) Cybersecurity Consultant
7 1 (2.13%) IT Security Manager
7 1 (2.13%) Security Compliance Analyst
Libraries, Frameworks & Software Standards
1 14 (29.79%) Web Services
2 9 (19.15%) AngularJS
2 9 (19.15%) Kafka
2 9 (19.15%) Node.js
2 9 (19.15%) RabbitMQ
2 9 (19.15%) RESTful
3 5 (10.64%) FFmpeg
3 5 (10.64%) GStreamer
3 5 (10.64%) OpenCV
3 5 (10.64%) REST
4 4 (8.51%) .NET
4 4 (8.51%) .NET Core
5 1 (2.13%) 802.1X
Miscellaneous
1 10 (21.28%) IoT
2 5 (10.64%) Management Information System
2 5 (10.64%) Video\Live Streaming
3 4 (8.51%) Clustering
3 4 (8.51%) PKI
3 4 (8.51%) Public Cloud
4 3 (6.38%) Cloud Native
4 3 (6.38%) Self-Motivation
4 3 (6.38%) Virtual Team
5 2 (4.26%) Hybrid Cloud
5 2 (4.26%) Onboarding
5 2 (4.26%) Operational Technology
5 2 (4.26%) Security Posture
6 1 (2.13%) CAN bus
6 1 (2.13%) CESG
6 1 (2.13%) Cyber Defence
6 1 (2.13%) Cyber Threat
6 1 (2.13%) Cyberattack
6 1 (2.13%) SCADA
Operating Systems
1 12 (25.53%) Linux
2 7 (14.89%) Windows
3 5 (10.64%) Embedded Linux
4 4 (8.51%) Windows Server
5 3 (6.38%) Mac OS
Processes & Methodologies
1 24 (51.06%) Cybersecurity
2 19 (40.43%) Analytics
2 19 (40.43%) Computer Science
3 17 (36.17%) Software Engineering
4 15 (31.91%) Artificial Intelligence
5 14 (29.79%) Computer Vision
5 14 (29.79%) Deep Learning
6 9 (19.15%) Customer Requirements
6 9 (19.15%) Data Analytics
6 9 (19.15%) Microservices
6 9 (19.15%) Product Management
7 8 (17.02%) Information Security
7 8 (17.02%) Multithreading
7 8 (17.02%) Network Architecture
7 8 (17.02%) User Experience
8 7 (14.89%) Kalman Filter
9 6 (12.77%) ITIL
9 6 (12.77%) Open Source
10 5 (10.64%) SIEM
10 5 (10.64%) Video Analytics
Programming Languages
1 15 (31.91%) Python
2 11 (23.40%) SQL
3 6 (12.77%) Bash
4 5 (10.64%) PowerShell
5 1 (2.13%) C++
Qualifications
1 20 (42.55%) Degree
2 14 (29.79%) Master's Degree
2 14 (29.79%) PhD
3 7 (14.89%) Security Cleared
4 6 (12.77%) DV Cleared
5 5 (10.64%) BPSS Clearance
6 3 (6.38%) CEH
6 3 (6.38%) CISM
6 3 (6.38%) CISSP
6 3 (6.38%) Computer Science Degree
6 3 (6.38%) GIAC
7 2 (4.26%) CISA
7 2 (4.26%) CRISC
8 1 (2.13%) CESG Certified Professional
8 1 (2.13%) CompTIA CySA+
8 1 (2.13%) ECSA
8 1 (2.13%) GCIA
8 1 (2.13%) GCIH
8 1 (2.13%) GPEN
8 1 (2.13%) GREM
Quality Assurance & Compliance
1 15 (31.91%) QA
2 5 (10.64%) ISO/IEC 27001
3 2 (4.26%) PCI DSS
4 1 (2.13%) Actionable Recommendations
4 1 (2.13%) Cyber Essentials
4 1 (2.13%) Cyber Essentials PLUS
4 1 (2.13%) ISO/IEC 27005
4 1 (2.13%) NCSC
4 1 (2.13%) NIST
4 1 (2.13%) SOC 2
System Software
1 6 (12.77%) Active Directory
1 6 (12.77%) VMware Infrastructure
2 5 (10.64%) Docker
2 5 (10.64%) Firmware
3 4 (8.51%) VMware Server
Systems Management
1 5 (10.64%) Kubernetes
2 4 (8.51%) SCOM
2 4 (8.51%) SCOrch
2 4 (8.51%) vMotion
Vendors
1 14 (29.79%) VMware
2 10 (21.28%) Cisco
3 9 (19.15%) Google
3 9 (19.15%) Microsoft
4 8 (17.02%) Aruba
4 8 (17.02%) Palo Alto
5 4 (8.51%) Splunk
6 3 (6.38%) Dell
7 2 (4.26%) Fortinet
7 2 (4.26%) Meraki