Relational Database Jobs in the UK excluding London

Relational Database
UK > UK excluding London

The table below provides summary statistics for permanent job vacancies advertised in the UK excluding London requiring Relational Database skills. It includes a benchmarking guide to the annual salaries offered in vacancies that cited Relational Database over the 6 months leading up to 16 July 2025, comparing them to the same period in the previous two years.

6 months to
16 Jul 2025
Same period 2024 Same period 2023
Rank 284 218 212
Rank change year-on-year -66 -6 -61
Permanent jobs citing Relational Database 365 910 820
As % of all permanent jobs advertised in the UK excluding London 0.85% 1.21% 1.62%
As % of the Database & Business Intelligence category 7.80% 8.08% 8.26%
Number of salaries quoted 171 527 571
10th Percentile £36,250 £33,694 £35,000
25th Percentile £43,750 £42,500 £44,250
Median annual salary (50th Percentile) £56,500 £55,000 £52,700
Median % change year-on-year +2.73% +4.36% +0.38%
75th Percentile £71,875 £68,750 £72,500
90th Percentile £79,000 £83,759 £80,000
UK median annual salary £65,000 £57,500 £65,000
% change year-on-year +13.04% -11.54% +8.33%

All Database and Business Intelligence Skills
UK excluding London

Relational Database falls under the Databases and Business Intelligence category. For comparison with the information above, the following table provides summary statistics for all permanent job vacancies requiring database or business intelligence skills in the UK excluding London.

Permanent vacancies with a requirement for database or business intelligence skills 4,680 11,258 9,928
As % of all permanent jobs advertised in the UK excluding London 10.83% 14.99% 19.57%
Number of salaries quoted 2,915 7,248 6,491
10th Percentile £31,250 £32,500 £33,750
25th Percentile £41,250 £41,000 £42,000
Median annual salary (50th Percentile) £55,000 £52,500 £55,000
Median % change year-on-year +4.76% -4.55% +4.76%
75th Percentile £69,840 £65,000 £70,000
90th Percentile £82,400 £80,000 £80,000
UK median annual salary £60,000 £57,500 £62,500
% change year-on-year +4.35% -8.00% +4.17%

Relational Database
Job Vacancy Trend in the UK excluding London

Job postings citing Relational Database as a proportion of all IT jobs advertised in the UK excluding London.
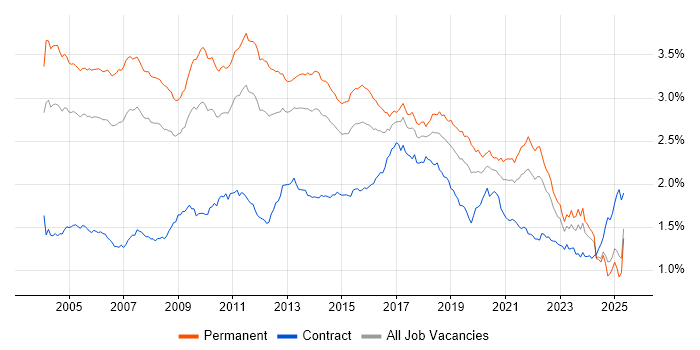
Job vacancy trend for Relational Database in the UK excluding London

Relational Database
Salary Trend in the UK excluding London

3-month moving average salary quoted in jobs citing Relational Database in the UK excluding London.

Salary trend for Relational Database in the UK excluding London

Relational Database
Salary Histogram in the UK excluding London

Salary distribution for jobs citing Relational Database in the UK excluding London over the 6 months to 16 July 2025.

Salary histogram for Relational Database in the UK excluding London

Relational Database
Job Locations in the UK excluding London

The table below looks at the demand and provides a guide to the median salaries quoted in IT jobs citing Relational Database within the UK excluding London region over the 6 months to 16 July 2025. The 'Rank Change' column provides an indication of the change in demand within each location based on the same 6 month period last year.

Location Rank Change
on Same Period
Last Year
Matching
Permanent
IT Job Ads
Median Salary
Past 6 Months
Median Salary
% Change
on Same Period
Last Year
Live
Jobs
South East -37 103 £55,000 - 143
North of England -79 72 £52,500 -4.55% 57
East of England +41 51 £62,000 +27.84% 20
Midlands +11 51 £46,250 -15.91% 39
North West -89 44 £52,500 -4.55% 37
South West +40 39 £47,500 -5.00% 42
Scotland +13 35 £72,500 +45.00% 33
West Midlands +21 34 £60,000 +9.09% 23
Yorkshire +4 21 £70,000 +27.27% 13
East Midlands +28 17 £37,500 -23.86% 14
Wales +13 15 £77,500 +82.35% 13
North East +39 7 £51,875 -33.60% 7
Northern Ireland +26 1 £28,000 -19.14% 9
Relational Database
UK

Relational Database
Co-occurring Skills and Capabilities in the UK excluding London by Category

The follow tables expand on the table above by listing co-occurrences grouped by category. The same employment type, locality and period is covered with up to 20 co-occurrences shown in each of the following categories:

Application Platforms
1 30 (8.22%) Confluence
2 10 (2.74%) Apache
2 10 (2.74%) JBoss
2 10 (2.74%) Red Hat Fuse
3 8 (2.19%) Apache Airflow
4 6 (1.64%) IIS
5 5 (1.37%) Apache Spark
5 5 (1.37%) OpenStack
6 4 (1.10%) GemFire
6 4 (1.10%) SharePoint
7 3 (0.82%) CMS
8 1 (0.27%) ColdFusion
8 1 (0.27%) Headless CMS
8 1 (0.27%) Luigi
8 1 (0.27%) Microsoft Exchange
8 1 (0.27%) OpenEdge
8 1 (0.27%) Oracle Application Server
8 1 (0.27%) Umbraco
8 1 (0.27%) WebLogic
8 1 (0.27%) WordPress
Applications
1 5 (1.37%) Microsoft Excel
2 4 (1.10%) Microsoft Office
3 1 (0.27%) Trello
Business Applications
1 2 (0.55%) Dynamics CRM
2 1 (0.27%) NetSuite
2 1 (0.27%) SAP Business One
Cloud Services
1 164 (44.93%) AWS
2 86 (23.56%) Azure
3 65 (17.81%) Pulumi
4 48 (13.15%) Serverless
5 41 (11.23%) Amazon ECS
6 38 (10.41%) Amazon EKS
7 28 (7.67%) Power Platform
8 25 (6.85%) Azure DevOps
9 23 (6.30%) Amazon EC2
10 20 (5.48%) GitHub
11 14 (3.84%) Amazon S3
12 12 (3.29%) SaaS
13 11 (3.01%) AWS Lambda
13 11 (3.01%) Snowflake
14 10 (2.74%) GCP
14 10 (2.74%) Microsoft 365
15 7 (1.92%) Boomi
16 6 (1.64%) Azure Data Factory
16 6 (1.64%) Cloud Computing
17 5 (1.37%) Dynamics 365
Communications & Networking
1 65 (17.81%) Broadband
2 18 (4.93%) Network Security
3 17 (4.66%) Firewall
4 15 (4.11%) TCP/IP
5 11 (3.01%) Internet
6 10 (2.74%) HTTP
7 9 (2.47%) FTP
7 9 (2.47%) SMTP
8 8 (2.19%) LAN
8 8 (2.19%) VPN
8 8 (2.19%) WAN
9 6 (1.64%) DNS
10 2 (0.55%) Modbus
10 2 (0.55%) MQTT
11 1 (0.27%) SAN
11 1 (0.27%) SSL
Database & Business Intelligence
1 168 (46.03%) RDBMS
2 95 (26.03%) NoSQL
3 82 (22.47%) PostgreSQL
4 74 (20.27%) SQL Server
5 57 (15.62%) MySQL
6 38 (10.41%) MongoDB
7 24 (6.58%) Power BI
8 20 (5.48%) Data Warehouse
9 14 (3.84%) Data Lake
9 14 (3.84%) SQL Server Integration Services
10 13 (3.56%) Oracle Database
11 11 (3.01%) Elasticsearch
12 10 (2.74%) Apache Cassandra
12 10 (2.74%) SQL Server Reporting Services
13 8 (2.19%) Amazon Redshift
13 8 (2.19%) Big Data
14 7 (1.92%) Amazon Aurora
15 6 (1.64%) DB2
15 6 (1.64%) Oracle Reports
16 5 (1.37%) Apache Hive
Development Applications
1 80 (21.92%) Git
2 65 (17.81%) Jaeger
3 49 (13.42%) Jenkins
4 34 (9.32%) JUnit
5 31 (8.49%) JIRA
6 19 (5.21%) JMeter
6 19 (5.21%) Mockito
7 18 (4.93%) Bitbucket
8 11 (3.01%) Selenium
9 10 (2.74%) GitLab
9 10 (2.74%) Postman
10 6 (1.64%) Visual Studio
11 5 (1.37%) Cucumber
11 5 (1.37%) SoapUI
12 4 (1.10%) Fiddler
12 4 (1.10%) TeamCity
13 3 (0.82%) IBM UrbanCode
13 3 (0.82%) SonarQube
13 3 (0.82%) Sonatype Nexus
13 3 (0.82%) SpecFlow
General
1 97 (26.58%) Social Skills
2 89 (24.38%) Inclusion and Diversity
3 57 (15.62%) Finance
4 44 (12.05%) Public Sector
5 41 (11.23%) Analytical Skills
6 30 (8.22%) Law
7 26 (7.12%) Banking
8 13 (3.56%) Manufacturing
9 9 (2.47%) Investment Banking
9 9 (2.47%) Pharmaceutical
10 8 (2.19%) Presentation Skills
11 7 (1.92%) Back Office
11 7 (1.92%) Marketing
11 7 (1.92%) Retail
12 5 (1.37%) Digital Healthcare
12 5 (1.37%) Local Government
12 5 (1.37%) Organisational Skills
13 4 (1.10%) Documentation Skills
13 4 (1.10%) Front Office
13 4 (1.10%) Private Banking
Job Titles
1 102 (27.95%) Developer
2 95 (26.03%) Lead
3 76 (20.82%) Team Leader
4 61 (16.71%) Software Engineer
5 49 (13.42%) Senior
6 48 (13.15%) Java Developer
7 32 (8.77%) Analyst
8 29 (7.95%) Java Engineer
9 20 (5.48%) Java Software Engineer
10 19 (5.21%) Full-Stack Developer
10 19 (5.21%) Senior Software Engineer
11 18 (4.93%) Senior Developer
12 16 (4.38%) Full-Stack Java Developer
13 15 (4.11%) Lead Software Engineer
14 13 (3.56%) Software Developer
15 12 (3.29%) .NET Developer
16 11 (3.01%) Data Engineer
17 10 (2.74%) Automation Engineer
17 10 (2.74%) Consultant
17 10 (2.74%) Principal Engineer
Libraries, Frameworks & Software Standards
1 74 (20.27%) Elastic Stack
1 74 (20.27%) Spring
2 71 (19.45%) Spring Boot
3 65 (17.81%) OpenTelemetry
4 63 (17.26%) .NET
5 59 (16.16%) REST
6 52 (14.25%) Web Services
7 45 (12.33%) HTML
8 43 (11.78%) RESTful
9 40 (10.96%) Kafka
10 32 (8.77%) Hibernate
10 32 (8.77%) React
11 30 (8.22%) jQuery
12 29 (7.95%) Apache Camel
12 29 (7.95%) JSON
13 23 (6.30%) CSS
14 20 (5.48%) SOAP
15 19 (5.21%) ActiveMQ
15 19 (5.21%) WireMock
16 18 (4.93%) ASP.NET
Miscellaneous
1 34 (9.32%) Distributed Systems
2 21 (5.75%) Data Structures
3 18 (4.93%) Cloud Native
4 17 (4.66%) Algorithms
5 15 (4.11%) Client/Server
5 15 (4.11%) Product Ownership
6 14 (3.84%) IoT
7 11 (3.01%) Management Information System
8 10 (2.74%) Greenfield Project
9 9 (2.47%) Enterprise Software
9 9 (2.47%) Life Science
9 9 (2.47%) Public Cloud
10 8 (2.19%) Data Centre
10 8 (2.19%) Security Operations Centre
11 7 (1.92%) Operational Technology
11 7 (1.92%) SCADA
11 7 (1.92%) Self-Motivation
11 7 (1.92%) Virtual Team
12 5 (1.37%) LIMS
12 5 (1.37%) Mobile App
Operating Systems
1 117 (32.05%) Linux
2 85 (23.29%) Unix
3 41 (11.23%) Windows
4 7 (1.92%) Windows Server
5 5 (1.37%) CentOS
6 4 (1.10%) Red Hat Enterprise Linux
6 4 (1.10%) Ubuntu
7 2 (0.55%) Mac OS
8 1 (0.27%) AIX
8 1 (0.27%) Android
8 1 (0.27%) Apple iOS
8 1 (0.27%) Debian
Processes & Methodologies
1 213 (58.36%) Agile
2 139 (38.08%) DevOps
3 107 (29.32%) Mentoring
4 104 (28.49%) CI/CD
5 92 (25.21%) Microservices
6 85 (23.29%) Containerisation
7 82 (22.47%) Continuous Integration
7 82 (22.47%) Software Engineering
8 76 (20.82%) Roadmaps
9 75 (20.55%) Problem-Solving
10 74 (20.27%) High Availability
11 71 (19.45%) Infrastructure as Code
12 69 (18.90%) Performance Optimisation
13 66 (18.08%) Cost Optimisation
13 66 (18.08%) Product Management
13 66 (18.08%) Task Automation
14 65 (17.81%) Budget Control
14 65 (17.81%) GitOps
14 65 (17.81%) Resource Management
15 51 (13.97%) TDD
Programming Languages
1 170 (46.58%) Java
2 165 (45.21%) SQL
3 157 (43.01%) Python
4 135 (36.99%) JavaScript
5 75 (20.55%) Bash
5 75 (20.55%) Go
6 59 (16.16%) C#
7 21 (5.75%) PowerShell
8 20 (5.48%) Shell Script
9 18 (4.93%) T-SQL
9 18 (4.93%) TypeScript
10 16 (4.38%) C++
10 16 (4.38%) PHP
11 9 (2.47%) PL/SQL
12 6 (1.64%) Data Analysis Expressions
12 6 (1.64%) Perl
12 6 (1.64%) R
13 4 (1.10%) C
14 3 (0.82%) Groovy
15 2 (0.55%) Fortran
Qualifications
1 71 (19.45%) AWS Certification
2 61 (16.71%) Degree
3 36 (9.86%) Security Cleared
4 25 (6.85%) SC Cleared
5 20 (5.48%) Computer Science Degree
6 18 (4.93%) BPSS Clearance
7 7 (1.92%) DV Cleared
7 7 (1.92%) Master's Degree
8 4 (1.10%) Azure Certification
8 4 (1.10%) DBS Check
8 4 (1.10%) OCP
8 4 (1.10%) Oracle Certification
9 3 (0.82%) Microsoft Certification
10 2 (0.55%) AWS Certified Developer
10 2 (0.55%) PhD
10 2 (0.55%) Postgraduate
11 1 (0.27%) TOGAF Certification
Quality Assurance & Compliance
1 15 (4.11%) Data Quality
2 13 (3.56%) QA
3 10 (2.74%) SLA
4 9 (2.47%) GDPR
5 7 (1.92%) HL7
6 6 (1.64%) Accessibility
7 3 (0.82%) CDISC
8 2 (0.55%) DICOM
9 1 (0.27%) Actionable Recommendations
9 1 (0.27%) COBIT
9 1 (0.27%) HIPAA
9 1 (0.27%) SNOMED CT
System Software
1 137 (37.53%) Docker
2 9 (2.47%) VMware Infrastructure
3 7 (1.92%) Virtual Machines
4 4 (1.10%) Virtual Servers
4 4 (1.10%) VMware ESXi
4 4 (1.10%) vSphere
5 2 (0.55%) Firmware
Systems Management
1 136 (37.26%) Kubernetes
2 94 (25.75%) Ansible
3 82 (22.47%) Terraform
4 69 (18.90%) Prometheus
5 68 (18.63%) Argo
6 65 (17.81%) Kustomize
7 25 (6.85%) Kibana
8 6 (1.64%) QRadar
9 5 (1.37%) ZABBIX
10 4 (1.10%) Grafana
10 4 (1.10%) Progress Chef
11 3 (0.82%) Istio
12 1 (0.27%) Microsoft Intune
12 1 (0.27%) Nagios
12 1 (0.27%) Puppet
Vendors
1 70 (19.18%) Google
2 53 (14.52%) Oracle
3 49 (13.42%) Microsoft
4 31 (8.49%) Splunk
5 22 (6.03%) Dynatrace
6 21 (5.75%) Atlassian
7 10 (2.74%) Databricks
8 9 (2.47%) VMware
9 8 (2.19%) IBM
10 7 (1.92%) Dell
10 7 (1.92%) Rockwell
10 7 (1.92%) Siemens
11 6 (1.64%) IFS
11 6 (1.64%) Talend
12 5 (1.37%) Informatica
13 4 (1.10%) RedGate
13 4 (1.10%) Salesforce
13 4 (1.10%) Solace
13 4 (1.10%) TIBCO
14 3 (0.82%) iManage