DV Cleared Jobs in the UK excluding London

Developed Vetting (DV) Clearance
UK > UK excluding London

The table below provides summary statistics for permanent job vacancies advertised in the UK excluding London with a requirement for DV Cleared qualifications. It includes a benchmarking guide to the salaries offered over the 6 months leading up to 1 May 2025, comparing them to the same period in the previous two years.

6 months to
1 May 2025
Same period 2024 Same period 2023
Rank 91 150 294
Rank change year-on-year +59 +144 +47
Permanent jobs citing DV Cleared 1,064 1,366 667
As % of all permanent jobs advertised in the UK excluding London 2.89% 1.94% 1.09%
As % of the Qualifications category 5.26% 7.03% 2.98%
Number of salaries quoted 493 922 476
10th Percentile £42,500 £32,500 £33,875
25th Percentile £47,500 £45,500 £43,300
Median annual salary (50th Percentile) £56,500 £55,000 £55,000
Median % change year-on-year +2.73% - -
75th Percentile £77,500 £68,750 £72,500
90th Percentile £87,500 £87,500 £82,500
UK median annual salary £57,500 £55,500 £56,200
% change year-on-year +3.60% -1.25% +2.18%

All Academic and Professional Certifications
UK excluding London

DV Cleared falls under the Academic Qualifications and Professional Certifications category. For comparison with the information above, the following table provides summary statistics for all permanent job vacancies requiring academic qualifications or professional certifications in the UK excluding London.

Permanent vacancies requiring academic qualifications or professional certifications 20,233 19,440 22,381
As % of all permanent jobs advertised in the UK excluding London 54.94% 27.65% 36.46%
Number of salaries quoted 8,693 12,245 8,229
10th Percentile £31,250 £27,000 £28,000
25th Percentile £41,250 £36,250 £37,039
Median annual salary (50th Percentile) £52,000 £50,000 £50,500
Median % change year-on-year +4.00% -0.99% +1.00%
75th Percentile £63,495 £65,000 £67,500
90th Percentile £73,708 £78,750 £81,250
UK median annual salary £55,000 £54,000 £58,000
% change year-on-year +1.85% -6.90% +5.45%

DV Cleared
Job Vacancy Trend in the UK excluding London

Job postings citing DV Cleared as a proportion of all IT jobs advertised in the UK excluding London.
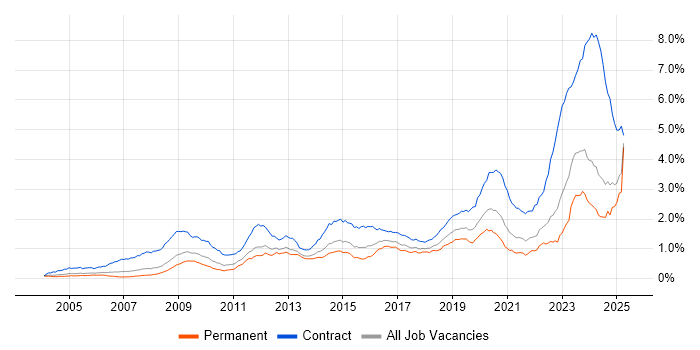
Job vacancy trend for DV Cleared in the UK excluding London

DV Cleared
Salary Trend in the UK excluding London

3-month moving average salary quoted in jobs citing DV Cleared in the UK excluding London.

Salary trend for DV Cleared in the UK excluding London

DV Cleared
Salary Histogram in the UK excluding London

Salary distribution for jobs citing DV Cleared in the UK excluding London over the 6 months to 1 May 2025.

Salary histogram for DV Cleared in the UK excluding London

DV Cleared
Job Locations in the UK excluding London

The table below looks at the demand and provides a guide to the median salaries quoted in IT jobs citing DV Cleared within the UK excluding London region over the 6 months to 1 May 2025. The 'Rank Change' column provides an indication of the change in demand within each location based on the same 6 month period last year.

Location Rank Change
on Same Period
Last Year
Matching
Permanent
IT Job Ads
Median Salary
Past 6 Months
Median Salary
% Change
on Same Period
Last Year
Live
Jobs
North of England +247 408 £52,000 -5.45% 18
North West +175 394 £52,000 -5.45% 13
South East +26 378 £55,000 - 172
South West -21 180 £57,500 -0.86% 166
East of England +58 54 £61,750 +26.67% 30
Midlands +69 32 £57,500 +19.79% 25
West Midlands +41 23 £32,500 -35.00% 18
Scotland +117 11 £58,250 +112.59% 9
Yorkshire +85 11 - - 5
East Midlands +46 9 £57,750 +44.38% 5
North East +50 3 £52,500 +23.53%
Wales +44 1 £67,629 - 1
DV Cleared
UK

DV Cleared
Co-occurring Skills and Capabilities in the UK excluding London by Category

The follow tables expand on the table above by listing co-occurrences grouped by category. The same employment type, locality and period is covered with up to 20 co-occurrences shown in each of the following categories:

Application Platforms
1 26 (2.44%) Microsoft Exchange
2 23 (2.16%) Jupyter
3 8 (0.75%) SharePoint
4 4 (0.38%) Confluence
5 3 (0.28%) Apache
5 3 (0.28%) Skype for Business
6 1 (0.094%) Apache Airflow
6 1 (0.094%) Exchange Server 2013
6 1 (0.094%) nginx
6 1 (0.094%) Office Communications Server
6 1 (0.094%) OpenStack
6 1 (0.094%) SharePoint 2010
6 1 (0.094%) SharePoint Server
Applications
1 7 (0.66%) Microsoft Excel
2 1 (0.094%) GNU Octave
2 1 (0.094%) Microsoft Office
2 1 (0.094%) OrCAD
Cloud Services
1 89 (8.36%) AWS
2 76 (7.14%) Azure
3 41 (3.85%) AWS CloudFormation
4 39 (3.67%) IaaS
5 37 (3.48%) Amazon EKS
6 11 (1.03%) Amazon EC2
6 11 (1.03%) Amazon S3
7 9 (0.85%) AWS Lambda
7 9 (0.85%) GCP
7 9 (0.85%) Serverless
8 8 (0.75%) Power Platform
9 7 (0.66%) OpenShift
9 7 (0.66%) Virtual Private Cloud
10 6 (0.56%) SaaS
11 5 (0.47%) Microsoft 365
12 4 (0.38%) Pulumi
13 3 (0.28%) Azure Sentinel
13 3 (0.28%) Cloud Computing
13 3 (0.28%) PaaS
13 3 (0.28%) PowerApps
Communications & Networking
1 420 (39.47%) VPN
2 417 (39.19%) DNS
3 78 (7.33%) Firewall
4 69 (6.48%) BGP
4 69 (6.48%) Network Security
5 67 (6.30%) OSPF
6 61 (5.73%) EIGRP
7 34 (3.20%) VSAN
8 26 (2.44%) Cisco ASA
9 23 (2.16%) DHCP
10 22 (2.07%) SAN
11 21 (1.97%) TCP/IP
12 19 (1.79%) WAN
13 17 (1.60%) NAS
14 16 (1.50%) LAN
15 13 (1.22%) DMVPN
15 13 (1.22%) SMTP
16 12 (1.13%) MPLS
17 8 (0.75%) Ethernet
17 8 (0.75%) SSL
Database & Business Intelligence
1 46 (4.32%) Big Data
2 38 (3.57%) Elasticsearch
3 9 (0.85%) PostgreSQL
4 8 (0.75%) Amazon RDS
5 7 (0.66%) Power BI
5 7 (0.66%) Relational Database
5 7 (0.66%) SQL Server
6 6 (0.56%) Data Lake
7 5 (0.47%) Tableau
8 4 (0.38%) MongoDB
9 3 (0.28%) MySQL
10 2 (0.19%) GIS
10 2 (0.19%) Metadata
10 2 (0.19%) NoSQL
10 2 (0.19%) Oracle Exadata
11 1 (0.094%) Data Mining
11 1 (0.094%) DynamoDB
Development Applications
1 22 (2.07%) GitLab
2 16 (1.50%) Jenkins
3 14 (1.32%) Git
4 8 (0.75%) JIRA
4 8 (0.75%) MSI
5 7 (0.66%) Robot Framework
6 3 (0.28%) Bitbucket
6 3 (0.28%) JUnit
7 2 (0.19%) Cypress.io
7 2 (0.19%) LabVIEW
8 1 (0.094%) Babel
8 1 (0.094%) GDB
8 1 (0.094%) IDA Disassembler
8 1 (0.094%) Octopus Deploy
8 1 (0.094%) Subversion
8 1 (0.094%) Visual Studio
8 1 (0.094%) Vite
8 1 (0.094%) webpack
8 1 (0.094%) WinDbg
8 1 (0.094%) Yeoman
General
1 531 (49.91%) Inclusion and Diversity
2 456 (42.86%) Finance
3 450 (42.29%) Analytical Skills
4 70 (6.58%) Social Skills
5 21 (1.97%) Public Sector
6 14 (1.32%) Telecoms
7 13 (1.22%) Marketing
8 12 (1.13%) Law
9 10 (0.94%) Manufacturing
10 9 (0.85%) Electronics
10 9 (0.85%) Presentation Skills
11 8 (0.75%) Military
11 8 (0.75%) Retail
12 7 (0.66%) Advertising
13 5 (0.47%) Aerospace
13 5 (0.47%) Police
14 3 (0.28%) Legal
15 2 (0.19%) Documentation Skills
15 2 (0.19%) Organisational Skills
16 1 (0.094%) Influencing Skills
Job Titles
1 444 (41.73%) Developer
2 435 (40.88%) Software Developer
3 109 (10.24%) Network Engineer
4 67 (6.30%) Architect
5 54 (5.08%) Senior
6 52 (4.89%) Data Scientist
7 45 (4.23%) Infrastructure Engineer
8 43 (4.04%) Administrator
9 41 (3.85%) VMware Specialist
10 39 (3.67%) Systems Administrator
11 37 (3.48%) Support Engineer
12 35 (3.29%) Security Engineer
13 31 (2.91%) Wintel Administrator
13 31 (2.91%) Wintel Systems Administrator
14 30 (2.82%) Analyst
14 30 (2.82%) Lead
14 30 (2.82%) Software Engineer
15 26 (2.44%) Infrastructure Support
15 26 (2.44%) Infrastructure Support Engineer
15 26 (2.44%) Network Security Engineer
Libraries, Frameworks & Software Standards
1 40 (3.76%) Node.js
2 37 (3.48%) .NET
3 36 (3.38%) Pandas
4 18 (1.69%) React
5 10 (0.94%) LDAP
6 7 (0.66%) AWS CDK
6 7 (0.66%) Django
6 7 (0.66%) Spring Boot
7 6 (0.56%) Middleware
7 6 (0.56%) Spring
8 5 (0.47%) GWT
8 5 (0.47%) HTML
8 5 (0.47%) Hugging Face
8 5 (0.47%) J2EE
8 5 (0.47%) JPA
8 5 (0.47%) REST
8 5 (0.47%) Vaadin
9 4 (0.38%) AngularJS
9 4 (0.38%) Leaflet
10 3 (0.28%) CSS
Miscellaneous
1 479 (45.02%) Cyberattack
2 65 (6.11%) Algorithms
3 27 (2.54%) PKI
4 20 (1.88%) Clustering
4 20 (1.88%) Data Centre
5 12 (1.13%) Management Information System
6 10 (0.94%) Security Operations Centre
7 8 (0.75%) Cyber Threat
7 8 (0.75%) Private Cloud
8 6 (0.56%) Client/Server
8 6 (0.56%) Linux Command Line
8 6 (0.56%) Self-Motivation
9 5 (0.47%) Cloud Native
9 5 (0.47%) Legacy Systems
9 5 (0.47%) Mobile App
10 4 (0.38%) Hybrid Cloud
11 3 (0.28%) Data Structures
11 3 (0.28%) Freedom of Information
11 3 (0.28%) Robotics
11 3 (0.28%) Virtual Team
Operating Systems
1 523 (49.15%) Linux
2 429 (40.32%) Android
3 159 (14.94%) Windows
4 83 (7.80%) Windows Server
5 15 (1.41%) Red Hat Enterprise Linux
5 15 (1.41%) Unix
6 12 (1.13%) Rocky
7 6 (0.56%) AIX
7 6 (0.56%) Solaris
8 5 (0.47%) Windows 10
8 5 (0.47%) Windows Server 2003
9 4 (0.38%) Windows 7
9 4 (0.38%) Windows 8
10 3 (0.28%) CentOS
10 3 (0.28%) Windows Server 2019
11 1 (0.094%) Data ONTAP
11 1 (0.094%) Ubuntu
11 1 (0.094%) Windows Server 2016
Processes & Methodologies
1 510 (47.93%) Agile
2 487 (45.77%) Mathematics
3 468 (43.98%) Line Management
4 429 (40.32%) Android Development
5 428 (40.23%) OO
6 427 (40.13%) Design Patterns
6 427 (40.13%) OOP
7 105 (9.87%) Problem-Solving
8 99 (9.30%) Software Engineering
9 88 (8.27%) Artificial Intelligence
10 83 (7.80%) Statistics
11 73 (6.86%) Containerisation
12 72 (6.77%) Machine Learning
13 70 (6.58%) DevOps
13 70 (6.58%) Infrastructure Engineering
14 68 (6.39%) Computer Science
15 64 (6.02%) CI/CD
16 56 (5.26%) Data Analysis
17 55 (5.17%) Kanban
17 55 (5.17%) Mentoring
Programming Languages
1 567 (53.29%) Python
2 479 (45.02%) Java
3 462 (43.42%) C++
4 432 (40.60%) Go
5 112 (10.53%) PowerShell
6 90 (8.46%) JavaScript
7 39 (3.67%) Rust
8 32 (3.01%) Bash
8 32 (3.01%) SQL
9 16 (1.50%) C
9 16 (1.50%) TypeScript
10 11 (1.03%) Perl
11 8 (0.75%) Fortran
12 7 (0.66%) Kusto Query Language
13 5 (0.47%) VB
14 4 (0.38%) C#
15 3 (0.28%) PHP
16 2 (0.19%) Embedded C
16 2 (0.19%) Embedded C++
16 2 (0.19%) VBA
Qualifications
1 1,064 (100.00%) Security Cleared
2 288 (27.07%) SC Cleared
3 107 (10.06%) Degree
4 32 (3.01%) Cisco Certification
5 28 (2.63%) Computer Science Degree
6 23 (2.16%) Numerate Degree
7 20 (1.88%) CCNA
8 17 (1.60%) CCNP
9 15 (1.41%) PhD
10 13 (1.22%) Master's Degree
11 9 (0.85%) CISSP
11 9 (0.85%) HND
12 8 (0.75%) VMware Certified Professional (VCP)
13 5 (0.47%) HNC
13 5 (0.47%) MCP
13 5 (0.47%) MCSE
13 5 (0.47%) Microsoft Certification
13 5 (0.47%) Postgraduate
14 3 (0.28%) CCIE
14 3 (0.28%) CISM
Quality Assurance & Compliance
1 6 (0.56%) PMBOK
1 6 (0.56%) QA
2 5 (0.47%) NIST
3 4 (0.38%) Government Security Classifications
3 4 (0.38%) ISO/IEC 27001
4 3 (0.28%) NIST 800
4 3 (0.28%) SLA
5 2 (0.19%) Accessibility
5 2 (0.19%) GRC
5 2 (0.19%) MISRA
6 1 (0.094%) ISO 22301
6 1 (0.094%) JTAG
6 1 (0.094%) MISRA C
System Software
1 510 (47.93%) Docker
2 100 (9.40%) VMware Infrastructure
3 57 (5.36%) Active Directory
4 49 (4.61%) vSphere
5 42 (3.95%) VMware NSX
6 24 (2.26%) VMware ESXi
7 21 (1.97%) Hyper-V
8 7 (0.66%) BitLocker
8 7 (0.66%) Microsoft App-V
8 7 (0.66%) Terminal Services
9 4 (0.38%) Virtual Desktop
10 2 (0.19%) Firmware
10 2 (0.19%) Virtual Machines
11 1 (0.094%) Embedded Firmware
11 1 (0.094%) EMC RecoverPoint
11 1 (0.094%) ISA Server
11 1 (0.094%) NFS
11 1 (0.094%) Snort
11 1 (0.094%) vCloud
11 1 (0.094%) Xen
Systems Management
1 474 (44.55%) Ansible
2 102 (9.59%) Kubernetes
3 75 (7.05%) Terraform
4 26 (2.44%) FortiGate
5 19 (1.79%) vCenter Server
6 16 (1.50%) Puppet
7 15 (1.41%) WMI
8 14 (1.32%) SCCM
8 14 (1.32%) vRealize
9 13 (1.22%) Active Directory Federation Services
9 13 (1.22%) Single Sign-On
10 12 (1.13%) vMotion
11 11 (1.03%) Progress Chef
12 8 (0.75%) vRealize Orchestrator
13 7 (0.66%) PowerCLI
14 6 (0.56%) QRadar
15 5 (0.47%) Nagios
15 5 (0.47%) SCOM
16 3 (0.28%) Avamar
16 3 (0.28%) EMC NetWorker
Vendors
1 140 (13.16%) Cisco
2 109 (10.24%) VMware
3 87 (8.18%) Juniper
4 65 (6.11%) Microsoft
5 57 (5.36%) Fortinet
6 27 (2.54%) Red Hat
7 23 (2.16%) Splunk
8 15 (1.41%) Citrix
8 15 (1.41%) Forcepoint
9 13 (1.22%) SolarWinds
10 10 (0.94%) HP
10 10 (0.94%) ServiceNow
11 8 (0.75%) SAP
12 7 (0.66%) EMC
12 7 (0.66%) Google
12 7 (0.66%) McAfee
12 7 (0.66%) SevOne
13 5 (0.47%) ArcSight
13 5 (0.47%) Symantec
13 5 (0.47%) Veeam