Splunk Jobs in the UK excluding London

Splunk
UK > UK excluding London

The table below provides summary statistics for permanent job vacancies advertised in the UK excluding London requiring knowledge or experience of Splunk products and/or services. It includes a benchmarking guide to the annual salaries offered in vacancies that cited Splunk over the 6 months leading up to 26 July 2024, comparing them to the same period in the previous two years.

The figures below represent the IT labour market in general and are not representative of salaries within Splunk, Inc.

6 months to
26 Jul 2024
Same period 2023 Same period 2022
Rank 412 404 502
Rank change year-on-year -8 +98 -89
Permanent jobs citing Splunk 319 299 422
As % of all permanent jobs advertised in the UK excluding London 0.49% 0.62% 0.54%
As % of the Vendors category 1.52% 1.55% 1.38%
Number of salaries quoted 109 155 237
10th Percentile £44,500 £37,885 £38,750
25th Percentile £46,713 £47,500 £47,500
Median annual salary (50th Percentile) £60,000 £65,000 £60,000
Median % change year-on-year -7.69% +8.33% -4.00%
75th Percentile £70,000 £80,000 £73,750
90th Percentile £80,000 £86,500 £87,750
UK median annual salary £65,000 £72,500 £75,000
% change year-on-year -10.34% -3.33% +7.14%

All Vendors
UK excluding London

Splunk falls under the Vendor Products and Services category. For comparison with the information above, the following table provides summary statistics for all permanent job vacancies requiring knowledge or experience of all vendor products and services in the UK excluding London.

Permanent vacancies with a requirement for knowledge or experience of vendor products and services 20,982 19,279 30,618
As % of all permanent jobs advertised in the UK excluding London 32.14% 40.04% 39.10%
Number of salaries quoted 12,986 12,116 17,422
10th Percentile £26,250 £27,600 £27,000
25th Percentile £33,000 £36,250 £35,000
Median annual salary (50th Percentile) £47,500 £50,000 £47,501
Median % change year-on-year -5.00% +5.26% +3.26%
75th Percentile £62,500 £65,000 £62,500
90th Percentile £76,250 £77,500 £77,500
UK median annual salary £52,500 £57,500 £55,000
% change year-on-year -8.70% +4.55% +1.85%

Splunk
Job Vacancy Trend in the UK excluding London

Job postings citing Splunk as a proportion of all IT jobs advertised in the UK excluding London.
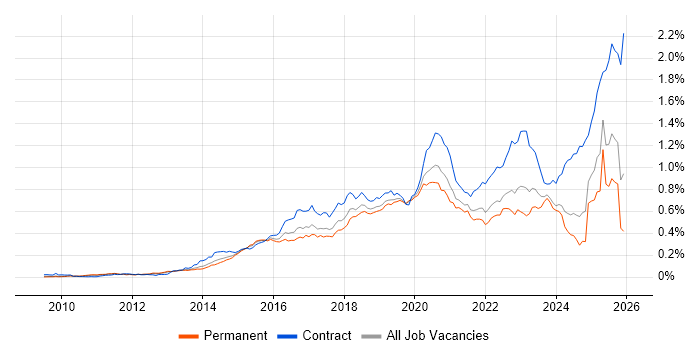
Job vacancy trend for Splunk in the UK excluding London

Splunk
Salary Trend in the UK excluding London

3-month moving average salary quoted in jobs citing Splunk in the UK excluding London.

Salary trend for Splunk in the UK excluding London

Splunk
Salary Histogram in the UK excluding London

Salary distribution for jobs citing Splunk in the UK excluding London over the 6 months to 26 July 2024.

Salary histogram for Splunk in the UK excluding London

Splunk
Job Locations in the UK excluding London

The table below looks at the demand and provides a guide to the median salaries quoted in IT jobs citing Splunk within the UK excluding London region over the 6 months to 26 July 2024. The 'Rank Change' column provides an indication of the change in demand within each location based on the same 6 month period last year.

Location Rank Change
on Same Period
Last Year
Matching
Permanent
IT Job Ads
Median Salary
Past 6 Months
Median Salary
% Change
on Same Period
Last Year
Live
Jobs
Scotland +60 172 £80,000 +6.67% 6
South East -10 44 £53,750 -20.37% 7
North of England -24 43 £62,783 +0.45% 12
Midlands -18 25 £50,000 -16.67% 3
North West -34 21 £62,783 +4.21% 9
East Midlands -16 20 £50,000 -13.04%
Yorkshire +51 16 £65,000 +4.00% 1
South West -41 15 £52,500 -22.22% 8
East of England +2 13 £60,000 +7.62% 3
North East -11 6 £62,783 -26.14% 2
West Midlands -12 5 £50,000 -24.53% 3
Northern Ireland +17 2 £50,309 -32.92% 7
Wales +3 2 £50,309 +7.04% 1
Isle of Man -13 2 - -
Channel Islands - 1 - -
Splunk
UK

Splunk
Co-occurring Skills and Capabilities in the UK excluding London by Category

The follow tables expand on the table above by listing co-occurrences grouped by category. The same employment type, locality and period is covered with up to 20 co-occurrences shown in each of the following categories:

Application Platforms
1 21 (6.58%) GemFire
2 6 (1.88%) Apache
2 6 (1.88%) JBoss
3 5 (1.57%) Tomcat
3 5 (1.57%) WebSphere
4 4 (1.25%) Apache Spark
4 4 (1.25%) IIS
4 4 (1.25%) nginx
5 3 (0.94%) SAS
Applications
1 4 (1.25%) Microsoft Excel
2 1 (0.31%) Microsoft Project
Business Applications
1 1 (0.31%) Primavera
Cloud Services
1 153 (47.96%) AWS
2 128 (40.13%) Datadog
3 81 (25.39%) Azure
4 69 (21.63%) Amazon CloudWatch
5 30 (9.40%) Amazon ECS
6 24 (7.52%) Azure Sentinel
7 14 (4.39%) Serverless
8 12 (3.76%) Amazon GuardDuty
8 12 (3.76%) AWS CloudTrail
8 12 (3.76%) dbt
9 11 (3.45%) GitHub
10 10 (3.13%) Amazon EKS
10 10 (3.13%) Cloud Computing
11 9 (2.82%) AWS CloudFormation
12 8 (2.51%) Microsoft 365
13 7 (2.19%) Amazon EC2
13 7 (2.19%) Amazon MSK
13 7 (2.19%) Amazon SageMaker
13 7 (2.19%) OpenShift
14 6 (1.88%) GCP
Communications & Networking
1 20 (6.27%) Network Security
2 13 (4.08%) Firewall
3 9 (2.82%) Internet
4 8 (2.51%) TCP/IP
5 7 (2.19%) DNS
5 7 (2.19%) Intrusion Detection
5 7 (2.19%) VPN
6 5 (1.57%) SAN
7 4 (1.25%) BGP
7 4 (1.25%) LAN
7 4 (1.25%) SSL
7 4 (1.25%) WAN
8 3 (0.94%) DHCP
9 2 (0.63%) SNMP
9 2 (0.63%) SSH
Database & Business Intelligence
1 32 (10.03%) NoSQL
2 29 (9.09%) Apache Cassandra
3 24 (7.52%) Relational Database
4 21 (6.58%) CockroachDB
4 21 (6.58%) Hazelcast
5 16 (5.02%) PostgreSQL
6 9 (2.82%) MongoDB
7 7 (2.19%) RDBMS
8 6 (1.88%) Hadoop
9 5 (1.57%) MySQL
9 5 (1.57%) Pentaho
9 5 (1.57%) Power BI
9 5 (1.57%) Redis
10 4 (1.25%) Amazon Redshift
10 4 (1.25%) DynamoDB
10 4 (1.25%) Elasticsearch
10 4 (1.25%) SQL Server
11 3 (0.94%) Amazon RDS
11 3 (0.94%) Oracle Database
12 2 (0.63%) BigQuery
Development Applications
1 34 (10.66%) Jenkins
2 23 (7.21%) JUnit
3 21 (6.58%) Jaeger
4 18 (5.64%) GitLab
5 15 (4.70%) JIRA
6 14 (4.39%) Git
7 12 (3.76%) Bitbucket
7 12 (3.76%) JMeter
8 7 (2.19%) Maven
8 7 (2.19%) Mockito
9 5 (1.57%) Eclipse
10 4 (1.25%) Robot Framework
11 3 (0.94%) SonarQube
11 3 (0.94%) TeamCity
12 2 (0.63%) Cucumber
12 2 (0.63%) IntelliJ
13 1 (0.31%) Postman
13 1 (0.31%) Selenium
General
1 183 (57.37%) Inclusion and Diversity
2 177 (55.49%) Finance
3 163 (51.10%) Law
4 111 (34.80%) Social Skills
5 78 (24.45%) Marketing
6 37 (11.60%) Banking
7 31 (9.72%) Investment Banking
8 19 (5.96%) Public Sector
9 13 (4.08%) Analytical Skills
10 12 (3.76%) Aerospace
11 6 (1.88%) Private Banking
12 5 (1.57%) Legal
13 4 (1.25%) Organisational Skills
14 3 (0.94%) Retail
15 2 (0.63%) Manufacturing
15 2 (0.63%) Telecoms
16 1 (0.31%) Advertising
16 1 (0.31%) Military
16 1 (0.31%) Presentation Skills
Job Titles
1 151 (47.34%) Software Engineer
2 102 (31.97%) Lead
3 72 (22.57%) Lead Software Engineer
4 67 (21.00%) Cloud Engineer
5 52 (16.30%) Cloud Software Engineer
6 39 (12.23%) Java Engineer
6 39 (12.23%) Java Software Engineer
7 30 (9.40%) Lead Cloud Engineer
8 28 (8.78%) Senior
9 24 (7.52%) Lead Java Engineer
10 23 (7.21%) Security Engineer
11 15 (4.70%) Analyst
12 14 (4.39%) Cybersecurity Engineer
13 13 (4.08%) Splunk Engineer
14 10 (3.13%) Developer
15 9 (2.82%) Data Engineer
15 9 (2.82%) Product Owner
15 9 (2.82%) Senior Product Owner
15 9 (2.82%) SOC Analyst
16 8 (2.51%) SIEM Engineer
Libraries, Frameworks & Software Standards
1 96 (30.09%) OpenTelemetry
2 70 (21.94%) Spring
3 56 (17.55%) Spring Boot
4 50 (15.67%) Kafka
5 34 (10.66%) REST
6 32 (10.03%) JPA
7 21 (6.58%) HTML
8 19 (5.96%) .NET
9 14 (4.39%) Web Services
10 12 (3.76%) CSS
10 12 (3.76%) Django
10 12 (3.76%) RESTful
11 10 (3.13%) Hibernate
12 8 (2.51%) OAuth
12 8 (2.51%) OAuth2
12 8 (2.51%) OpenID
13 7 (2.19%) ActiveMQ
13 7 (2.19%) Apache Camel
13 7 (2.19%) jQuery
13 7 (2.19%) WireMock
Miscellaneous
1 97 (30.41%) Cloud Native
2 75 (23.51%) Public Cloud
3 37 (11.60%) Algorithms
4 29 (9.09%) Distributed Systems
5 27 (8.46%) Management Information System
6 21 (6.58%) Foreign Exchange (FX)
6 21 (6.58%) Replication
6 21 (6.58%) Security Operations Centre
7 15 (4.70%) Data Structures
8 10 (3.13%) Hybrid Cloud
9 9 (2.82%) Onboarding
9 9 (2.82%) Product Ownership
10 7 (2.19%) PKI
10 7 (2.19%) Security Posture
11 6 (1.88%) Cyberattack
12 5 (1.57%) Analytical Mindset
12 5 (1.57%) Cyber Threat
12 5 (1.57%) Data Centre
12 5 (1.57%) Reference Data
12 5 (1.57%) Self-Motivation
Operating Systems
1 43 (13.48%) Linux
2 37 (11.60%) Windows
3 16 (5.02%) Windows Server
4 10 (3.13%) Unix
5 5 (1.57%) Kali Linux
5 5 (1.57%) Mac OS X
6 4 (1.25%) Red Hat Enterprise Linux
6 4 (1.25%) Windows 10
6 4 (1.25%) zOS
7 3 (0.94%) Windows Server 2008
8 1 (0.31%) CentOS
8 1 (0.31%) Windows 7
8 1 (0.31%) Windows Server 2003
8 1 (0.31%) Windows Server 2019
Processes & Methodologies
1 176 (55.17%) Software Engineering
2 171 (53.61%) CI/CD
3 163 (51.10%) Agile
4 147 (46.08%) Community of Practice
5 136 (42.63%) Operational Stability
6 128 (40.13%) SDLC
7 117 (36.68%) Observability
8 115 (36.05%) Continuous Delivery
9 112 (35.11%) Artificial Intelligence
10 103 (32.29%) Architectural Design
11 96 (30.09%) Information Architecture
12 95 (29.78%) Machine Learning
13 93 (29.15%) Stakeholder Management
14 84 (26.33%) Cybersecurity
15 81 (25.39%) Site Reliability Engineering
16 72 (22.57%) Vulnerability Remediation
17 69 (21.63%) SIEM
18 67 (21.00%) Identity Access Management
19 48 (15.05%) Microservices
20 43 (13.48%) Security Operations
Programming Languages
1 138 (43.26%) Java
2 90 (28.21%) Python
3 52 (16.30%) SQL
4 33 (10.34%) PowerShell
5 23 (7.21%) Bash
6 22 (6.90%) JavaScript
7 21 (6.58%) Groovy
8 17 (5.33%) Kusto Query Language
9 12 (3.76%) Shell Script
10 7 (2.19%) Go
11 5 (1.57%) Search Processing Language
12 4 (1.25%) JCL
12 4 (1.25%) REXX
13 3 (0.94%) Assembly Language
14 2 (0.63%) C
14 2 (0.63%) C++
14 2 (0.63%) Perl
Qualifications
1 39 (12.23%) Security Cleared
2 29 (9.09%) SC Cleared
3 22 (6.90%) Degree
4 12 (3.76%) Computer Science Degree
5 11 (3.45%) CISSP
6 6 (1.88%) Azure Certification
6 6 (1.88%) DV Cleared
7 5 (1.57%) AWS Certification
7 5 (1.57%) Microsoft Certification
8 2 (0.63%) CCA
8 2 (0.63%) Citrix Certification
8 2 (0.63%) CompTIA Security+
9 1 (0.31%) BPSS Clearance
9 1 (0.31%) CEH
9 1 (0.31%) GCFE
9 1 (0.31%) GIAC
9 1 (0.31%) GISP
9 1 (0.31%) GSEC
9 1 (0.31%) PRINCE2 Practitioner
9 1 (0.31%) SSCP
Quality Assurance & Compliance
1 15 (4.70%) NIST
2 10 (3.13%) PCI DSS
3 9 (2.82%) ISO/IEC 27001
3 9 (2.82%) NCSC
4 5 (1.57%) HIPAA
4 5 (1.57%) ISO/IEC 27002 (supersedes ISO/IEC 17799)
5 4 (1.25%) GDPR
5 4 (1.25%) Sarbanes-Oxley
6 3 (0.94%) HMG Infosec
6 3 (0.94%) HMG Security Policy Framework
6 3 (0.94%) JSP 440
6 3 (0.94%) RMADS
7 2 (0.63%) QA
8 1 (0.31%) Cyber Essentials
8 1 (0.31%) Cyber Essentials PLUS
System Software
1 55 (17.24%) Docker
2 19 (5.96%) Active Directory
3 7 (2.19%) VMware Infrastructure
3 7 (2.19%) vSphere
4 4 (1.25%) Time Sharing Option
4 4 (1.25%) Virtual Desktop
4 4 (1.25%) VMware Server
5 3 (0.94%) ACF2
5 3 (0.94%) RACF
6 2 (0.63%) Citrix Hypervisor
6 2 (0.63%) Firmware
6 2 (0.63%) Microsoft App-V
7 1 (0.31%) XenApp
Systems Management
1 167 (52.35%) Grafana
2 98 (30.72%) Terraform
3 95 (29.78%) Prometheus
4 55 (17.24%) Kubernetes
5 31 (9.72%) Kibana
6 26 (8.15%) ITRS Geneos
7 21 (6.58%) HAProxy
7 21 (6.58%) Zipkin
8 16 (5.02%) Ansible
9 8 (2.51%) Graphite
9 8 (2.51%) Progress Chef
9 8 (2.51%) Puppet
9 8 (2.51%) Single Sign-On
10 7 (2.19%) NetCrunch
11 6 (1.88%) Nagios
12 5 (1.57%) Fluentd
12 5 (1.57%) logstash
12 5 (1.57%) Suricata
13 4 (1.25%) SCOrch
13 4 (1.25%) vMotion
Vendors
1 144 (45.14%) Dynatrace
2 44 (13.79%) Microsoft
3 17 (5.33%) Google
4 16 (5.02%) Oracle
5 15 (4.70%) ServiceNow
6 14 (4.39%) VMware
7 13 (4.08%) Palo Alto
8 9 (2.82%) IBM
8 9 (2.82%) New Relic
9 7 (2.19%) Atlassian
9 7 (2.19%) Cisco
10 6 (1.88%) Red Hat
11 5 (1.57%) AppDynamics
11 5 (1.57%) CA
11 5 (1.57%) Juniper
11 5 (1.57%) LogRhythm
11 5 (1.57%) McAfee
11 5 (1.57%) Rapid7
11 5 (1.57%) Salesforce
11 5 (1.57%) Sybase