Cybersecurity Jobs in the UK excluding London

Cybersecurity
UK > UK excluding London

The table below provides summary statistics for permanent job vacancies advertised in the UK excluding London requiring Cybersecurity skills. It includes a benchmarking guide to the annual salaries offered in vacancies that cited Cybersecurity over the 6 months leading up to 30 May 2025, comparing them to the same period in the previous two years.

6 months to
30 May 2025
Same period 2024 Same period 2023
Rank 34 38 43
Rank change year-on-year +4 +5 +9
Permanent jobs citing Cybersecurity 2,515 3,868 3,727
As % of all permanent jobs advertised in the UK excluding London 6.39% 5.19% 6.42%
As % of the Processes & Methodologies category 6.89% 6.30% 6.72%
Number of salaries quoted 1,486 2,759 1,761
10th Percentile £25,500 £34,823 £33,090
25th Percentile £38,750 £41,250 £45,000
Median annual salary (50th Percentile) £47,683 £52,500 £59,526
Median % change year-on-year -9.18% -11.80% +3.52%
75th Percentile £60,000 £67,500 £70,000
90th Percentile £77,500 £80,000 £85,000
UK median annual salary £50,000 £57,500 £65,000
% change year-on-year -13.04% -11.54% -

All Process and Methodology Skills
UK excluding London

Cybersecurity falls under the Processes and Methodologies category. For comparison with the information above, the following table provides summary statistics for all permanent job vacancies requiring process or methodology skills in the UK excluding London.

Permanent vacancies with a requirement for process or methodology skills 36,483 61,419 55,450
As % of all permanent jobs advertised in the UK excluding London 92.65% 82.37% 95.58%
Number of salaries quoted 17,392 42,187 28,711
10th Percentile £26,250 £27,250 £30,500
25th Percentile £36,750 £36,250 £40,000
Median annual salary (50th Percentile) £51,574 £50,000 £55,000
Median % change year-on-year +3.15% -9.09% +4.76%
75th Percentile £65,000 £65,000 £70,000
90th Percentile £77,500 £77,500 £82,500
UK median annual salary £57,443 £55,000 £60,899
% change year-on-year +4.44% -9.69% +1.50%

Cybersecurity
Job Vacancy Trend in the UK excluding London

Job postings citing Cybersecurity as a proportion of all IT jobs advertised in the UK excluding London.
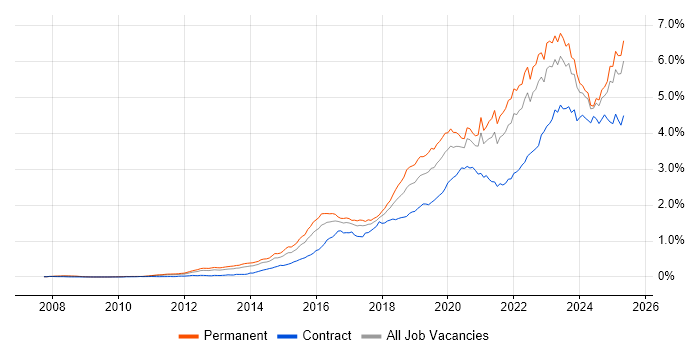
Job vacancy trend for Cybersecurity in the UK excluding London

Cybersecurity
Salary Trend in the UK excluding London

3-month moving average salary quoted in jobs citing Cybersecurity in the UK excluding London.

Salary trend for Cybersecurity in the UK excluding London

Cybersecurity
Salary Histogram in the UK excluding London

Salary distribution for jobs citing Cybersecurity in the UK excluding London over the 6 months to 30 May 2025.

Salary histogram for Cybersecurity in the UK excluding London

Cybersecurity
Job Locations in the UK excluding London

The table below looks at the demand and provides a guide to the median salaries quoted in IT jobs citing Cybersecurity within the UK excluding London region over the 6 months to 30 May 2025. The 'Rank Change' column provides an indication of the change in demand within each location based on the same 6 month period last year.

Location Rank Change
on Same Period
Last Year
Matching
Permanent
IT Job Ads
Median Salary
Past 6 Months
Median Salary
% Change
on Same Period
Last Year
Live
Jobs
North of England -13 684 £47,683 -8.45% 1,618
South East -2 588 £47,683 -5.58% 2,075
Midlands +11 538 £47,683 -13.30% 1,351
North West -31 381 £54,022 +3.72% 771
West Midlands +4 339 £57,500 +4.38% 726
Yorkshire +17 286 £47,683 -4.63% 645
South West +1 245 £47,683 -20.53% 866
Scotland +35 199 £47,683 -7.86% 395
East Midlands +18 196 £47,683 +12.20% 536
East of England +2 169 £47,683 -4.63% 1,069
Wales +47 63 £47,683 -9.18% 205
Northern Ireland +42 30 £69,384 +63.26% 103
North East -15 17 £65,000 +52.94% 204
Channel Islands 0 2 £78,750 -21.25% 17
Isle of Man +7 1 £34,500 -8.00%
Cybersecurity
UK

Cybersecurity
Co-occurring Skills and Capabilities in the UK excluding London by Category

The follow tables expand on the table above by listing co-occurrences grouped by category. The same employment type, locality and period is covered with up to 20 co-occurrences shown in each of the following categories:

Application Platforms
1 67 (2.66%) Microsoft Exchange
2 43 (1.71%) SharePoint
3 16 (0.64%) IIS
4 11 (0.44%) Umbraco
5 9 (0.36%) Confluence
6 5 (0.20%) Apache
7 4 (0.16%) CMS
8 3 (0.12%) WordPress
9 2 (0.080%) Apache Solr
9 2 (0.080%) Apache Spark
9 2 (0.080%) SharePoint Server
9 2 (0.080%) Skype for Business
9 2 (0.080%) TPMS
10 1 (0.040%) Apache Airflow
Applications
1 54 (2.15%) Microsoft Office
2 20 (0.80%) Simulink
3 17 (0.68%) Microsoft Project
4 14 (0.56%) Trello
5 11 (0.44%) Microsoft Excel
6 5 (0.20%) Chatbot
7 2 (0.080%) Adobe Creative Suite
7 2 (0.080%) Microsoft PowerPoint
8 1 (0.040%) OrCAD
Business Applications
1 14 (0.56%) Dynamics CRM
2 7 (0.28%) NetSuite
3 3 (0.12%) Dynamics NAV
3 3 (0.12%) Sage 50
3 3 (0.12%) Salesforce CRM
4 1 (0.040%) Elite 3E
Cloud Services
1 300 (11.93%) Azure
2 290 (11.53%) Microsoft 365
3 147 (5.84%) AWS
4 57 (2.27%) Entra ID
5 45 (1.79%) Cloud Computing
5 45 (1.79%) GCP
6 39 (1.55%) PaaS
7 33 (1.31%) SaaS
8 29 (1.15%) Azure DevOps
9 28 (1.11%) Azure Sentinel
9 28 (1.11%) IaaS
10 27 (1.07%) AWS Lambda
10 27 (1.07%) Serverless
11 23 (0.91%) Power Platform
12 21 (0.83%) Google Workspace
13 14 (0.56%) PowerApps
14 13 (0.52%) GitHub
15 12 (0.48%) Dynamics 365
16 10 (0.40%) OneDrive
16 10 (0.40%) Power Automate
Communications & Networking
1 260 (10.34%) Firewall
2 98 (3.90%) Network Security
3 88 (3.50%) DNS
4 87 (3.46%) VoIP
5 78 (3.10%) WAN
6 70 (2.78%) DHCP
7 64 (2.54%) LAN
8 59 (2.35%) TCP/IP
9 56 (2.23%) VPN
10 45 (1.79%) VLAN
11 33 (1.31%) SSL
11 33 (1.31%) Wi-Fi
12 29 (1.15%) Broadband
13 26 (1.03%) SSH
14 25 (0.99%) Intrusion Detection
15 24 (0.95%) Internet
16 23 (0.91%) 5G
17 22 (0.87%) 3GPP
18 17 (0.68%) SAN
19 15 (0.60%) SD-WAN
Database & Business Intelligence
1 28 (1.11%) SQL Server
2 21 (0.83%) MongoDB
3 16 (0.64%) Amazon RDS
4 14 (0.56%) Power BI
5 13 (0.52%) PostgreSQL
6 12 (0.48%) MySQL
7 11 (0.44%) BigQuery
8 7 (0.28%) Data Warehouse
8 7 (0.28%) NoSQL
8 7 (0.28%) Relational Database
9 6 (0.24%) Big Data
9 6 (0.24%) Elasticsearch
10 3 (0.12%) MS Access
10 3 (0.12%) Tableau
11 2 (0.080%) EDMS
12 1 (0.040%) GIS
12 1 (0.040%) Hadoop
12 1 (0.040%) Neo4j
12 1 (0.040%) Oracle Reports
12 1 (0.040%) SQL Server Integration Services
Development Applications
1 71 (2.82%) JIRA
2 41 (1.63%) Rational DOORS
3 18 (0.72%) Selenium
4 9 (0.36%) Git
5 6 (0.24%) SonarQube
6 5 (0.20%) Bitbucket
6 5 (0.20%) GitLab
7 4 (0.16%) Burp Suite
7 4 (0.16%) Metasploit
8 2 (0.080%) Babel
8 2 (0.080%) Jenkins
8 2 (0.080%) Mocha
8 2 (0.080%) rollup.js
8 2 (0.080%) Subversion
8 2 (0.080%) webpack
9 1 (0.040%) CMake
9 1 (0.040%) Cucumber
9 1 (0.040%) Cypress.io
9 1 (0.040%) LabVIEW
9 1 (0.040%) TeamCity
General
1 577 (22.94%) Social Skills
2 535 (21.27%) Presentation Skills
3 294 (11.69%) Legal
4 276 (10.97%) Inclusion and Diversity
5 269 (10.70%) Law
6 252 (10.02%) Finance
7 140 (5.57%) Analytical Skills
8 98 (3.90%) Banking
9 83 (3.30%) Telecoms
10 62 (2.47%) Retail
11 53 (2.11%) Public Sector
12 50 (1.99%) Manufacturing
13 42 (1.67%) Marketing
14 36 (1.43%) Aerospace
15 32 (1.27%) Electronics
16 27 (1.07%) Military
17 24 (0.95%) Organisational Skills
18 21 (0.83%) Automotive
19 18 (0.72%) Back Office
19 18 (0.72%) Influencing Skills
Job Titles
1 550 (21.87%) Systems Engineer
2 284 (11.29%) Security Engineer
3 266 (10.58%) Analyst
4 177 (7.04%) IT Support
5 166 (6.60%) Senior
6 160 (6.36%) Security Analyst
7 158 (6.28%) Principal Engineer
8 147 (5.84%) Principal Security Engineer
9 139 (5.53%) Lead
10 87 (3.46%) Principal Security Analyst
10 87 (3.46%) Product Analyst
11 74 (2.94%) Security Manager
12 72 (2.86%) Architect
13 70 (2.78%) IT Engineer
14 61 (2.43%) Support Specialist
15 60 (2.39%) Product Engineer
16 58 (2.31%) Senior Security Engineer
17 56 (2.23%) Cybersecurity Engineer
18 55 (2.19%) IT Support Specialist
19 53 (2.11%) IT Analyst
Libraries, Frameworks & Software Standards
1 60 (2.39%) Software Packaging
2 39 (1.55%) Web Services
3 31 (1.23%) React
4 27 (1.07%) RESTful
5 19 (0.76%) CSS
6 18 (0.72%) Node.js
6 18 (0.72%) YAML
7 16 (0.64%) Kafka
7 16 (0.64%) SAML
8 14 (0.56%) REST
9 13 (0.52%) .NET
10 12 (0.48%) AngularJS
10 12 (0.48%) OAuth
10 12 (0.48%) OpenID
11 11 (0.44%) Ajax
11 11 (0.44%) jQuery
11 11 (0.44%) Middleware
12 10 (0.40%) HTML
13 7 (0.28%) Vue
14 6 (0.24%) Azure Blueprints
Miscellaneous
1 293 (11.65%) Cyberattack
2 178 (7.08%) Management Information System
3 123 (4.89%) Operational Technology
4 106 (4.21%) Data Centre
5 105 (4.17%) Security Posture
6 86 (3.42%) Cyber Threat
7 63 (2.50%) Onboarding
8 47 (1.87%) Self-Motivation
9 43 (1.71%) Security Operations Centre
10 37 (1.47%) PKI
11 35 (1.39%) Driving Licence
12 33 (1.31%) CCTV
12 33 (1.31%) Social Media
13 32 (1.27%) Renewable Energy
14 31 (1.23%) SCADA
15 24 (0.95%) Data Protection Act
16 21 (0.83%) Product Ownership
17 14 (0.56%) e-Learning
17 14 (0.56%) EPoS
17 14 (0.56%) Robotics
Operating Systems
1 365 (14.51%) Windows
2 117 (4.65%) Windows Server
3 86 (3.42%) Linux
4 84 (3.34%) Windows 10
5 33 (1.31%) Mac OS
6 21 (0.83%) Apple iOS
7 18 (0.72%) Unix
8 17 (0.68%) Android
9 10 (0.40%) Windows Vista
10 9 (0.36%) Red Hat Enterprise Linux
11 6 (0.24%) VMS
11 6 (0.24%) Windows 7
11 6 (0.24%) Windows Server 2019
12 5 (0.20%) Windows Server 2016
13 4 (0.16%) Windows Server 2012
14 2 (0.080%) Windows Server 2003
15 1 (0.040%) Solaris
15 1 (0.040%) Ubuntu
15 1 (0.040%) Windows Server 2008
Processes & Methodologies
1 675 (26.84%) Agile
2 595 (23.66%) Systems Engineering
3 536 (21.31%) SysML
4 522 (20.76%) MODAF
5 520 (20.68%) UML
6 373 (14.83%) Risk Management
7 365 (14.51%) Information Security
8 327 (13.00%) Line Management
9 316 (12.56%) Problem-Solving
10 260 (10.34%) Creative Thinking
11 247 (9.82%) Project Management
12 193 (7.67%) Computer Science
13 184 (7.32%) Incident Response
14 177 (7.04%) Security Testing
15 166 (6.60%) Continuous Improvement
16 164 (6.52%) Artificial Intelligence
17 159 (6.32%) Cyber Resilience
18 154 (6.12%) Customer Service
19 151 (6.00%) Mentoring
20 148 (5.88%) Software Engineering
Programming Languages
1 540 (21.47%) MATLAB
2 110 (4.37%) Python
3 96 (3.82%) PowerShell
4 62 (2.47%) SQL
5 37 (1.47%) JavaScript
6 27 (1.07%) C#
6 27 (1.07%) TypeScript
7 24 (0.95%) Kusto Query Language
8 23 (0.91%) Bash
9 20 (0.80%) C++
10 18 (0.72%) Java
11 16 (0.64%) C
12 10 (0.40%) PHP
13 9 (0.36%) Perl
14 5 (0.20%) Objective-C
15 4 (0.16%) Kotlin
16 3 (0.12%) Progress 4GL
16 3 (0.12%) Ruby
16 3 (0.12%) Rust
16 3 (0.12%) Shell Script
Qualifications
1 1,137 (45.21%) Degree
2 770 (30.62%) BPSS Clearance
3 300 (11.93%) CISSP
4 260 (10.34%) CISM
5 197 (7.83%) Security Cleared
6 151 (6.00%) CESG Certified Professional
7 112 (4.45%) SC Cleared
8 68 (2.70%) Computer Science Degree
9 52 (2.07%) DV Cleared
10 45 (1.79%) Master's Degree
11 41 (1.63%) CEH
11 41 (1.63%) CISA
12 40 (1.59%) DBS Check
13 35 (1.39%) HND
14 31 (1.23%) Cisco Certification
15 29 (1.15%) CRISC
15 29 (1.15%) Network+ Certification
16 27 (1.07%) PMI Certification
17 26 (1.03%) Microsoft Certification
18 25 (0.99%) PMP
Quality Assurance & Compliance
1 384 (15.27%) ISO/IEC 27001
2 335 (13.32%) NIST
3 316 (12.56%) NCSC
4 158 (6.28%) JSP 440
5 148 (5.88%) RMADS
6 102 (4.06%) GDPR
7 92 (3.66%) Cyber Essentials
8 40 (1.59%) Cyber Essentials PLUS
9 29 (1.15%) GRC
10 24 (0.95%) PCI DSS
11 23 (0.91%) SLA
12 21 (0.83%) QA
13 19 (0.76%) ISO/IEC 27002 (supersedes ISO/IEC 17799)
14 17 (0.68%) HIPAA
15 15 (0.60%) Def Stans
16 14 (0.56%) COBIT
17 12 (0.48%) NIST 800
18 10 (0.40%) Accessibility
19 6 (0.24%) PMO
20 5 (0.20%) ISO 26262
System Software
1 277 (11.01%) Active Directory
2 61 (2.43%) VMware Infrastructure
3 58 (2.31%) Virtual Servers
4 44 (1.75%) Hyper-V
5 25 (0.99%) Docker
6 23 (0.91%) Virtual Machines
7 5 (0.20%) Firmware
7 5 (0.20%) Terminal Services
7 5 (0.20%) vSphere
8 3 (0.12%) VMware ESXi
9 2 (0.080%) Virtual Desktop
10 1 (0.040%) Embedded Firmware
10 1 (0.040%) pfSense
10 1 (0.040%) Snort
10 1 (0.040%) Veritas Cluster Server
10 1 (0.040%) VMware NSX
10 1 (0.040%) XenApp
Systems Management
1 55 (2.19%) Microsoft Intune
2 42 (1.67%) Terraform
3 21 (0.83%) Kubernetes
3 21 (0.83%) QRadar
4 19 (0.76%) Ansible
5 17 (0.68%) Single Sign-On
6 11 (0.44%) Nessus
7 10 (0.40%) FortiGate
7 10 (0.40%) Functional Safety
8 6 (0.24%) ArcSight ESM
8 6 (0.24%) SCCM
9 5 (0.20%) CASB
9 5 (0.20%) ZABBIX
10 4 (0.16%) Progress Chef
10 4 (0.16%) SCOM
11 3 (0.12%) Active Directory Federation Services
11 3 (0.12%) Autotask
11 3 (0.12%) Iperf
11 3 (0.12%) Nmap
11 3 (0.12%) Puppet
Vendors
1 480 (19.09%) Microsoft
2 90 (3.58%) Cisco
3 86 (3.42%) VMware
4 41 (1.63%) Google
5 35 (1.39%) Splunk
6 30 (1.19%) Tenable
7 29 (1.15%) IBM
8 28 (1.11%) Thales
9 27 (1.07%) Fortinet
10 25 (0.99%) Siemens
11 23 (0.91%) Qualys
12 19 (0.76%) Apple
13 15 (0.60%) Palo Alto
13 15 (0.60%) ServiceNow
14 14 (0.56%) ArcSight
14 14 (0.56%) Sophos
15 13 (0.52%) Meraki
15 13 (0.52%) SonicWALL
16 12 (0.48%) WatchGuard
17 10 (0.40%) Ping Identity