Azure Jobs in the UK excluding London

Microsoft Azure
UK > UK excluding London

The following table provides summary statistics for permanent job vacancies advertised in the UK excluding London with a requirement for Azure skills. Included is a benchmarking guide to the salaries offered in vacancies that have cited Azure over the 6 months to 1 December 2023 with a comparison to the same period in the previous 2 years.

6 months to
1 Dec 2023
Same period 2022 Same period 2021
Rank 3 4 4
Rank change year-on-year +1 0 0
Permanent jobs citing Azure 6,828 13,638 13,520
As % of all permanent jobs advertised in the UK excluding London 21.49% 20.44% 20.57%
As % of the Cloud Services category 54.08% 52.89% 48.48%
Number of salaries quoted 5,116 8,796 10,252
10th Percentile £32,500 £32,500 £32,500
25th Percentile £41,250 £42,500 £41,250
Median annual salary (50th Percentile) £55,000 £55,000 £54,000
Median % change year-on-year - +1.85% +8.00%
75th Percentile £68,750 £72,500 £68,750
90th Percentile £82,500 £85,000 £80,000
UK median annual salary £62,000 £65,000 £60,000
% change year-on-year -4.62% +8.33% +4.35%

All Cloud Skills
UK excluding London

Azure is in the Cloud Services category. The following table is for comparison with the above and provides summary statistics for all permanent job vacancies advertised in the UK excluding London with a requirement for cloud computing skills.

Permanent vacancies with a requirement for cloud computing skills 12,625 25,786 27,886
As % of all permanent jobs advertised in the UK excluding London 39.73% 38.65% 42.43%
Number of salaries quoted 9,639 17,042 20,948
10th Percentile £30,000 £30,000 £30,000
25th Percentile £39,750 £40,372 £37,500
Median annual salary (50th Percentile) £53,500 £55,000 £52,500
Median % change year-on-year -2.73% +4.76% +5.00%
75th Percentile £70,000 £71,250 £67,500
90th Percentile £82,500 £85,000 £81,250
UK median annual salary £62,500 £64,000 £60,000
% change year-on-year -2.34% +6.67% +4.35%

Azure
Job Vacancy Trend in the UK excluding London

Job postings citing Azure as a proportion of all IT jobs advertised in the UK excluding London.
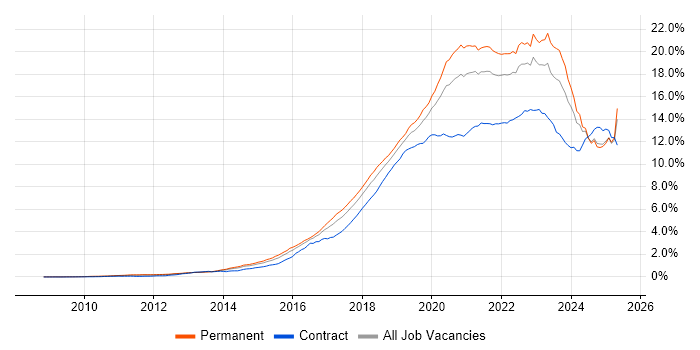
Job vacancy trend for Azure in the UK excluding London

Azure
Salary Trend in the UK excluding London

3-month moving average salary quoted in jobs citing Azure in the UK excluding London.

Salary trend for Azure in the UK excluding London

Azure
Salary Histogram in the UK excluding London

Salary distribution for jobs citing Azure in the UK excluding London over the 6 months to 1 December 2023.

Salary histogram for Azure in the UK excluding London

Azure
Job Locations in the UK excluding London

The table below looks at the demand and provides a guide to the median salaries quoted in IT jobs citing Azure within the UK excluding London region over the 6 months to 1 December 2023. The 'Rank Change' column provides an indication of the change in demand within each location based on the same 6 month period last year.

Location Rank Change
on Same Period
Last Year
Matching
Permanent
IT Job Ads
Median Salary
Past 6 Months
Median Salary
% Change
on Same Period
Last Year
Live
Jobs
North of England -2 1,805 £55,000 -4.35% 733
South East +3 1,536 £55,000 -8.33% 769
Midlands +3 1,255 £53,500 -2.73% 487
South West +4 1,061 £55,000 +4.76% 318
North West -1 941 £57,500 +4.55% 380
Yorkshire -2 767 £52,500 -11.02% 258
West Midlands +3 749 £52,500 -8.70% 303
East Midlands +2 502 £55,000 +4.76% 182
Scotland -3 466 £55,000 -4.35% 163
East of England 0 328 £52,500 -4.55% 244
Wales +1 293 £51,000 -2.86% 108
Northern Ireland 0 123 £46,000 -20.00% 34
North East +1 97 £57,500 +4.55% 104
Channel Islands - 3 £72,500 -
Azure
UK

Azure
Co-occurring Skills and Capabilities in the UK excluding London by Category

The follow tables expand on the table above by listing co-occurrences grouped by category. The same employment type, locality and period is covered with up to 20 co-occurrences shown in each of the following categories:

Application Platforms
1 489 (7.16%) SharePoint
2 147 (2.15%) MS Exchange
3 132 (1.93%) IIS
4 73 (1.07%) Confluence
5 61 (0.89%) CMS
6 60 (0.88%) Umbraco
7 47 (0.69%) Apache Spark
8 37 (0.54%) Apache
9 25 (0.37%) WebSphere
10 23 (0.34%) Tomcat
11 18 (0.26%) FileNet
12 16 (0.23%) Captiva
12 16 (0.23%) nginx
13 13 (0.19%) SAS
14 12 (0.18%) OpenStack
15 11 (0.16%) Kentico
16 10 (0.15%) Apache Airflow
16 10 (0.15%) Sitecore CMS
16 10 (0.15%) Skype for Business
17 8 (0.12%) Headless CMS
Applications
1 263 (3.85%) Microsoft Office
2 99 (1.45%) Microsoft Excel
3 43 (0.63%) Microsoft PowerPoint
4 32 (0.47%) MS Visio
5 22 (0.32%) Microsoft Project
6 10 (0.15%) Trello
7 9 (0.13%) AutoCAD
7 9 (0.13%) PTC Creo
7 9 (0.13%) SOLIDWORKS
8 6 (0.088%) Chatbot
8 6 (0.088%) Simulink
9 3 (0.044%) 1Password
10 2 (0.029%) InfoPath
10 2 (0.029%) LightWave 3D
10 2 (0.029%) Spreadsheet
11 1 (0.015%) Acrobat
11 1 (0.015%) CANalyzer
11 1 (0.015%) SPSS
Business Applications
1 297 (4.35%) Dynamics CRM
2 16 (0.23%) Maximo
3 13 (0.19%) Sparx Enterprise Architect
4 12 (0.18%) Unit4 Business World
5 9 (0.13%) Dynamics NAV
5 9 (0.13%) Shopify
6 7 (0.10%) Remedy ITSM
7 6 (0.088%) Dynamics GP
7 6 (0.088%) SAP S/4HANA
8 5 (0.073%) NetSuite
9 4 (0.059%) Dynamics AX
9 4 (0.059%) SAP ERP
10 3 (0.044%) Oracle Receivables
10 3 (0.044%) Salesforce CRM
10 3 (0.044%) Visualfiles
11 1 (0.015%) Aareon QL
11 1 (0.015%) MIS ActiveH
11 1 (0.015%) OPENHousing
11 1 (0.015%) Payment Gateway
11 1 (0.015%) Sage X3
Cloud Services
1 1,953 (28.60%) AWS
2 1,600 (23.43%) Microsoft 365
3 1,179 (17.27%) Azure DevOps
4 993 (14.54%) Power Platform
5 821 (12.02%) SaaS
6 797 (11.67%) GCP
7 702 (10.28%) PaaS
8 667 (9.77%) Entra ID
9 636 (9.31%) IaaS
10 562 (8.23%) Dynamics 365
11 447 (6.55%) Serverless
12 288 (4.22%) Azure Functions
13 240 (3.51%) Azure Data Factory
14 221 (3.24%) GitHub
15 214 (3.13%) Cloud Computing
16 150 (2.20%) PowerApps
17 126 (1.85%) OneDrive
18 124 (1.82%) OpenShift
19 121 (1.77%) Azure Synapse Analytics
20 120 (1.76%) Azure Sentinel
Communications & Networking
1 747 (10.94%) Firewall
2 631 (9.24%) DNS
3 503 (7.37%) DHCP
4 395 (5.79%) WAN
5 326 (4.77%) TCP/IP
6 303 (4.44%) VPN
7 298 (4.36%) LAN
8 235 (3.44%) SAN
9 172 (2.52%) VLAN
10 166 (2.43%) Wireless
11 141 (2.07%) Wi-Fi
12 131 (1.92%) VoIP
13 120 (1.76%) HTTP
14 115 (1.68%) Network Security
15 91 (1.33%) SD-WAN
16 90 (1.32%) Internet
17 65 (0.95%) SNMP
18 58 (0.85%) BGP
18 58 (0.85%) OSPF
19 48 (0.70%) SSL
Database & Business Intelligence
1 869 (12.73%) SQL Server
2 496 (7.26%) Power BI
3 426 (6.24%) Data Warehouse
4 313 (4.58%) NoSQL
5 233 (3.41%) Data Lake
6 181 (2.65%) SQL Server Integration Services
7 168 (2.46%) Azure SQL Database
8 153 (2.24%) MySQL
8 153 (2.24%) PostgreSQL
9 137 (2.01%) Amazon RDS
10 133 (1.95%) Relational Database
11 114 (1.67%) MongoDB
12 109 (1.60%) SQL Server Reporting Services
13 104 (1.52%) Big Data
14 89 (1.30%) Elasticsearch
15 63 (0.92%) SQL Server Analysis Services
15 63 (0.92%) Tableau
16 57 (0.83%) Amazon Redshift
17 46 (0.67%) Azure SQL Data Warehouse
17 46 (0.67%) Power Query
Development Applications
1 419 (6.14%) Git
2 347 (5.08%) Jenkins
3 242 (3.54%) JIRA
4 119 (1.74%) Selenium
5 93 (1.36%) GitLab
6 85 (1.24%) Visual Studio
7 69 (1.01%) Team Foundation Server
8 62 (0.91%) Cucumber
9 56 (0.82%) Cypress.io
10 45 (0.66%) Maven
11 36 (0.53%) Sonatype Nexus
11 36 (0.53%) Visual Studio Team System
12 33 (0.48%) TeamCity
13 31 (0.45%) Postman
14 30 (0.44%) NUnit
15 28 (0.41%) Visual Studio Code
16 27 (0.40%) Oracle Forms
17 26 (0.38%) SonarQube
17 26 (0.38%) SQL Server Management Studio (SSMS)
18 24 (0.35%) Robot Framework
General
1 1,461 (21.40%) Social Skills
2 1,437 (21.05%) Finance
3 529 (7.75%) Analytical Skills
4 354 (5.18%) Banking
5 258 (3.78%) Retail
6 238 (3.49%) Inclusion and Diversity
7 229 (3.35%) Public Sector
8 227 (3.32%) Law
9 178 (2.61%) Telecoms
10 161 (2.36%) Marketing
11 144 (2.11%) Presentation Skills
12 143 (2.09%) Legal
13 125 (1.83%) Manufacturing
14 121 (1.77%) Organisational Skills
15 105 (1.54%) Aerospace
16 64 (0.94%) Electronics
17 53 (0.78%) Documentation Skills
18 44 (0.64%) Influencing Skills
19 37 (0.54%) Back Office
20 33 (0.48%) Financial Institution
Job Titles
1 1,193 (17.47%) Developer
2 1,048 (15.35%) Architect
3 1,025 (15.01%) Senior
4 540 (7.91%) Infrastructure Engineer
5 513 (7.51%) Lead
6 504 (7.38%) Analyst
7 471 (6.90%) Solutions Architect
8 422 (6.18%) Software Engineer
9 376 (5.51%) Support Engineer
10 349 (5.11%) Azure Engineer
11 342 (5.01%) DevOps Engineer
11 342 (5.01%) Dynamics 365 Architect
12 329 (4.82%) .NET Developer
13 304 (4.45%) IT Engineer
14 275 (4.03%) IT Support
15 270 (3.95%) Cloud Engineer
16 256 (3.75%) Senior Developer
17 255 (3.73%) Data Engineer
18 190 (2.78%) Software Developer
19 183 (2.68%) Dynamics CRM Architect
Libraries, Frameworks & Software Standards
1 1,190 (17.43%) .NET
2 458 (6.71%) React
3 433 (6.34%) AngularJS
4 429 (6.28%) HTML
5 399 (5.84%) CSS
6 387 (5.67%) .NET Core
7 275 (4.03%) ASP.NET
8 269 (3.94%) .NET Framework
9 240 (3.51%) Node.js
10 204 (2.99%) REST
11 155 (2.27%) JSON
12 152 (2.23%) RESTful
13 151 (2.21%) jQuery
14 145 (2.12%) Web Services
15 138 (2.02%) Blazor
16 136 (1.99%) Kafka
17 127 (1.86%) Entity Framework
18 110 (1.61%) Spring
19 108 (1.58%) ASP.NET Web API
20 104 (1.52%) OpenID
Miscellaneous
1 447 (6.55%) Public Cloud
2 262 (3.84%) Data Centre
3 235 (3.44%) Cloud Native
4 198 (2.90%) Product Ownership
5 187 (2.74%) Private Cloud
6 160 (2.34%) Self-Motivation
7 145 (2.12%) Management Information System
8 136 (1.99%) Driving Licence
9 126 (1.85%) Greenfield Project
10 108 (1.58%) Enterprise Software
11 105 (1.54%) Data Structures
12 103 (1.51%) Virtual Team
13 97 (1.42%) Clustering
14 91 (1.33%) Mainframe
15 85 (1.24%) Blockchain
16 80 (1.17%) Onboarding
17 65 (0.95%) Distributed Systems
18 59 (0.86%) PKI
19 58 (0.85%) Hybrid Cloud
19 58 (0.85%) IoT
Operating Systems
1 1,609 (23.56%) Windows
2 876 (12.83%) Windows Server
3 674 (9.87%) Linux
4 259 (3.79%) Windows 10
5 209 (3.06%) Windows Server 2019
6 192 (2.81%) Windows Server 2016
7 173 (2.53%) Unix
8 159 (2.33%) Windows Server 2012
9 125 (1.83%) Android
10 117 (1.71%) Red Hat Enterprise Linux
11 93 (1.36%) Apple iOS
12 68 (1.00%) Mac OS
13 38 (0.56%) Ubuntu
14 33 (0.48%) CentOS
15 26 (0.38%) Windows 8
16 23 (0.34%) Windows 7
16 23 (0.34%) Windows Server 2003
17 22 (0.32%) Windows Server 2008
18 17 (0.25%) Debian
19 11 (0.16%) VMS
Processes & Methodologies
1 2,403 (35.19%) Agile
2 2,273 (33.29%) DevOps
3 1,097 (16.07%) Problem-Solving
4 969 (14.19%) CI/CD
5 965 (14.13%) Actionable Insight
6 782 (11.45%) Mentoring
7 711 (10.41%) Roadmaps
8 693 (10.15%) Software Engineering
9 683 (10.00%) ITIL
10 645 (9.45%) Infrastructure Engineering
11 616 (9.02%) Infrastructure as Code
12 582 (8.52%) Business Intelligence
13 578 (8.47%) Microservices
14 565 (8.27%) Cybersecurity
15 551 (8.07%) Scrum
16 509 (7.45%) Customer Service
17 501 (7.34%) Analytics
18 409 (5.99%) Full Stack Development
19 397 (5.81%) Migration
20 377 (5.52%) CRM
Programming Languages
1 1,592 (23.32%) SQL
2 1,190 (17.43%) C#
3 982 (14.38%) Python
4 900 (13.18%) JavaScript
5 864 (12.65%) PowerShell
6 581 (8.51%) Java
7 361 (5.29%) Bash
8 284 (4.16%) T-SQL
9 234 (3.43%) TypeScript
10 133 (1.95%) Go
11 118 (1.73%) C++
12 86 (1.26%) Bicep
13 78 (1.14%) PHP
14 76 (1.11%) Ruby
15 71 (1.04%) Data Analysis Expressions
16 68 (1.00%) Kotlin
17 51 (0.75%) VBScript
18 48 (0.70%) Perl
19 42 (0.62%) R
20 35 (0.51%) Rust
Qualifications
1 899 (13.17%) Degree
2 798 (11.69%) Security Cleared
3 535 (7.84%) SC Cleared
4 298 (4.36%) Azure Certification
5 274 (4.01%) Microsoft Certification
6 236 (3.46%) Computer Science Degree
7 192 (2.81%) DV Cleared
8 163 (2.39%) TOGAF Certification
9 131 (1.92%) Cisco Certification
10 100 (1.46%) AWS Certification
11 93 (1.36%) CCNA
12 80 (1.17%) DBS Check
13 77 (1.13%) MCSE
14 68 (1.00%) CCNP
15 57 (0.83%) CISSP
16 51 (0.75%) ITIL Foundation Certificate
17 47 (0.69%) MCP
18 44 (0.64%) BPSS Clearance
19 41 (0.60%) ITIL Certification
19 41 (0.60%) MCSA
Quality Assurance & Compliance
1 220 (3.22%) SLA
2 152 (2.23%) QA
3 146 (2.14%) ISO/IEC 27001
4 116 (1.70%) Cyber Essentials
5 101 (1.48%) GDPR
6 77 (1.13%) Data Quality
7 43 (0.63%) Accessibility
7 43 (0.63%) NIST
8 34 (0.50%) PCI DSS
9 29 (0.42%) Cyber Essentials PLUS
10 24 (0.35%) NCSC
11 19 (0.28%) PMO
12 15 (0.22%) COBIT
13 13 (0.19%) ISO 9001
14 8 (0.12%) ISO/IEC 20000
15 7 (0.10%) WCAG
16 6 (0.088%) GRC
16 6 (0.088%) HL7
17 5 (0.073%) DICOM
17 5 (0.073%) RMADS
System Software
1 1,429 (20.93%) Active Directory
2 753 (11.03%) Docker
3 636 (9.31%) VMware Infrastructure
4 523 (7.66%) Hyper-V
5 126 (1.85%) Virtual Machines
6 110 (1.61%) VMware ESXi
7 94 (1.38%) Virtual Desktop
8 83 (1.22%) vSphere
9 53 (0.78%) VMware NSX
10 48 (0.70%) Firmware
11 39 (0.57%) Virtual Servers
12 21 (0.31%) XenApp
13 17 (0.25%) BitLocker
14 16 (0.23%) XenDesktop
15 15 (0.22%) Terminal Services
16 13 (0.19%) Microsoft Virtual Server
17 10 (0.15%) VMware Workstation
18 9 (0.13%) Microsoft App-V
19 8 (0.12%) Oracle RAC
19 8 (0.12%) VMware Server
Systems Management
1 910 (13.33%) Kubernetes
2 731 (10.71%) Terraform
3 558 (8.17%) Microsoft Intune
4 403 (5.90%) Ansible
5 225 (3.30%) SCCM
6 137 (2.01%) Puppet
7 115 (1.68%) SCOM
8 63 (0.92%) Grafana
9 62 (0.91%) FortiGate
10 58 (0.85%) Active Directory Federation Services
11 51 (0.75%) Progress Chef
11 51 (0.75%) WSUS
12 47 (0.69%) Single Sign-On
13 45 (0.66%) vCenter Server
14 36 (0.53%) Prometheus
15 34 (0.50%) Failover Clustering
16 30 (0.44%) Istio
17 24 (0.35%) SCVMM
18 22 (0.32%) Nessus
19 21 (0.31%) Nagios
Vendors
1 3,011 (44.10%) Microsoft
2 948 (13.88%) VMware
3 370 (5.42%) Cisco
4 264 (3.87%) Google
5 252 (3.69%) Oracle
6 217 (3.18%) Citrix
7 189 (2.77%) Databricks
8 144 (2.11%) Veeam
9 115 (1.68%) SAP
10 109 (1.60%) Meraki
11 107 (1.57%) ServiceNow
12 106 (1.55%) Red Hat
13 93 (1.36%) HP
14 81 (1.19%) IBM
15 80 (1.17%) SolarWinds
16 76 (1.11%) CheckPoint
17 70 (1.03%) Palo Alto
18 65 (0.95%) Aruba
18 65 (0.95%) Dell
19 62 (0.91%) Fortinet