AWS Jobs in the UK excluding London

Amazon Web Services (AWS)
UK > UK excluding London

The table below provides summary statistics for permanent job vacancies advertised in the UK excluding London requiring AWS skills. It includes a benchmarking guide to the annual salaries offered in vacancies that cited AWS over the 6 months leading up to 17 July 2025, comparing them to the same period in the previous two years.

6 months to
17 Jul 2025
Same period 2024 Same period 2023
Rank 29 13 12
Rank change year-on-year -16 -1 -2
Permanent jobs citing AWS 2,903 6,407 6,434
As % of all permanent jobs advertised in the UK excluding London 6.71% 8.78% 12.75%
As % of the Cloud Services category 30.73% 28.90% 33.75%
Number of salaries quoted 1,572 3,852 3,864
10th Percentile £39,000 £38,000 £40,000
25th Percentile £49,938 £46,250 £47,500
Median annual salary (50th Percentile) £62,500 £60,000 £62,500
Median % change year-on-year +4.17% -4.00% +4.17%
75th Percentile £77,500 £75,000 £77,715
90th Percentile £91,175 £85,000 £88,750
UK median annual salary £72,500 £70,000 £75,000
% change year-on-year +3.57% -6.67% +3.45%

All Cloud Skills
UK excluding London

AWS falls under the Cloud Services category. For comparison with the information above, the following table provides summary statistics for all permanent job vacancies requiring cloud computing skills in the UK excluding London.

Permanent vacancies with a requirement for cloud computing skills 9,448 22,171 19,062
As % of all permanent jobs advertised in the UK excluding London 21.83% 30.38% 37.77%
Number of salaries quoted 6,447 15,943 12,880
10th Percentile £27,780 £27,500 £30,113
25th Percentile £35,000 £37,500 £40,000
Median annual salary (50th Percentile) £52,500 £52,500 £55,000
Median % change year-on-year - -4.55% +4.76%
75th Percentile £68,750 £67,500 £70,000
90th Percentile £83,750 £81,250 £83,750
UK median annual salary £60,000 £57,500 £62,500
% change year-on-year +4.35% -8.00% -

AWS
Job Vacancy Trend in the UK excluding London

Job postings citing AWS as a proportion of all IT jobs advertised in the UK excluding London.
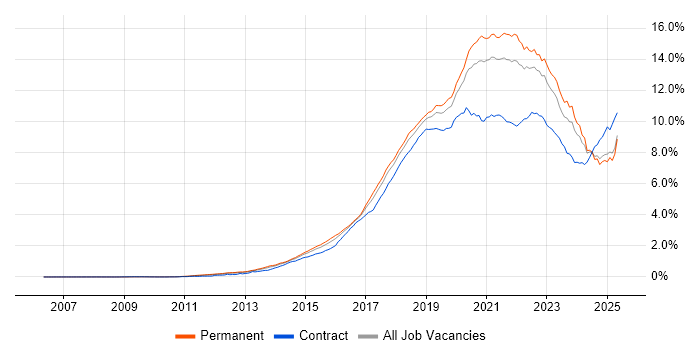
Job vacancy trend for AWS in the UK excluding London

AWS
Salary Trend in the UK excluding London

3-month moving average salary quoted in jobs citing AWS in the UK excluding London.

Salary trend for AWS in the UK excluding London

AWS
Salary Histogram in the UK excluding London

Salary distribution for jobs citing AWS in the UK excluding London over the 6 months to 17 July 2025.

Salary histogram for AWS in the UK excluding London

AWS
Job Locations in the UK excluding London

The table below looks at the demand and provides a guide to the median salaries quoted in IT jobs citing AWS within the UK excluding London region over the 6 months to 17 July 2025. The 'Rank Change' column provides an indication of the change in demand within each location based on the same 6 month period last year.

Location Rank Change
on Same Period
Last Year
Matching
Permanent
IT Job Ads
Median Salary
Past 6 Months
Median Salary
% Change
on Same Period
Last Year
Live
Jobs
North of England -17 967 £65,000 +3.53% 784
North West -11 703 £65,000 +3.53% 457
South East -4 630 £60,000 - 653
Midlands -4 416 £60,250 +0.42% 383
South West -5 307 £60,000 - 286
Scotland -17 298 £60,000 - 204
West Midlands +10 291 £65,000 +8.33% 238
East of England -20 243 £57,500 +4.55% 248
Yorkshire -24 209 £67,500 +12.50% 253
East Midlands -37 124 £58,000 +0.87% 143
North East +1 55 £65,000 -0.71% 81
Wales -44 29 £57,500 +15.00% 74
Northern Ireland -9 26 £55,000 -8.33% 87
Isle of Man +6 1 £34,500 -25.81% 1
AWS
UK

AWS
Co-occurring Skills and Capabilities in the UK excluding London by Category

The follow tables expand on the table above by listing co-occurrences grouped by category. The same employment type, locality and period is covered with up to 20 co-occurrences shown in each of the following categories:

Application Platforms
1 250 (8.61%) Confluence
2 90 (3.10%) Apache Spark
3 48 (1.65%) Apache
4 45 (1.55%) Microsoft Exchange
5 31 (1.07%) Apache Airflow
6 30 (1.03%) IIS
7 20 (0.69%) CMS
8 13 (0.45%) nginx
9 11 (0.38%) Exchange Server 2013
9 11 (0.38%) JBoss
9 11 (0.38%) OpenStack
9 11 (0.38%) SharePoint
9 11 (0.38%) Tomcat
10 10 (0.34%) Headless CMS
10 10 (0.34%) Red Hat Fuse
11 8 (0.28%) Appian
11 8 (0.28%) Camunda
11 8 (0.28%) Oracle Workflow
12 6 (0.21%) SAS
13 5 (0.17%) BizTalk Server
Applications
1 11 (0.38%) Microsoft Office
2 10 (0.34%) Mozilla Thunderbird
3 6 (0.21%) Chatbot
3 6 (0.21%) Microsoft Excel
4 3 (0.10%) Microsoft PowerPoint
4 3 (0.10%) MS Visio
5 2 (0.069%) S-PLUS
5 2 (0.069%) Trello
Business Applications
1 9 (0.31%) Dynamics CRM
2 3 (0.10%) Dynamics AX
2 3 (0.10%) Oracle EBS
3 2 (0.069%) Payment Gateway
4 1 (0.034%) Eloqua
4 1 (0.034%) Infor SunSystems
4 1 (0.034%) Magento
4 1 (0.034%) Maximo
4 1 (0.034%) SAP ERP
4 1 (0.034%) SAP S/4HANA
4 1 (0.034%) Shopify
Cloud Services
1 1,646 (56.70%) Azure
2 911 (31.38%) GCP
3 399 (13.74%) Serverless
4 307 (10.58%) AWS Lambda
5 215 (7.41%) Amazon S3
6 212 (7.30%) SaaS
7 158 (5.44%) Amazon EC2
8 143 (4.93%) Microsoft 365
9 135 (4.65%) Amazon EKS
10 124 (4.27%) Amazon ECS
11 108 (3.72%) GitHub
12 102 (3.51%) AWS CloudFormation
13 96 (3.31%) Amazon CloudWatch
13 96 (3.31%) Power Platform
14 86 (2.96%) Snowflake
15 75 (2.58%) Virtual Private Cloud
16 74 (2.55%) Pulumi
17 69 (2.38%) Azure DevOps
18 64 (2.20%) PaaS
19 63 (2.17%) Entra ID
Communications & Networking
1 234 (8.06%) Firewall
2 175 (6.03%) Broadband
3 130 (4.48%) DNS
4 95 (3.27%) VPN
5 86 (2.96%) WAN
6 68 (2.34%) DHCP
7 64 (2.20%) TCP/IP
8 59 (2.03%) VLAN
9 58 (2.00%) Network Security
10 55 (1.89%) SD-WAN
11 51 (1.76%) SSL
12 49 (1.69%) SSH
13 46 (1.58%) LAN
13 46 (1.58%) SAN
14 32 (1.10%) HTTP
15 25 (0.86%) SMTP
16 23 (0.79%) Internet
17 21 (0.72%) BGP
17 21 (0.72%) Wi-Fi
18 19 (0.65%) OSPF
Database & Business Intelligence
1 433 (14.92%) SQL Server
2 229 (7.89%) PostgreSQL
3 227 (7.82%) NoSQL
4 211 (7.27%) MySQL
5 164 (5.65%) Relational Database
6 128 (4.41%) Amazon RDS
7 121 (4.17%) MongoDB
8 120 (4.13%) Data Warehouse
9 110 (3.79%) RDBMS
10 108 (3.72%) DynamoDB
11 95 (3.27%) Elasticsearch
12 87 (3.00%) Big Data
13 80 (2.76%) Data Lake
14 72 (2.48%) Power BI
15 54 (1.86%) Metadata
16 50 (1.72%) Tableau
17 44 (1.52%) Amazon Redshift
18 34 (1.17%) Amazon Aurora
18 34 (1.17%) BigQuery
19 28 (0.96%) Hadoop
Development Applications
1 401 (13.81%) JIRA
2 340 (11.71%) GitLab
3 302 (10.40%) Git
4 291 (10.02%) Selenium
5 289 (9.96%) Maven
6 277 (9.54%) SonarQube
7 264 (9.09%) Bitbucket
7 264 (9.09%) Cucumber
8 259 (8.92%) Sonatype Nexus
9 230 (7.92%) Jenkins
10 92 (3.17%) JUnit
11 65 (2.24%) Jaeger
12 54 (1.86%) Mockito
13 38 (1.31%) Vagrant
14 33 (1.14%) JMeter
15 25 (0.86%) Jasmine
16 23 (0.79%) TeamCity
17 20 (0.69%) MLflow
18 17 (0.59%) Bitbucket Server
19 15 (0.52%) Postman
General
1 697 (24.01%) Inclusion and Diversity
2 691 (23.80%) Finance
3 671 (23.11%) Social Skills
4 390 (13.43%) Banking
5 370 (12.75%) Analytical Skills
6 248 (8.54%) Law
7 184 (6.34%) Retail
8 172 (5.92%) Public Sector
9 117 (4.03%) Marketing
10 105 (3.62%) Investment Banking
11 90 (3.10%) Corporate Banking
12 72 (2.48%) Manufacturing
13 61 (2.10%) Games
14 52 (1.79%) Legal
15 39 (1.34%) Telecoms
16 38 (1.31%) Organisational Skills
17 31 (1.07%) Influencing Skills
18 29 (1.00%) Presentation Skills
19 25 (0.86%) Automotive
20 24 (0.83%) Electronics
Job Titles
1 739 (25.46%) Software Engineer
2 721 (24.84%) Senior
3 530 (18.26%) Developer
4 397 (13.68%) Lead
5 248 (8.54%) Senior Software Engineer
6 195 (6.72%) Architect
7 174 (5.99%) Senior Developer
8 147 (5.06%) Full-Stack Developer
9 141 (4.86%) DevOps Engineer
10 124 (4.27%) Java Developer
11 114 (3.93%) Cloud Engineer
12 108 (3.72%) Java Engineer
12 108 (3.72%) Software Developer
13 107 (3.69%) AWS Engineer
14 97 (3.34%) Support Engineer
14 97 (3.34%) Team Leader
15 95 (3.27%) Data Engineer
16 90 (3.10%) Machine Learning Engineer
17 86 (2.96%) Java Software Engineer
18 84 (2.89%) Infrastructure Engineer
Libraries, Frameworks & Software Standards
1 629 (21.67%) React
2 448 (15.43%) Spring
3 445 (15.33%) .NET
4 443 (15.26%) Spring Boot
5 428 (14.74%) Node.js
6 405 (13.95%) HTML
7 399 (13.74%) Kafka
8 384 (13.23%) CSS
9 317 (10.92%) RESTful
10 278 (9.58%) JPA
11 266 (9.16%) Redux
12 256 (8.82%) REST
13 219 (7.54%) Hibernate
14 178 (6.13%) AngularJS
15 128 (4.41%) Web Services
16 122 (4.20%) HTML5
17 119 (4.10%) Jest
18 112 (3.86%) CSS3
19 106 (3.65%) Sass
20 92 (3.17%) Elastic Stack
Miscellaneous
1 334 (11.51%) Product Ownership
2 287 (9.89%) Self-Motivation
3 263 (9.06%) Enterprise Software
4 237 (8.16%) Cyberattack
5 195 (6.72%) Linux Command Line
6 193 (6.65%) Cloud Native
7 99 (3.41%) Distributed Systems
7 99 (3.41%) Management Information System
8 91 (3.13%) Public Cloud
9 85 (2.93%) Algorithms
10 83 (2.86%) Mobile App
11 64 (2.20%) Onboarding
12 63 (2.17%) Data Centre
13 54 (1.86%) PKI
14 53 (1.83%) Legacy Systems
15 49 (1.69%) Greenfield Project
16 42 (1.45%) Replication
17 38 (1.31%) Cyber Threat
17 38 (1.31%) IoT
18 36 (1.24%) Hybrid Cloud
Operating Systems
1 592 (20.39%) Linux
2 301 (10.37%) Windows
3 127 (4.37%) Unix
4 113 (3.89%) Windows Server
5 64 (2.20%) Android
6 39 (1.34%) VMS
7 27 (0.93%) Red Hat Enterprise Linux
8 24 (0.83%) Ubuntu
9 20 (0.69%) Amazon Linux
10 15 (0.52%) Mac OS
11 12 (0.41%) Windows Server 2019
12 10 (0.34%) CentOS
13 9 (0.31%) Debian
13 9 (0.31%) Windows Server 2012
14 7 (0.24%) Windows Server 2016
15 6 (0.21%) Apple iOS
16 3 (0.10%) Kali Linux
17 2 (0.069%) Check Point GAiA
17 2 (0.069%) SUSE Linux Enterprise Server
17 2 (0.069%) Windows Server 2008
Processes & Methodologies
1 1,388 (47.81%) Agile
2 1,025 (35.31%) CI/CD
3 995 (34.27%) DevOps
3 995 (34.27%) Software Engineering
4 793 (27.32%) Microservices
5 736 (25.35%) Mentoring
6 615 (21.18%) Containerisation
7 550 (18.95%) Problem-Solving
8 533 (18.36%) Full-Stack Development
9 462 (15.91%) Continuous Improvement
10 461 (15.88%) Machine Learning
11 450 (15.50%) Test Automation
12 444 (15.29%) User Experience
13 403 (13.88%) SDLC
14 365 (12.57%) Data Engineering
14 365 (12.57%) Performance Optimisation
15 356 (12.26%) Roadmaps
16 347 (11.95%) Clean Code
17 345 (11.88%) Cloud Security
18 336 (11.57%) TDD
Programming Languages
1 1,041 (35.86%) Python
2 1,035 (35.65%) Java
3 943 (32.48%) JavaScript
4 795 (27.39%) SQL
5 449 (15.47%) TypeScript
6 322 (11.09%) Go
7 258 (8.89%) C#
8 225 (7.75%) C++
9 211 (7.27%) Rust
10 187 (6.44%) PowerShell
11 164 (5.65%) Bash
12 94 (3.24%) PHP
13 46 (1.58%) Groovy
14 37 (1.27%) Shell Script
15 26 (0.90%) R
16 25 (0.86%) Perl
17 20 (0.69%) T-SQL
18 18 (0.62%) PL/SQL
19 17 (0.59%) Bicep
20 16 (0.55%) Scala
Qualifications
1 517 (17.81%) Security Cleared
2 398 (13.71%) AWS Certification
3 387 (13.33%) Degree
4 285 (9.82%) DV Cleared
5 210 (7.23%) AWS Certified Solutions Architect
5 210 (7.23%) SC Cleared
6 175 (6.03%) AWS Certified Developer
7 121 (4.17%) Computer Science Degree
8 111 (3.82%) Azure Certification
9 79 (2.72%) PhD
10 64 (2.20%) Microsoft Certification
11 49 (1.69%) Cisco Certification
12 43 (1.48%) Master's Degree
13 37 (1.27%) CISSP
14 31 (1.07%) CISM
14 31 (1.07%) TOGAF Certification
15 28 (0.96%) CCNP
16 27 (0.93%) MCP
17 26 (0.90%) CCNA
18 24 (0.83%) MCSE
Quality Assurance & Compliance
1 385 (13.26%) QA
2 150 (5.17%) Accessibility
3 102 (3.51%) Data Quality
4 85 (2.93%) NIST
5 74 (2.55%) ISO/IEC 27001
6 63 (2.17%) GDPR
7 26 (0.90%) HIPAA
8 22 (0.76%) PCI DSS
9 21 (0.72%) Cyber Essentials
10 20 (0.69%) SLA
11 19 (0.65%) NCSC
12 15 (0.52%) Cyber Essentials PLUS
13 14 (0.48%) Sarbanes-Oxley
14 10 (0.34%) California Consumer Privacy Act
15 7 (0.24%) ISO/IEC 20000
16 6 (0.21%) COBIT
16 6 (0.21%) HL7
16 6 (0.21%) SOC 2
17 4 (0.14%) GRC
18 2 (0.069%) IEC 62304
System Software
1 880 (30.31%) Docker
2 203 (6.99%) Active Directory
3 109 (3.75%) VMware Infrastructure
4 97 (3.34%) Hyper-V
5 41 (1.41%) Virtual Machines
6 25 (0.86%) DFS Replication
7 23 (0.79%) VMware ESXi
8 21 (0.72%) vSphere
9 12 (0.41%) Postfix
10 11 (0.38%) HDFS
10 11 (0.38%) Virtual Desktop
11 8 (0.28%) Citrix Hypervisor
11 8 (0.28%) Dovecot
11 8 (0.28%) Firmware
12 6 (0.21%) BitLocker
12 6 (0.21%) Microsoft App-V
12 6 (0.21%) Terminal Services
13 4 (0.14%) Squid
13 4 (0.14%) vCloud
13 4 (0.14%) VMware NSX
Systems Management
1 865 (29.80%) Kubernetes
2 549 (18.91%) Terraform
3 303 (10.44%) Ansible
4 176 (6.06%) Prometheus
5 130 (4.48%) Grafana
6 73 (2.51%) Argo
7 71 (2.45%) Kustomize
8 60 (2.07%) Microsoft Intune
9 40 (1.38%) Puppet
10 32 (1.10%) SCCM
11 30 (1.03%) Kibana
12 24 (0.83%) Single Sign-On
13 18 (0.62%) Kubeflow
14 16 (0.55%) vCenter Server
15 12 (0.41%) Nessus
15 12 (0.41%) Proxmox
15 12 (0.41%) vMotion
16 11 (0.38%) FortiGate
16 11 (0.38%) Nagios
17 9 (0.31%) QRadar
Vendors
1 312 (10.75%) Microsoft
2 261 (8.99%) Google
3 246 (8.47%) Solace
4 152 (5.24%) Oracle
5 148 (5.10%) VMware
6 116 (4.00%) Databricks
7 85 (2.93%) ServiceNow
8 77 (2.65%) Splunk
9 75 (2.58%) Cisco
10 39 (1.34%) Red Hat
11 38 (1.31%) Dynatrace
12 34 (1.17%) Citrix
12 34 (1.17%) SAP
13 33 (1.14%) IBM
13 33 (1.14%) Thales
14 32 (1.10%) Informatica
15 30 (1.03%) Fortinet
16 24 (0.83%) Juniper
16 24 (0.83%) Salesforce
17 22 (0.76%) Atlassian