Client/Server Jobs in the UK excluding London

Client Server
UK > UK excluding London

The table below looks at the prevalence of the term Client/Server in permanent job vacancies advertised in the UK excluding London. Included is a benchmarking guide to the salaries offered in vacancies that have cited Client/Server over the 6 months to 27 April 2024 with a comparison to the same period over the previous 2 years.

6 months to
27 Apr 2024
Same period 2023 Same period 2022
Rank 503 478 671
Rank change year-on-year -25 +193 -123
Permanent jobs citing Client/Server 255 303 170
As % of all permanent jobs advertised in the UK excluding London 0.36% 0.49% 0.24%
As % of the Miscellaneous category 1.07% 1.19% 0.55%
Number of salaries quoted 224 227 95
10th Percentile £32,500 £29,000 £26,450
25th Percentile £39,688 £41,250 £32,500
Median annual salary (50th Percentile) £60,000 £62,500 £47,500
Median % change year-on-year -4.00% +31.58% +18.75%
75th Percentile £77,500 £90,000 £57,500
90th Percentile £87,500 £100,000 £66,500
UK median annual salary £74,500 £72,500 £55,000
% change year-on-year +2.76% +31.82% +4.76%

All Generic Skills
UK excluding London

Client/Server is in the General and Transferable Skills category. The following table is for comparison with the above and provides summary statistics for all permanent job vacancies advertised in the UK excluding London with a requirement for generic IT skills.

Permanent vacancies with a requirement for generic IT skills 23,852 25,466 30,637
As % of all permanent jobs advertised in the UK excluding London 34.05% 41.21% 43.40%
Number of salaries quoted 15,176 11,511 15,839
10th Percentile £26,250 £31,250 £30,000
25th Percentile £35,000 £40,250 £39,750
Median annual salary (50th Percentile) £50,000 £55,000 £52,500
Median % change year-on-year -9.09% +4.76% +5.00%
75th Percentile £65,000 £71,250 £68,750
90th Percentile £80,000 £86,250 £82,500
UK median annual salary £55,000 £65,000 £62,500
% change year-on-year -15.38% +4.00% +4.17%

Client/Server
Job Vacancy Trend in the UK excluding London

Job postings citing Client/Server as a proportion of all IT jobs advertised in the UK excluding London.
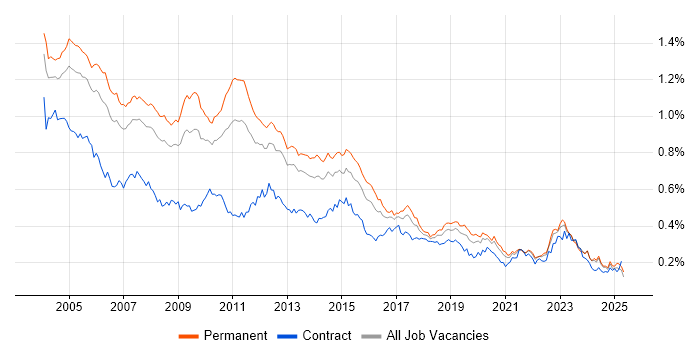
Job vacancy trend for Client/Server in the UK excluding London

Client/Server
Salary Trend in the UK excluding London

3-month moving average salary quoted in jobs citing Client/Server in the UK excluding London.

Salary trend for Client/Server in the UK excluding London

Client/Server
Salary Histogram in the UK excluding London

Salary distribution for jobs citing Client/Server in the UK excluding London over the 6 months to 27 April 2024.

Salary histogram for Client/Server in the UK excluding London

Client/Server
Job Locations in the UK excluding London

The table below looks at the demand and provides a guide to the median salaries quoted in IT jobs citing Client/Server within the UK excluding London region over the 6 months to 27 April 2024. The 'Rank Change' column provides an indication of the change in demand within each location based on the same 6 month period last year.

Location Rank Change
on Same Period
Last Year
Matching
Permanent
IT Job Ads
Median Salary
Past 6 Months
Median Salary
% Change
on Same Period
Last Year
Live
Jobs
East of England +38 73 £70,000 +24.44% 17
North of England +71 69 £65,000 -25.71% 13
South East -31 65 £52,500 -19.23% 30
North East +40 43 £71,500 +155.36% 7
Midlands -11 20 £51,500 -14.17% 4
South West +3 19 £45,000 -47.06% 2
West Midlands +11 15 £37,500 -36.71%
Yorkshire +103 14 £32,500 +4.84% 1
North West -20 12 £55,000 -40.54% 7
East Midlands -18 5 £51,500 -20.77% 4
Scotland -64 5 £63,750 +33.16%
Wales 0 4 £61,500 +37.69% 5
Client/Server
UK

Client/Server
Co-occurring Skills and Capabilities in the UK excluding London by Category

The follow tables expand on the table above by listing co-occurrences grouped by category. The same employment type, locality and period is covered with up to 20 co-occurrences shown in each of the following categories:

Application Platforms
1 15 (5.88%) Microsoft Exchange
2 14 (5.49%) SharePoint
3 13 (5.10%) Apache Airflow
4 10 (3.92%) CMS
5 1 (0.39%) EPiServer
5 1 (0.39%) Exchange Server 2013
Applications
1 17 (6.67%) Microsoft Office
Business Applications
1 2 (0.78%) Dynamics NAV
1 2 (0.78%) Magento
Cloud Services
1 63 (24.71%) AWS
2 62 (24.31%) Azure
3 36 (14.12%) Microsoft 365
4 32 (12.55%) SaaS
5 22 (8.63%) AWS Lambda
5 22 (8.63%) Serverless
6 18 (7.06%) Amazon S3
7 17 (6.67%) GitHub
8 13 (5.10%) Amazon Kinesis
8 13 (5.10%) Azure Sentinel
8 13 (5.10%) dbt
9 10 (3.92%) Azure DevOps
9 10 (3.92%) Entra ID
10 9 (3.53%) AWS CloudFormation
11 8 (3.14%) Amazon ECS
11 8 (3.14%) AWS Elastic Beanstalk
12 6 (2.35%) AWS CodePipeline
13 3 (1.18%) OneDrive
14 2 (0.78%) Salesforce Commerce Cloud
14 2 (0.78%) SAP Commerce Cloud
Communications & Networking
1 35 (13.73%) Firewall
2 16 (6.27%) LAN
2 16 (6.27%) WAN
3 14 (5.49%) DNS
4 13 (5.10%) Intrusion Detection
5 10 (3.92%) TCP/IP
6 9 (3.53%) DHCP
6 9 (3.53%) Extranet
6 9 (3.53%) Internet
6 9 (3.53%) Intranet
7 8 (3.14%) VPN
8 7 (2.75%) FTP
9 5 (1.96%) VLAN
9 5 (1.96%) Wi-Fi
10 3 (1.18%) SAN
10 3 (1.18%) Wireless
11 1 (0.39%) Multicast
Database & Business Intelligence
1 31 (12.16%) MySQL
1 31 (12.16%) Redis
2 14 (5.49%) PostgreSQL
3 13 (5.10%) Amazon Redshift
4 12 (4.71%) Amazon RDS
5 8 (3.14%) Couchbase
5 8 (3.14%) CouchDB
5 8 (3.14%) DynamoDB
5 8 (3.14%) Elasticsearch
6 6 (2.35%) NoSQL
7 4 (1.57%) Data Mining
8 1 (0.39%) Data Warehouse
8 1 (0.39%) Relational Database
8 1 (0.39%) SQL Server
Development Applications
1 16 (6.27%) TeamCity
2 10 (3.92%) Cypress.io
3 8 (3.14%) Gradle
4 7 (2.75%) gulp
4 7 (2.75%) webpack
5 6 (2.35%) Appium
5 6 (2.35%) Bugzilla
5 6 (2.35%) Git
5 6 (2.35%) Jenkins
5 6 (2.35%) JIRA
5 6 (2.35%) Selenium
5 6 (2.35%) Zephyr
6 5 (1.96%) MSBuild
7 4 (1.57%) Protractor
8 2 (0.78%) Android Studio
8 2 (0.78%) Robot Framework
8 2 (0.78%) UI Automator
8 2 (0.78%) Visual Studio
9 1 (0.39%) Subversion
9 1 (0.39%) Visual Studio Team System
General
1 144 (56.47%) Social Skills
2 57 (22.35%) Games
3 33 (12.94%) Automotive
4 23 (9.02%) Analytical Skills
5 18 (7.06%) Presentation Skills
6 16 (6.27%) Finance
7 13 (5.10%) Organisational Skills
8 12 (4.71%) Marketing
9 11 (4.31%) Retail
10 10 (3.92%) Aerospace
11 4 (1.57%) Advertising
11 4 (1.57%) Agriculture
12 3 (1.18%) Public Sector
13 2 (0.78%) Documentation Skills
13 2 (0.78%) Law
14 1 (0.39%) Back Office
14 1 (0.39%) Banking
14 1 (0.39%) Financial Institution
14 1 (0.39%) Influencing Skills
14 1 (0.39%) Manufacturing
Job Titles
1 71 (27.84%) Developer
2 43 (16.86%) Senior
3 37 (14.51%) Lead
4 36 (14.12%) Software Engineer
5 27 (10.59%) C# Developer
6 25 (9.80%) .NET Developer
6 25 (9.80%) Analyst
6 25 (9.80%) AWS Engineer
7 23 (9.02%) C# .NET Developer
7 23 (9.02%) Software Developer
8 21 (8.24%) Consultant
9 20 (7.84%) Senior Developer
10 19 (7.45%) Data Engineer
11 18 (7.06%) C# Software Engineer
12 17 (6.67%) .NET Software Engineer
12 17 (6.67%) Team Leader
13 16 (6.27%) Support Engineer
14 15 (5.88%) AWS Data Engineer
14 15 (5.88%) JavaScript Developer
14 15 (5.88%) Linux Consultant
Libraries, Frameworks & Software Standards
1 52 (20.39%) .NET
2 35 (13.73%) .NET Core
3 20 (7.84%) Vue
4 19 (7.45%) Node.js
5 18 (7.06%) Kafka
6 15 (5.88%) AngularJS
7 14 (5.49%) ASP.NET
7 14 (5.49%) ASP.NET MVC
7 14 (5.49%) RESTful
8 11 (4.31%) REST
9 8 (3.14%) CSS
9 8 (3.14%) GraphQL
9 8 (3.14%) Hibernate
9 8 (3.14%) React
9 8 (3.14%) Sass
9 8 (3.14%) Spring Boot
10 7 (2.75%) HTML
10 7 (2.75%) HTML5
10 7 (2.75%) Web Services
11 6 (2.35%) Middleware
Miscellaneous
1 34 (13.33%) Online Games
2 33 (12.94%) Data Structures
2 33 (12.94%) IoT
3 20 (7.84%) Algorithms
4 19 (7.45%) Cyber Threat
5 18 (7.06%) Blog
5 18 (7.06%) Raspberry Pi
6 16 (6.27%) Management Information System
7 13 (5.10%) Security Operations Centre
8 8 (3.14%) Greenfield Project
8 8 (3.14%) PropTech
9 6 (2.35%) Enterprise Software
9 6 (2.35%) Product Ownership
10 5 (1.96%) Clustering
10 5 (1.96%) Enterprise Storage
10 5 (1.96%) Mobile App
10 5 (1.96%) Onboarding
11 4 (1.57%) Private Cloud
12 3 (1.18%) Mobile Computing
12 3 (1.18%) Self-Motivation
Operating Systems
1 60 (23.53%) Windows
2 43 (16.86%) Linux
3 32 (12.55%) Apple iOS
4 31 (12.16%) Android
5 30 (11.76%) Windows Server
6 8 (3.14%) Windows 10
7 4 (1.57%) Mac OS
7 4 (1.57%) Unix
8 2 (0.78%) Mac OS X
8 2 (0.78%) Red Hat Enterprise Linux
9 1 (0.39%) HPUX
Processes & Methodologies
1 99 (38.82%) Problem-Solving
2 84 (32.94%) Agile
3 59 (23.14%) Computer Science
3 59 (23.14%) Software Engineering
4 42 (16.47%) OOP
5 38 (14.90%) Design Patterns
6 37 (14.51%) Cybersecurity
7 35 (13.73%) Mentoring
8 27 (10.59%) Microservices
9 24 (9.41%) Scrum
10 22 (8.63%) E-Commerce
11 21 (8.24%) Business Development
11 21 (8.24%) CI/CD
12 20 (7.84%) DevOps
13 19 (7.45%) Commercial Awareness
13 19 (7.45%) ETL
14 18 (7.06%) Customer Engagement
14 18 (7.06%) Multithreaded Programming
14 18 (7.06%) Multithreading
15 17 (6.67%) Data Ingestion
Programming Languages
1 61 (23.92%) C#
1 61 (23.92%) SQL
2 38 (14.90%) TypeScript
3 36 (14.12%) JavaScript
4 35 (13.73%) Python
5 25 (9.80%) Java
6 17 (6.67%) C
7 15 (5.88%) PowerShell
8 8 (3.14%) C++
8 8 (3.14%) T-SQL
9 5 (1.96%) Rust
10 4 (1.57%) PHP
11 3 (1.18%) Swift
12 2 (0.78%) Kotlin
12 2 (0.78%) Objective-C
12 2 (0.78%) Scala
12 2 (0.78%) VBScript
Qualifications
1 58 (22.75%) Degree
2 21 (8.24%) Computer Science Degree
3 18 (7.06%) Security Cleared
4 15 (5.88%) SC Cleared
5 13 (5.10%) CISSP
5 13 (5.10%) CompTIA Security+
6 10 (3.92%) DV Cleared
7 6 (2.35%) PhD
8 5 (1.96%) PMI Certification
8 5 (1.96%) PMP
8 5 (1.96%) RHCE
8 5 (1.96%) RHCSA
9 2 (0.78%) Master's Degree
10 1 (0.39%) ACCA
10 1 (0.39%) CFA
10 1 (0.39%) CISA
10 1 (0.39%) ISEB
10 1 (0.39%) ISTQB
10 1 (0.39%) Postgraduate
Quality Assurance & Compliance
1 21 (8.24%) QA
2 13 (5.10%) Data Quality
3 6 (2.35%) GDPR
4 1 (0.39%) GRC
4 1 (0.39%) ISO/IEC 27001
4 1 (0.39%) ISO/IEC 27002 (supersedes ISO/IEC 17799)
4 1 (0.39%) NIST
4 1 (0.39%) PCI DSS
4 1 (0.39%) SLA
System Software
1 28 (10.98%) Docker
2 26 (10.20%) Active Directory
3 24 (9.41%) Hyper-V
4 13 (5.10%) VMware Infrastructure
5 2 (0.78%) VMware ESXi
6 1 (0.39%) Virtual Machines
Systems Management
1 25 (9.80%) Kubernetes
2 21 (8.24%) Terraform
3 14 (5.49%) Microsoft Intune
4 5 (1.96%) Failover Clustering
4 5 (1.96%) HP Quality Center
4 5 (1.96%) Rancher
5 2 (0.78%) Jamf Pro
6 1 (0.39%) Grafana
6 1 (0.39%) Prometheus
Vendors
1 63 (24.71%) Microsoft
2 27 (10.59%) VMware
3 8 (3.14%) Cisco
3 8 (3.14%) Xamarin
4 7 (2.75%) Meraki
5 6 (2.35%) HP
5 6 (2.35%) Sage
5 6 (2.35%) Workday
6 5 (1.96%) Dell
6 5 (1.96%) EqualLogic
6 5 (1.96%) NetApp
6 5 (1.96%) Nimble Storage
7 2 (0.78%) QNX
7 2 (0.78%) Salesforce
7 2 (0.78%) SAP
7 2 (0.78%) Veeam
8 1 (0.39%) Optimizely
8 1 (0.39%) QAD