Analytical Skills Jobs in the UK excluding London

Analytical Skills
UK > UK excluding London

The table below looks at the prevalence of the term Analytical Skills in permanent job vacancies advertised in the UK excluding London. Included is a benchmarking guide to the salaries offered in vacancies that have cited Analytical Skills over the 6 months to 2 December 2023 with a comparison to the same period over the previous 2 years.
6 months to
2 Dec 2023
Same period 2022 Same period 2021
Rank 24 19 22
Rank change year-on-year -5 +3 +17
Permanent jobs citing Analytical Skills 2,794 6,963 5,748
As % of all permanent jobs advertised in the UK excluding London 8.84% 10.40% 8.76%
As % of the General category 13.76% 15.48% 15.34%
Number of salaries quoted 1,885 3,373 3,239
10th Percentile £28,500 £28,250 £27,500
25th Percentile £37,500 £35,427 £34,242
Median annual salary (50th Percentile) £50,000 £47,900 £47,000
Median % change year-on-year +4.38% +1.91% +2.36%
75th Percentile £65,000 £62,500 £60,000
90th Percentile £73,750 £75,000 £75,000
UK median annual salary £57,000 £55,000 £53,500
% change year-on-year +3.64% +2.80% +5.94%

All General Skills
UK excluding London

Analytical Skills is in the General Skills category. The following table is for comparison with the above and provides summary statistics for all permanent job vacancies advertised in the UK excluding London with a requirement for common skills.

Permanent vacancies with a requirement for common skills 20,301 44,972 37,475
As % of all permanent jobs advertised in the UK excluding London 64.24% 67.20% 57.09%
Number of salaries quoted 13,407 23,144 23,038
10th Percentile £26,500 £29,000 £27,500
25th Percentile £36,250 £37,750 £36,250
Median annual salary (50th Percentile) £50,000 £52,500 £49,500
Median % change year-on-year -4.76% +6.06% +4.21%
75th Percentile £67,500 £67,500 £63,750
90th Percentile £82,500 £82,500 £77,500
UK median annual salary £60,000 £60,000 £57,500
% change year-on-year - +4.35% +4.55%

Analytical Skills
Job Vacancy Trend in the UK excluding London

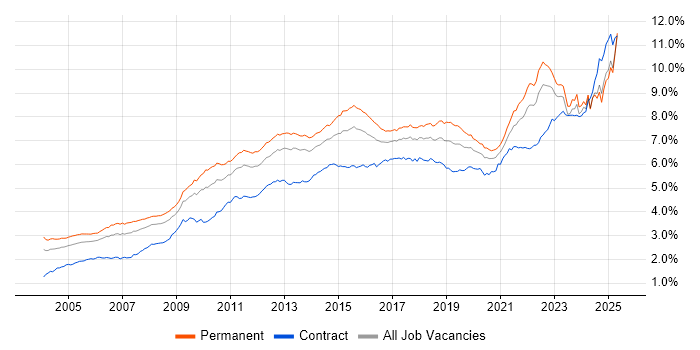
Job postings citing Analytical Skills as a proportion of all IT jobs advertised in the UK excluding London.

Job vacancy trend for Analytical Skills in the UK excluding London

Analytical Skills
Salary Trend in the UK excluding London

3-month moving average salary quoted in jobs citing Analytical Skills in the UK excluding London.

Salary trend for Analytical Skills in the UK excluding London

Analytical Skills
Salary Histogram in the UK excluding London

Salary distribution for jobs citing Analytical Skills in the UK excluding London over the 6 months to 2 December 2023.

Salary histogram for Analytical Skills in the UK excluding London

Analytical Skills
Job Locations in the UK excluding London

The table below looks at the demand and provides a guide to the median salaries quoted in IT jobs citing Analytical Skills within the UK excluding London region over the 6 months to 2 December 2023. The 'Rank Change' column provides an indication of the change in demand within each location based on the same 6 month period last year.

Location Rank Change
on Same Period
Last Year
Matching
Permanent
IT Job Ads
Median Salary
Past 6 Months
Median Salary
% Change
on Same Period
Last Year
Live
Jobs
North of England +9 687 £50,000 +7.53% 672
South East -2 667 £50,000 -4.76% 604
Midlands -4 510 £50,000 +4.70% 402
West Midlands -1 404 £50,000 +6.38% 272
North West +8 343 £50,000 +11.11% 417
Yorkshire -1 303 £54,000 +8.00% 176
South West -22 275 £47,500 +5.56% 283
East of England +5 220 £50,000 - 257
Scotland -18 208 £57,500 +21.05% 144
Wales +2 197 £43,067 -0.31% 47
East Midlands -15 111 £50,000 - 130
North East +10 41 £40,500 -12.43% 87
Northern Ireland +2 37 £42,288 -4.97% 50
Isle of Man +2 10 £45,000 -37.93% 1
Channel Islands - 4 £47,000 -
Analytical Skills
UK

Analytical Skills
Co-occurring Skills and Capabilities in the UK excluding London by Category

The follow tables expand on the table above by listing co-occurrences grouped by category. The same employment type, locality and period is covered with up to 20 co-occurrences shown in each of the following categories:

Application Platforms
1 94 (3.36%) WebLogic
2 72 (2.58%) Confluence
3 61 (2.18%) SAS
4 53 (1.90%) SharePoint
5 44 (1.57%) IIS
6 32 (1.15%) Apache Spark
7 29 (1.04%) Apache
8 19 (0.68%) CMS
9 18 (0.64%) WebSphere
10 17 (0.61%) WebSphere Application Server
11 15 (0.54%) Tomcat
12 10 (0.36%) Oracle Application Server
13 9 (0.32%) WordPress
14 8 (0.29%) Oracle Service Bus
15 6 (0.21%) Umbraco
16 5 (0.18%) Apache Airflow
16 5 (0.18%) MS Exchange
16 5 (0.18%) ThingWorx
17 4 (0.14%) Adobe Experience Manager
17 4 (0.14%) OpenStack
Applications
1 265 (9.48%) Microsoft Excel
2 211 (7.55%) Microsoft Office
3 91 (3.26%) Microsoft PowerPoint
4 38 (1.36%) MS Visio
5 33 (1.18%) Microsoft Project
6 13 (0.47%) Windchill
7 8 (0.29%) AutoCAD
7 8 (0.29%) Spreadsheet
8 6 (0.21%) SPSS
8 6 (0.21%) Trello
9 5 (0.18%) Autodesk Inventor
9 5 (0.18%) SOLIDWORKS
10 4 (0.14%) Simulink
11 2 (0.072%) EViews
12 1 (0.036%) Chatbot
12 1 (0.036%) FileZilla
12 1 (0.036%) ProjectWise
12 1 (0.036%) PTC Creo
12 1 (0.036%) Stateflow
Business Applications
1 30 (1.07%) Dynamics CRM
2 20 (0.72%) NetSuite
3 13 (0.47%) SAP S/4HANA
4 12 (0.43%) Dynamics NAV
5 10 (0.36%) Remedy ITSM
6 7 (0.25%) Dynamics AX
7 5 (0.18%) IBM Planning Analytics
7 5 (0.18%) Shopify
8 4 (0.14%) Front Arena
8 4 (0.14%) Infor M3
8 4 (0.14%) ProductWriter
9 3 (0.11%) Cognos Controller
9 3 (0.11%) SAP GRC
10 2 (0.072%) Cognos Planning
10 2 (0.072%) Hyperion Planning
10 2 (0.072%) Oracle EBS
10 2 (0.072%) Sage 200
10 2 (0.072%) Sage X3
10 2 (0.072%) SAP ERP
10 2 (0.072%) SAP GTS
Cloud Services
1 527 (18.86%) Azure
2 407 (14.57%) Power Platform
3 224 (8.02%) AWS
4 160 (5.73%) Microsoft 365
5 124 (4.44%) Azure DevOps
6 113 (4.04%) SaaS
7 98 (3.51%) GCP
8 52 (1.86%) Dynamics 365
9 49 (1.75%) Google Analytics
10 46 (1.65%) Entra ID
11 44 (1.57%) PowerApps
12 42 (1.50%) Serverless
13 38 (1.36%) Power Automate
14 33 (1.18%) Azure Data Factory
14 33 (1.18%) GitHub
14 33 (1.18%) WhatsApp
15 32 (1.15%) Snowflake
16 31 (1.11%) Azure Synapse Analytics
17 30 (1.07%) Cloud Computing
18 25 (0.89%) PaaS
Communications & Networking
1 149 (5.33%) Firewall
2 120 (4.29%) VPN
3 118 (4.22%) WAN
4 115 (4.12%) DNS
5 107 (3.83%) TCP/IP
6 104 (3.72%) Network Security
7 98 (3.51%) LAN
8 94 (3.36%) Internet
9 79 (2.83%) DHCP
10 63 (2.25%) HTTP
11 58 (2.08%) Wireless
12 44 (1.57%) Intrusion Detection
13 42 (1.50%) SMTP
14 39 (1.40%) FTP
15 35 (1.25%) SAN
16 33 (1.18%) Sourcefire
16 33 (1.18%) Structured Cabling
17 28 (1.00%) BGP
18 26 (0.93%) Wi-Fi
19 25 (0.89%) OSPF
Database & Business Intelligence
1 381 (13.64%) Power BI
2 215 (7.70%) SQL Server
3 118 (4.22%) Data Warehouse
4 105 (3.76%) Tableau
5 97 (3.47%) MySQL
6 94 (3.36%) PostgreSQL
7 90 (3.22%) Elasticsearch
8 65 (2.33%) Looker
9 59 (2.11%) Relational Database
10 55 (1.97%) SQL Server Reporting Services
11 53 (1.90%) Data Lake
12 52 (1.86%) MongoDB
13 46 (1.65%) SQL Server Integration Services
14 43 (1.54%) Amazon RDS
15 41 (1.47%) Data Hub
16 40 (1.43%) Power Query
17 34 (1.22%) Azure SQL Database
17 34 (1.22%) Star Schema
18 31 (1.11%) BusinessObjects
19 29 (1.04%) Big Data
Development Applications
1 162 (5.80%) JIRA
2 131 (4.69%) Git
3 38 (1.36%) Selenium
4 33 (1.18%) GitLab
5 30 (1.07%) Jenkins
6 28 (1.00%) Sonatype Nexus
7 23 (0.82%) Robot Framework
8 14 (0.50%) Cucumber
8 14 (0.50%) Visual Studio
9 13 (0.47%) Oracle APEX
10 9 (0.32%) Postman
11 8 (0.29%) AutoIt
11 8 (0.29%) Cypress.io
11 8 (0.29%) eggPlant
11 8 (0.29%) JMeter
11 8 (0.29%) LabVIEW
12 7 (0.25%) Subversion
13 6 (0.21%) ERwin
13 6 (0.21%) SoapUI
14 5 (0.18%) LoadRunner
General
1 1,339 (47.92%) Social Skills
2 785 (28.10%) Finance
3 318 (11.38%) Retail
4 252 (9.02%) Banking
5 242 (8.66%) Marketing
6 227 (8.12%) Manufacturing
7 144 (5.15%) Legal
8 141 (5.05%) Presentation Skills
9 112 (4.01%) Organisational Skills
10 107 (3.83%) Inclusion and Diversity
11 103 (3.69%) Public Sector
12 93 (3.33%) Law
13 80 (2.86%) Telecoms
14 76 (2.72%) Automotive
15 71 (2.54%) Electronics
16 65 (2.33%) Influencing Skills
17 58 (2.08%) Games
18 50 (1.79%) Local Government
19 48 (1.72%) Aerospace
20 41 (1.47%) Advertising
Job Titles
1 923 (33.04%) Analyst
2 408 (14.60%) Senior
3 251 (8.98%) Developer
4 174 (6.23%) Senior Analyst
5 168 (6.01%) Support Analyst
6 160 (5.73%) Lead
7 156 (5.58%) Applications Support
8 140 (5.01%) Business Analyst
9 132 (4.72%) Applications Support Analyst
10 103 (3.69%) Architect
11 99 (3.54%) Data Analyst
12 92 (3.29%) Consultant
13 81 (2.90%) Support Engineer
14 79 (2.83%) Software Engineer
15 72 (2.58%) Senior Applications Support
16 62 (2.22%) IT Manager
17 61 (2.18%) Senior Support Analyst
18 58 (2.08%) Graduate
18 58 (2.08%) Senior Applications Support Analyst
18 58 (2.08%) Senior Developer
Libraries, Frameworks & Software Standards
1 191 (6.84%) .NET
2 171 (6.12%) HTML
3 147 (5.26%) CSS
4 109 (3.90%) AngularJS
5 103 (3.69%) Spring
6 98 (3.51%) React
7 87 (3.11%) Java EE
8 84 (3.01%) J2EE
9 81 (2.90%) Node.js
10 75 (2.68%) RESTful
11 57 (2.04%) XML
12 50 (1.79%) ModSecurity
12 50 (1.79%) REST
13 46 (1.65%) Express.js
14 43 (1.54%) ASP.NET
15 42 (1.50%) Web Services
16 40 (1.43%) MEAN Stack
17 39 (1.40%) JSON
17 39 (1.40%) MERN Stack
18 38 (1.36%) LDAP
Miscellaneous
1 241 (8.63%) Management Information System
2 235 (8.41%) Self-Motivation
3 177 (6.34%) Analytical Mindset
4 98 (3.51%) Product Ownership
5 62 (2.22%) Greenfield Project
6 60 (2.15%) Data Structures
7 57 (2.04%) IoT
8 55 (1.97%) Data Centre
9 53 (1.90%) Cyber Threat
10 51 (1.83%) NHS
11 42 (1.50%) Algorithms
12 39 (1.40%) Security Operations Centre
13 37 (1.32%) Credit Risk
14 36 (1.29%) Cloud Native
15 34 (1.22%) Public Cloud
16 33 (1.18%) PKI
17 32 (1.15%) Mali
18 29 (1.04%) Onboarding
19 28 (1.00%) Smartphone
20 27 (0.97%) CMDB
Operating Systems
1 346 (12.38%) Windows
2 189 (6.76%) Linux
3 155 (5.55%) Unix
4 152 (5.44%) Windows Server
5 81 (2.90%) Android
6 47 (1.68%) Windows 10
7 39 (1.40%) Red Hat Enterprise Linux
8 31 (1.11%) Windows Server 2019
9 26 (0.93%) Windows Server 2016
10 18 (0.64%) Solaris
11 15 (0.54%) Mac OS
12 13 (0.47%) Windows Server 2012
13 9 (0.32%) Apple iOS
13 9 (0.32%) HPUX
13 9 (0.32%) Mac OS X
14 8 (0.29%) Windows 7
15 6 (0.21%) Embedded Linux
16 5 (0.18%) CentOS
17 4 (0.14%) Windows Server 2008
18 3 (0.11%) Windows 8
Processes & Methodologies
1 1,447 (51.79%) Problem-Solving
2 717 (25.66%) Agile
3 485 (17.36%) Analytics
4 461 (16.50%) Business Intelligence
5 341 (12.20%) ITIL
6 337 (12.06%) Project Management
7 323 (11.56%) Actionable Insight
8 313 (11.20%) Decision-Making
9 283 (10.13%) DevOps
10 274 (9.81%) Customer Service
11 259 (9.27%) Stakeholder Management
12 244 (8.73%) Continuous Improvement
13 238 (8.52%) Visualisation
14 235 (8.41%) Computer Science
15 230 (8.23%) Data Analysis
16 196 (7.02%) Mentoring
16 196 (7.02%) Service Management
17 190 (6.80%) Project Delivery
18 178 (6.37%) Analytical Thinking
19 176 (6.30%) ERP
Programming Languages
1 575 (20.58%) SQL
2 324 (11.60%) Python
3 187 (6.69%) Java
3 187 (6.69%) JavaScript
4 174 (6.23%) C#
5 152 (5.44%) PowerShell
6 90 (3.22%) C++
7 67 (2.40%) Shell Script
8 62 (2.22%) R
9 60 (2.15%) T-SQL
10 58 (2.08%) C
11 56 (2.00%) PHP
12 49 (1.75%) TypeScript
13 39 (1.40%) Data Analysis Expressions
14 35 (1.25%) VBA
15 34 (1.22%) Bash
16 31 (1.11%) PL/SQL
17 24 (0.86%) VBScript
18 23 (0.82%) MATLAB
19 10 (0.36%) Scala
Qualifications
1 795 (28.45%) Degree
2 368 (13.17%) Security Cleared
3 200 (7.16%) SC Cleared
4 127 (4.55%) Computer Science Degree
5 86 (3.08%) CISSP
6 80 (2.86%) CISM
7 77 (2.76%) Master's Degree
8 60 (2.15%) CISA
9 57 (2.04%) CRISC
10 52 (1.86%) Cisco Certification
11 49 (1.75%) Microsoft Certification
12 42 (1.50%) ITIL Certification
13 34 (1.22%) CCNA
14 32 (1.15%) Azure Certification
15 30 (1.07%) PMI Certification
16 29 (1.04%) PhD
17 28 (1.00%) DBS Check
17 28 (1.00%) DV Cleared
18 21 (0.75%) HND
19 17 (0.61%) Numerate Degree
Quality Assurance & Compliance
1 147 (5.26%) SLA
2 115 (4.12%) QA
3 99 (3.54%) ISO/IEC 27001
4 89 (3.19%) NIST
5 86 (3.08%) Data Quality
6 70 (2.51%) GRC
7 55 (1.97%) GDPR
8 51 (1.83%) ISO 22301
9 44 (1.57%) Actionable Recommendations
10 36 (1.29%) PMO
11 30 (1.07%) Cyber Essentials
12 18 (0.64%) Accessibility
13 14 (0.50%) CRD IV
13 14 (0.50%) PCI DSS
13 14 (0.50%) Sarbanes-Oxley
14 12 (0.43%) IFRS
14 12 (0.43%) IFRS 9
15 9 (0.32%) Cyber Essentials PLUS
15 9 (0.32%) GxP
15 9 (0.32%) ISO 9001
System Software
1 171 (6.12%) Active Directory
2 92 (3.29%) VMware Infrastructure
3 47 (1.68%) Docker
4 31 (1.11%) Firmware
5 22 (0.79%) vSphere
6 20 (0.72%) Hyper-V
7 14 (0.50%) Embedded Firmware
7 14 (0.50%) Virtual Machines
8 12 (0.43%) Virtual Servers
9 8 (0.29%) Oracle RAC
10 7 (0.25%) Virtual Desktop
10 7 (0.25%) VMware NSX
11 3 (0.11%) Microsoft Virtual Server
11 3 (0.11%) Time Sharing Option
11 3 (0.11%) XenApp
12 2 (0.072%) Apache Flume
12 2 (0.072%) Kamailio
12 2 (0.072%) OpenSIPS
12 2 (0.072%) XenDesktop
13 1 (0.036%) HDFS
Systems Management
1 89 (3.19%) Single Sign-On
2 83 (2.97%) OpenSSO
3 59 (2.11%) Kubernetes
4 39 (1.40%) FortiGate
5 33 (1.18%) SCCM
6 27 (0.97%) Terraform
7 26 (0.93%) AirWatch
8 23 (0.82%) Ansible
9 22 (0.79%) Microsoft Intune
10 11 (0.39%) Oracle RMAN
11 10 (0.36%) Nessus
12 8 (0.29%) Data Guard
13 7 (0.25%) Puppet
14 4 (0.14%) Istio
14 4 (0.14%) vRealize
14 4 (0.14%) vRealize Orchestrator
15 3 (0.11%) Computer Emergency Response Teams
15 3 (0.11%) Functional Safety
15 3 (0.11%) Grafana
15 3 (0.11%) SCOM
Vendors
1 615 (22.01%) Microsoft
2 169 (6.05%) Oracle
3 111 (3.97%) Cisco
4 104 (3.72%) VMware
5 102 (3.65%) Google
6 95 (3.40%) SAP
7 78 (2.79%) Salesforce
7 78 (2.79%) ServiceNow
8 70 (2.51%) Remedy
9 67 (2.40%) IBM
10 58 (2.08%) Databricks
11 57 (2.04%) HP
11 57 (2.04%) Juniper
12 54 (1.93%) Splunk
13 53 (1.90%) CA
14 42 (1.50%) F5
15 39 (1.40%) Dell
16 38 (1.36%) CheckPoint
17 33 (1.18%) ArcSight
17 33 (1.18%) TippingPoint