Roadmaps Jobs in the UK excluding London

Roadmaps
UK > UK excluding London

The following table provides summary statistics for permanent job vacancies advertised in the UK excluding London with a requirement for Roadmaps skills. Included is a benchmarking guide to the salaries offered in vacancies that have cited Roadmaps over the 6 months to 2 December 2023 with a comparison to the same period in the previous 2 years.

6 months to
2 Dec 2023
Same period 2022 Same period 2021
Rank 34 24 39
Rank change year-on-year -10 +15 +3
Permanent jobs citing Roadmaps 2,124 5,696 4,399
As % of all permanent jobs advertised in the UK excluding London 6.72% 8.51% 6.70%
As % of the Processes & Methodologies category 7.12% 8.91% 7.06%
Number of salaries quoted 1,273 3,168 3,077
10th Percentile £43,750 £38,999 £38,750
25th Percentile £55,000 £49,938 £47,500
Median annual salary (50th Percentile) £67,500 £65,000 £62,500
Median % change year-on-year +3.85% +4.00% +8.70%
75th Percentile £84,056 £80,000 £77,500
90th Percentile £96,539 £95,000 £93,750
UK median annual salary £75,000 £72,500 £70,000
% change year-on-year +3.45% +3.57% +7.69%

All Process and Methodology Skills
UK excluding London

Roadmaps is in the Processes and Methodologies category. The following table is for comparison with the above and provides summary statistics for all permanent job vacancies advertised in the UK excluding London with a requirement for process or methodology skills.

Permanent vacancies with a requirement for process or methodology skills 29,811 63,945 62,308
As % of all permanent jobs advertised in the UK excluding London 94.34% 95.55% 94.92%
Number of salaries quoted 20,318 36,435 42,343
10th Percentile £28,500 £30,822 £29,750
25th Percentile £38,750 £40,000 £37,500
Median annual salary (50th Percentile) £52,500 £53,000 £50,000
Median % change year-on-year -0.94% +6.00% +4.17%
75th Percentile £67,500 £69,000 £65,000
90th Percentile £82,500 £82,970 £78,750
UK median annual salary £60,000 £60,000 £60,000
% change year-on-year - - +9.09%

Roadmaps
Job Vacancy Trend in the UK excluding London

Job postings citing Roadmaps as a proportion of all IT jobs advertised in the UK excluding London.
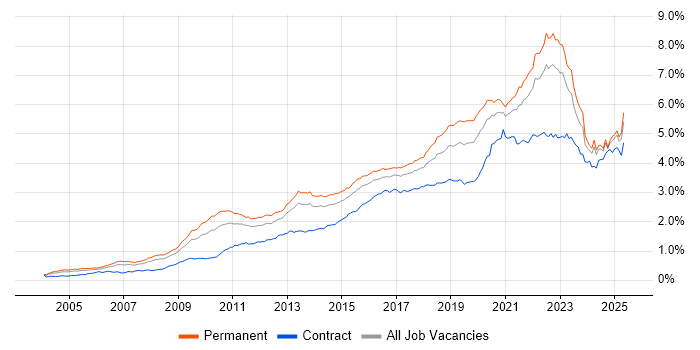
Job vacancy trend for Roadmaps in the UK excluding London

Roadmaps
Salary Trend in the UK excluding London

3-month moving average salary quoted in jobs citing Roadmaps in the UK excluding London.

Salary trend for Roadmaps in the UK excluding London

Roadmaps
Salary Histogram in the UK excluding London

Salary distribution for jobs citing Roadmaps in the UK excluding London over the 6 months to 2 December 2023.

Salary histogram for Roadmaps in the UK excluding London

Roadmaps
Job Locations in the UK excluding London

The table below looks at the demand and provides a guide to the median salaries quoted in IT jobs citing Roadmaps within the UK excluding London region over the 6 months to 2 December 2023. The 'Rank Change' column provides an indication of the change in demand within each location based on the same 6 month period last year.

Location Rank Change
on Same Period
Last Year
Matching
Permanent
IT Job Ads
Median Salary
Past 6 Months
Median Salary
% Change
on Same Period
Last Year
Live
Jobs
North of England +2 648 £67,500 +3.85% 301
South East -16 410 £65,000 -4.06% 257
North West +1 334 £66,757 +11.26% 180
South West -4 328 £65,000 +9.20% 106
Midlands -9 303 £62,500 +4.17% 180
Yorkshire -5 272 £72,500 +4.40% 84
Scotland -16 206 £79,632 +22.51% 61
West Midlands -16 192 £68,750 +14.58% 134
East of England +5 141 £72,500 +29.00% 118
East Midlands -7 110 £57,500 -4.96% 46
Wales -12 73 £67,759 +12.93% 20
North East +16 44 £60,000 -4.00% 38
Northern Ireland +34 28 £85,000 +112.50% 9
Channel Islands - 1 - -
Roadmaps
UK

Roadmaps
Co-occurring Skills and Capabilities in the UK excluding London by Category

The follow tables expand on the table above by listing co-occurrences grouped by category. The same employment type, locality and period is covered with up to 20 co-occurrences shown in each of the following categories:

Application Platforms
1 52 (2.45%) SharePoint
2 22 (1.04%) Confluence
3 9 (0.42%) CMS
4 4 (0.19%) ArcGIS
4 4 (0.19%) ArcSDE
4 4 (0.19%) nginx
4 4 (0.19%) Oracle SOA Suite
4 4 (0.19%) SharePoint 2010
4 4 (0.19%) SharePoint 2013
5 3 (0.14%) Alfresco
5 3 (0.14%) Apache Spark
6 2 (0.094%) Adobe Experience Manager
6 2 (0.094%) Documentum
6 2 (0.094%) Drupal
6 2 (0.094%) FileNet
6 2 (0.094%) IIS
6 2 (0.094%) MS Exchange
6 2 (0.094%) OpenStack
7 1 (0.047%) Apache
7 1 (0.047%) JBoss
Applications
1 19 (0.89%) Microsoft Excel
1 19 (0.89%) Microsoft Office
2 10 (0.47%) Microsoft PowerPoint
3 9 (0.42%) Simulink
4 7 (0.33%) MS Visio
5 5 (0.24%) Chatbot
6 4 (0.19%) Autodesk Inventor
7 3 (0.14%) Microsoft Project
7 3 (0.14%) Windchill
8 2 (0.094%) Mathcad
8 2 (0.094%) Trello
8 2 (0.094%) UserZoom
9 1 (0.047%) CANalyzer
9 1 (0.047%) Oracle Smart View
9 1 (0.047%) Siemens NX
9 1 (0.047%) Sketch
9 1 (0.047%) Spreadsheet
Business Applications
1 197 (9.27%) Dynamics CRM
2 37 (1.74%) SAP S/4HANA
3 24 (1.13%) Unit4 Business World
4 18 (0.85%) SAP ERP
5 6 (0.28%) Oracle EBS
6 4 (0.19%) Maximo
6 4 (0.19%) SAP BPC
6 4 (0.19%) SAP CO
6 4 (0.19%) SAP FI
6 4 (0.19%) SAP FI/CO
6 4 (0.19%) SAP MM
6 4 (0.19%) Teamcenter
7 3 (0.14%) Magento
7 3 (0.14%) Oracle Procure-to-Pay
8 2 (0.094%) OpenText VIM for SAP
8 2 (0.094%) Remedy ITSM
8 2 (0.094%) SAP Hybris
8 2 (0.094%) SAP SRM
8 2 (0.094%) SAP WM
8 2 (0.094%) Scribe Insight
Cloud Services
1 708 (33.33%) Azure
2 375 (17.66%) SaaS
3 370 (17.42%) PaaS
4 316 (14.88%) IaaS
5 286 (13.47%) AWS
6 264 (12.43%) Power Platform
7 212 (9.98%) Serverless
8 206 (9.70%) Dynamics 365
9 200 (9.42%) Azure Functions
10 182 (8.57%) GCP
11 100 (4.71%) Microsoft 365
12 82 (3.86%) Azure DevOps
13 40 (1.88%) GitHub
14 37 (1.74%) Entra ID
15 35 (1.65%) Power Automate
16 31 (1.46%) AWS CloudFormation
17 30 (1.41%) ChatGPT
17 30 (1.41%) OpenShift
18 23 (1.08%) Azure Sentinel
19 18 (0.85%) Amazon S3
Communications & Networking
1 56 (2.64%) DNS
2 44 (2.07%) DHCP
3 38 (1.79%) Firewall
4 37 (1.74%) Network Security
4 37 (1.74%) TCP/IP
5 30 (1.41%) HTTP
6 27 (1.27%) WAN
7 24 (1.13%) SAN
8 16 (0.75%) LAN
8 16 (0.75%) SD-WAN
9 14 (0.66%) Wi-Fi
10 13 (0.61%) Internet
11 12 (0.56%) VPN
12 9 (0.42%) VLAN
13 8 (0.38%) MPLS
14 7 (0.33%) Reverse Proxy
14 7 (0.33%) Unified Communications
15 5 (0.24%) Remote Desktop
15 5 (0.24%) Software-Defined Radio
15 5 (0.24%) Wireless
Database & Business Intelligence
1 137 (6.45%) Data Warehouse
2 117 (5.51%) NoSQL
3 115 (5.41%) Data Lake
4 53 (2.50%) SQL Server
5 50 (2.35%) Power BI
6 44 (2.07%) MySQL
7 38 (1.79%) Amazon Redshift
7 38 (1.79%) PostgreSQL
8 35 (1.65%) Elasticsearch
9 33 (1.55%) MongoDB
10 22 (1.04%) BigQuery
11 17 (0.80%) Relational Database
12 16 (0.75%) Amazon RDS
13 15 (0.71%) Tableau
14 13 (0.61%) Azure SQL Database
15 12 (0.56%) Amazon Athena
15 12 (0.56%) Amazon QuickSight
15 12 (0.56%) BusinessObjects
15 12 (0.56%) DynamoDB
16 10 (0.47%) SQL Server Integration Services
Development Applications
1 66 (3.11%) Jenkins
2 62 (2.92%) JIRA
3 43 (2.02%) Git
4 33 (1.55%) Selenium
5 31 (1.46%) Cypress.io
6 27 (1.27%) Cucumber
7 9 (0.42%) Visual Studio
8 7 (0.33%) Oracle Forms
8 7 (0.33%) TestRail
9 6 (0.28%) Artifactory
9 6 (0.28%) Octopus Deploy
10 5 (0.24%) JMeter
11 4 (0.19%) GitLab
11 4 (0.19%) Team Foundation Server
12 3 (0.14%) Postman
12 3 (0.14%) SoapUI
12 3 (0.14%) SonarQube
12 3 (0.14%) TeamCity
12 3 (0.14%) Visual Studio Code
12 3 (0.14%) Visual Studio Team System
General
1 975 (45.90%) Finance
2 452 (21.28%) Social Skills
3 303 (14.27%) Banking
4 165 (7.77%) Retail
5 164 (7.72%) Analytical Skills
6 136 (6.40%) Inclusion and Diversity
7 98 (4.61%) Marketing
8 86 (4.05%) Manufacturing
9 82 (3.86%) Influencing Skills
10 55 (2.59%) Legal
10 55 (2.59%) Public Sector
11 48 (2.26%) Law
12 38 (1.79%) Organisational Skills
13 33 (1.55%) Presentation Skills
14 31 (1.46%) Pharmaceutical
15 30 (1.41%) Telecoms
16 23 (1.08%) Aerospace
16 23 (1.08%) Automotive
17 20 (0.94%) Electronics
18 17 (0.80%) Digital Healthcare
Job Titles
1 805 (37.90%) Architect
2 300 (14.12%) Enterprise Architect
3 250 (11.77%) Senior
4 218 (10.26%) Lead
5 186 (8.76%) Dynamics 365 Architect
6 183 (8.62%) CRM Architect
6 183 (8.62%) Dynamics CRM Architect
7 171 (8.05%) Solutions Architect
8 120 (5.65%) Product Manager
9 96 (4.52%) Analyst
10 87 (4.10%) Developer
11 80 (3.77%) Product Owner
12 69 (3.25%) Cloud Engineer
12 69 (3.25%) Software Engineer
13 61 (2.87%) Commercial Architect
14 55 (2.59%) Senior Architect
15 54 (2.54%) IT Manager
16 47 (2.21%) Business Analyst
17 41 (1.93%) Security Engineer
18 40 (1.88%) Project Manager
Libraries, Frameworks & Software Standards
1 135 (6.36%) OpenID
2 90 (4.24%) .NET
3 65 (3.06%) HTML
4 56 (2.64%) Kafka
5 48 (2.26%) Web Services
6 46 (2.17%) React
7 43 (2.02%) REST
8 42 (1.98%) Node.js
9 33 (1.55%) CSS
10 30 (1.41%) SAML
11 29 (1.37%) JWT
12 28 (1.32%) RESTful
13 25 (1.18%) gRPC
13 25 (1.18%) JSON
14 23 (1.08%) OAuth
15 20 (0.94%) YAML
16 19 (0.89%) AngularJS
17 18 (0.85%) .NET Core
18 16 (0.75%) ASP.NET
19 15 (0.71%) .NET Framework
Miscellaneous
1 273 (12.85%) Product Ownership
2 112 (5.27%) Cloud Native
3 106 (4.99%) Public Cloud
4 94 (4.43%) Mainframe
5 86 (4.05%) Blockchain
6 82 (3.86%) Management Information System
7 57 (2.68%) Enterprise Software
8 48 (2.26%) Data Centre
9 47 (2.21%) Virtual Team
10 36 (1.69%) Cyberattack
11 24 (1.13%) Mobile App
11 24 (1.13%) Self-Motivation
12 21 (0.99%) Private Cloud
13 20 (0.94%) Algorithms
14 18 (0.85%) Renewable Energy
15 17 (0.80%) Embedded Systems
16 16 (0.75%) Linux Command Line
16 16 (0.75%) Replication
17 15 (0.71%) IoT
18 14 (0.66%) Mali
Operating Systems
1 98 (4.61%) Windows
2 87 (4.10%) Unix
3 71 (3.34%) Linux
4 27 (1.27%) Windows Server
5 24 (1.13%) Android
6 14 (0.66%) Windows Server 2016
7 13 (0.61%) Red Hat Enterprise Linux
7 13 (0.61%) Windows 10
8 12 (0.56%) Apple iOS
9 11 (0.52%) Windows Server 2019
10 9 (0.42%) HPUX
10 9 (0.42%) Solaris
10 9 (0.42%) Windows Server 2012
11 7 (0.33%) CentOS
12 6 (0.28%) Ubuntu
12 6 (0.28%) Windows 7
13 4 (0.19%) Mac OS
14 2 (0.094%) Debian
14 2 (0.094%) VMS
15 1 (0.047%) Mac OS X
Processes & Methodologies
1 1,171 (55.13%) Agile
2 491 (23.12%) Strategic Roadmap
3 359 (16.90%) Enterprise Architecture
4 354 (16.67%) Technology Roadmap
5 321 (15.11%) Product Roadmap
6 312 (14.69%) DevOps
7 246 (11.58%) CRM
8 232 (10.92%) Actionable Insight
9 221 (10.40%) Cybersecurity
10 200 (9.42%) Microservices
11 196 (9.23%) Presales
11 196 (9.23%) Problem-Solving
12 193 (9.09%) Project Planning
13 191 (8.99%) Architectural Design
14 183 (8.62%) Artificial Intelligence
14 183 (8.62%) Work Breakdown Structure
15 175 (8.24%) Data Integration
16 174 (8.19%) Analytics
16 174 (8.19%) Customer Service
17 172 (8.10%) IT Strategy
Programming Languages
1 181 (8.52%) SQL
2 153 (7.20%) Python
3 103 (4.85%) JavaScript
4 89 (4.19%) C#
4 89 (4.19%) PowerShell
5 85 (4.00%) Java
6 48 (2.26%) C++
7 46 (2.17%) Bash
8 36 (1.69%) Go
9 34 (1.60%) TypeScript
10 26 (1.22%) Kotlin
11 20 (0.94%) C
12 16 (0.75%) PHP
13 14 (0.66%) MATLAB
14 13 (0.61%) Bicep
15 7 (0.33%) VB
16 5 (0.24%) Data Analysis Expressions
16 5 (0.24%) T-SQL
17 4 (0.19%) Embedded C
17 4 (0.19%) Perl
Qualifications
1 232 (10.92%) Degree
2 165 (7.77%) Security Cleared
3 86 (4.05%) SC Cleared
4 48 (2.26%) Computer Science Degree
5 47 (2.21%) DV Cleared
6 39 (1.84%) Azure Certification
7 34 (1.60%) AWS Certification
8 31 (1.46%) AWS Certified Solutions Architect
9 29 (1.37%) Master's Degree
10 27 (1.27%) CISSP
11 24 (1.13%) CISMP
12 22 (1.04%) HNC
13 16 (0.75%) Microsoft Certification
14 15 (0.71%) CISM
15 13 (0.61%) TOGAF Certification
16 11 (0.52%) Cisco Certification
16 11 (0.52%) PMI Certification
17 10 (0.47%) DBS Check
18 9 (0.42%) BPSS Clearance
19 8 (0.38%) ITIL Certification
Quality Assurance & Compliance
1 41 (1.93%) GRC
2 36 (1.69%) QA
3 35 (1.65%) Data Quality
4 30 (1.41%) GDPR
5 28 (1.32%) ISO/IEC 27001
6 26 (1.22%) PMO
7 20 (0.94%) Accessibility
8 15 (0.71%) SLA
9 13 (0.61%) Cyber Essentials
10 10 (0.47%) ISO 9001
10 10 (0.47%) NIST
11 6 (0.28%) Sarbanes-Oxley
12 5 (0.24%) COBIT
12 5 (0.24%) GxP
12 5 (0.24%) HIPAA
12 5 (0.24%) PCI DSS
13 4 (0.19%) Cyber Essentials PLUS
13 4 (0.19%) ISO/IEC 20000
14 3 (0.14%) Actionable Recommendations
14 3 (0.14%) WCAG
System Software
1 118 (5.56%) Docker
2 63 (2.97%) Active Directory
3 46 (2.17%) VMware Infrastructure
4 29 (1.37%) Firmware
5 17 (0.80%) Hyper-V
6 15 (0.71%) Virtual Machines
7 13 (0.61%) Embedded Firmware
8 10 (0.47%) vSphere
9 9 (0.42%) Virtual Desktop
10 6 (0.28%) VMware ESXi
11 5 (0.24%) BitLocker
12 2 (0.094%) Citrix Hypervisor
12 2 (0.094%) KVM
13 1 (0.047%) QEMU
13 1 (0.047%) RACF
13 1 (0.047%) Virtual Servers
13 1 (0.047%) XenApp
Systems Management
1 195 (9.18%) Kubernetes
2 104 (4.90%) Terraform
3 33 (1.55%) Microsoft Intune
4 21 (0.99%) SCCM
5 16 (0.75%) Istio
6 13 (0.61%) Ansible
7 8 (0.38%) Nessus
8 7 (0.33%) Grafana
9 5 (0.24%) Jamf Pro
10 4 (0.19%) Single Sign-On
10 4 (0.19%) vCenter Server
11 3 (0.14%) Kibana
11 3 (0.14%) Packer
12 2 (0.094%) HAProxy
12 2 (0.094%) Oracle Identity Management
12 2 (0.094%) Puppet
12 2 (0.094%) Red Hat Satellite
12 2 (0.094%) SCOM
12 2 (0.094%) WebSphere Cast Iron
12 2 (0.094%) ZABBIX
Vendors
1 480 (22.60%) Microsoft
2 106 (4.99%) SAP
3 77 (3.63%) Google
4 55 (2.59%) VMware
5 43 (2.02%) Salesforce
6 38 (1.79%) ServiceNow
7 37 (1.74%) Oracle
8 35 (1.65%) Cisco
9 19 (0.89%) IBM
10 15 (0.71%) Databricks
11 14 (0.66%) HP
12 11 (0.52%) Juniper
12 11 (0.52%) Sun
13 10 (0.47%) Aruba
13 10 (0.47%) Atlassian
13 10 (0.47%) Confluent
13 10 (0.47%) Meraki
13 10 (0.47%) Sitecore
14 9 (0.42%) Screaming Frog
14 9 (0.42%) SolarWinds