Public Sector Jobs in the UK excluding London

Public Sector
UK > UK excluding London

The table below looks at the prevalence of the term Public Sector in permanent job vacancies in the UK excluding London. Included is a benchmarking guide to the salaries offered in vacancies that cited Public Sector over the 6 months leading up to 27 April 2025, comparing them to the same period in the previous two years.

6 months to
27 Apr 2025
Same period 2024 Same period 2023
Rank 118 60 86
Rank change year-on-year -58 +26 -29
Permanent jobs citing Public Sector 866 2,943 2,301
As % of all permanent jobs advertised in the UK excluding London 2.37% 4.20% 3.72%
As % of the General category 3.70% 7.30% 5.37%
Number of salaries quoted 511 2,055 1,377
10th Percentile £32,500 £29,000 £29,800
25th Percentile £43,500 £40,000 £36,250
Median annual salary (50th Percentile) £55,000 £52,500 £48,500
Median % change year-on-year +4.76% +8.25% +2.11%
75th Percentile £69,500 £67,968 £65,250
90th Percentile £86,750 £84,964 £80,000
UK median annual salary £60,000 £55,000 £56,480
% change year-on-year +9.09% -2.62% +3.63%

All General Skills
UK excluding London

Public Sector falls under the General Skills category. For comparison with the information above, the following table provides summary statistics for all permanent job vacancies requiring common skills in the UK excluding London.

Permanent vacancies with a requirement for common skills 23,429 40,304 42,861
As % of all permanent jobs advertised in the UK excluding London 64.05% 57.48% 69.30%
Number of salaries quoted 11,822 26,395 19,323
10th Percentile £25,625 £26,000 £28,500
25th Percentile £36,250 £32,500 £37,500
Median annual salary (50th Percentile) £50,055 £47,500 £52,500
Median % change year-on-year +5.38% -9.52% +5.00%
75th Percentile £65,000 £62,500 £67,500
90th Percentile £78,750 £75,750 £82,500
UK median annual salary £56,745 £52,500 £60,000
% change year-on-year +8.09% -12.50% -

Public Sector
Job Vacancy Trend in the UK excluding London

Job postings citing Public Sector as a proportion of all IT jobs advertised in the UK excluding London.
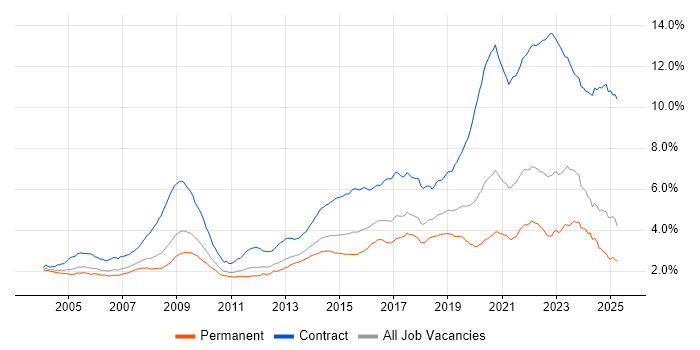
Job vacancy trend for Public Sector in the UK excluding London

Public Sector
Salary Trend in the UK excluding London

3-month moving average salary quoted in jobs citing Public Sector in the UK excluding London.

Salary trend for Public Sector in the UK excluding London

Public Sector
Salary Histogram in the UK excluding London

Salary distribution for jobs citing Public Sector in the UK excluding London over the 6 months to 27 April 2025.

Salary histogram for Public Sector in the UK excluding London

Public Sector
Job Locations in the UK excluding London

The table below looks at the demand and provides a guide to the median salaries quoted in IT jobs citing Public Sector within the UK excluding London region over the 6 months to 27 April 2025. The 'Rank Change' column provides an indication of the change in demand within each location based on the same 6 month period last year.

Location Rank Change
on Same Period
Last Year
Matching
Permanent
IT Job Ads
Median Salary
Past 6 Months
Median Salary
% Change
on Same Period
Last Year
Live
Jobs
North of England -102 223 £54,228 -6.45% 301
Midlands -26 188 £52,500 - 215
South East -68 161 £57,500 +15.00% 270
West Midlands -23 133 £53,688 -2.39% 131
North West -127 114 £65,000 +12.14% 177
South West +2 112 £61,250 +16.67% 189
Yorkshire -30 99 £50,000 -13.74% 85
East of England +22 73 £64,000 +34.74% 64
Scotland +35 57 £51,695 +14.88% 87
East Midlands -28 47 £50,000 +5.26% 80
Wales +1 46 £56,000 +5.75% 40
Northern Ireland +6 21 £70,000 +100.00% 41
North East -41 9 £60,000 +9.09% 40
Channel Islands - 2 £78,750 -
Public Sector
UK

Public Sector
Co-occurring Skills and Capabilities in the UK excluding London by Category

The follow tables expand on the table above by listing co-occurrences grouped by category. The same employment type, locality and period is covered with up to 20 co-occurrences shown in each of the following categories:

Application Platforms
1 22 (2.54%) SharePoint
2 17 (1.96%) Confluence
3 12 (1.39%) JBoss
3 12 (1.39%) Microsoft Exchange
3 12 (1.39%) nginx
3 12 (1.39%) Red Hat Fuse
4 7 (0.81%) Camunda
5 6 (0.69%) Apache
5 6 (0.69%) IIS
5 6 (0.69%) Oracle SOA Suite
6 5 (0.58%) CMS
6 5 (0.58%) Tomcat
7 3 (0.35%) Adobe Experience Manager
7 3 (0.35%) Apache Spark
7 3 (0.35%) Headless CMS
8 2 (0.23%) Jupyter
8 2 (0.23%) Oracle Workflow
8 2 (0.23%) Skype for Business
9 1 (0.12%) ArcGIS
9 1 (0.12%) Umbraco
Applications
1 39 (4.50%) Microsoft Office
2 37 (4.27%) Microsoft Excel
3 21 (2.42%) Microsoft PowerPoint
4 3 (0.35%) AutoCAD
4 3 (0.35%) Spreadsheet
5 2 (0.23%) Adobe XD
5 2 (0.23%) Microsoft Project
5 2 (0.23%) Oracle Smart View
6 1 (0.12%) MicroStation
6 1 (0.12%) Revit
6 1 (0.12%) SOLIDWORKS
Business Applications
1 39 (4.50%) NEC Housing
2 12 (1.39%) PeopleSoft HCM
3 8 (0.92%) Salesforce CRM
4 7 (0.81%) Oracle EBS
5 6 (0.69%) Oracle Procure-to-Pay
6 5 (0.58%) SAP HCM
7 3 (0.35%) Oracle ERP
7 3 (0.35%) Sprinklr
8 2 (0.23%) Infor M3
8 2 (0.23%) Oracle Assets
8 2 (0.23%) Oracle Cash Management
8 2 (0.23%) Oracle Financials
8 2 (0.23%) Oracle General Ledger
8 2 (0.23%) Oracle Payables
8 2 (0.23%) Oracle Receivables
8 2 (0.23%) Sparx Enterprise Architect
9 1 (0.12%) Dynamics CRM
9 1 (0.12%) SAP ERP
9 1 (0.12%) SAP Payroll
9 1 (0.12%) Unit4 Business World
Cloud Services
1 157 (18.13%) AWS
2 129 (14.90%) Azure
3 70 (8.08%) SaaS
4 65 (7.51%) Serverless
5 41 (4.73%) IBM Cloud
6 35 (4.04%) Amazon EC2
7 34 (3.93%) Power Platform
8 31 (3.58%) Amazon EKS
9 30 (3.46%) GCP
9 30 (3.46%) GitHub
9 30 (3.46%) PaaS
10 29 (3.35%) Amazon ECS
11 28 (3.23%) GitHub Actions
11 28 (3.23%) Microsoft 365
12 27 (3.12%) AWS Lambda
13 26 (3.00%) Azure DevOps
14 25 (2.89%) Amazon SQS
15 22 (2.54%) OCI
16 21 (2.42%) Boomi
17 19 (2.19%) Entra ID
Communications & Networking
1 33 (3.81%) Firewall
2 22 (2.54%) LAN
3 19 (2.19%) WAN
4 15 (1.73%) DNS
4 15 (1.73%) Wireless
5 14 (1.62%) Network Security
5 14 (1.62%) TCP/IP
6 11 (1.27%) VPN
7 9 (1.04%) Wi-Fi
8 8 (0.92%) VoIP
9 7 (0.81%) MPLS
10 6 (0.69%) DHCP
10 6 (0.69%) Internet
10 6 (0.69%) IPsec
10 6 (0.69%) SD-WAN
11 5 (0.58%) Modbus
11 5 (0.58%) SAN
12 4 (0.46%) Ethernet
12 4 (0.46%) LTE
13 3 (0.35%) WLAN
Database & Business Intelligence
1 57 (6.58%) PostgreSQL
2 50 (5.77%) Relational Database
3 27 (3.12%) RDBMS
4 26 (3.00%) Big Data
5 24 (2.77%) Power BI
6 23 (2.66%) MongoDB
6 23 (2.66%) SQL Server
7 19 (2.19%) Amazon RDS
7 19 (2.19%) NoSQL
8 17 (1.96%) Data Lake
8 17 (1.96%) Oracle Database
9 12 (1.39%) MySQL
9 12 (1.39%) Tableau
10 9 (1.04%) Oracle Reports
11 8 (0.92%) BusinessObjects
12 6 (0.69%) Amazon Redshift
12 6 (0.69%) Data Warehouse
12 6 (0.69%) Oracle ODI
12 6 (0.69%) Redis
13 5 (0.58%) Elasticsearch
Development Applications
1 46 (5.31%) Git
1 46 (5.31%) Jenkins
2 42 (4.85%) JUnit
3 30 (3.46%) JIRA
3 30 (3.46%) Mockito
4 25 (2.89%) SonarQube
5 23 (2.66%) Maven
6 21 (2.42%) JMeter
7 11 (1.27%) CircleCI
7 11 (1.27%) GitLab
8 8 (0.92%) Bitbucket
9 6 (0.69%) JDeveloper
9 6 (0.69%) Oracle Forms
10 5 (0.58%) Cucumber
10 5 (0.58%) DbUnit
10 5 (0.58%) jMock
10 5 (0.58%) Postman
10 5 (0.58%) Selenium
10 5 (0.58%) TestNG
11 3 (0.35%) ERwin
General
1 257 (29.68%) Social Skills
2 246 (28.41%) Finance
3 117 (13.51%) Local Government
4 114 (13.16%) Inclusion and Diversity
5 89 (10.28%) Analytical Skills
6 63 (7.27%) Marketing
7 60 (6.93%) Telecoms
8 58 (6.70%) Manufacturing
9 50 (5.77%) Police
10 42 (4.85%) Electronics
11 37 (4.27%) Influencing Skills
11 37 (4.27%) Law
11 37 (4.27%) Organisational Skills
12 30 (3.46%) Retail
13 26 (3.00%) Presentation Skills
14 23 (2.66%) Legal
14 23 (2.66%) Social Housing
15 7 (0.81%) Back Office
16 6 (0.69%) Aerospace
16 6 (0.69%) Pharmaceutical
Job Titles
1 173 (19.98%) Senior
2 83 (9.58%) Project Manager
3 77 (8.89%) Developer
4 75 (8.66%) Consultant
5 68 (7.85%) Lead
6 67 (7.74%) Architect
7 61 (7.04%) Analyst
8 50 (5.77%) Senior Manager
9 44 (5.08%) Java Engineer
10 39 (4.50%) Java Developer
11 35 (4.04%) Senior Java Engineer
12 31 (3.58%) Implementation Consultant
13 25 (2.89%) Audit Manager
13 25 (2.89%) Senior Audit Manager
14 24 (2.77%) Senior Project Manager
15 23 (2.66%) DevOps Engineer
15 23 (2.66%) Infrastructure Engineer
16 21 (2.42%) Senior Architect
16 21 (2.42%) Support Engineer
17 18 (2.08%) Solutions Architect
Libraries, Frameworks & Software Standards
1 54 (6.24%) RESTful
2 47 (5.43%) REST
3 45 (5.20%) Spring
4 44 (5.08%) Spring Boot
5 36 (4.16%) Web Services
6 30 (3.46%) Apache Camel
7 29 (3.35%) HTML
8 28 (3.23%) React
9 25 (2.89%) Hibernate
10 24 (2.77%) OAuth
11 22 (2.54%) ActiveMQ
11 22 (2.54%) Node.js
11 22 (2.54%) WireMock
12 21 (2.42%) SOAP
13 19 (2.19%) jQuery
14 17 (1.96%) Kafka
15 16 (1.85%) AngularJS
16 15 (1.73%) .NET
16 15 (1.73%) JWT
17 13 (1.50%) Vue
Miscellaneous
1 77 (8.89%) Hybrid Cloud
2 45 (5.20%) Distributed Systems
3 41 (4.73%) Blockchain
4 36 (4.16%) Management Information System
5 33 (3.81%) e-Learning
6 31 (3.58%) Self-Motivation
7 28 (3.23%) Data Centre
7 28 (3.23%) Public Cloud
8 27 (3.12%) Housing Association
8 27 (3.12%) Onboarding
9 24 (2.77%) NHS
10 22 (2.54%) Driving Licence
11 15 (1.73%) Renewable Energy
12 14 (1.62%) Legacy Systems
12 14 (1.62%) Robotics
13 13 (1.50%) SCADA
14 12 (1.39%) Algorithms
14 12 (1.39%) Cloud Native
15 10 (1.15%) CCTV
16 9 (1.04%) Data Structures
Operating Systems
1 65 (7.51%) Windows
2 36 (4.16%) Linux
3 31 (3.58%) Windows Server
4 28 (3.23%) Unix
5 8 (0.92%) Solaris
6 7 (0.81%) Apple iOS
7 5 (0.58%) Android
7 5 (0.58%) Mac OS
7 5 (0.58%) Windows 10
8 4 (0.46%) Windows Server 2012
9 2 (0.23%) Windows Server 2019
10 1 (0.12%) Red Hat Enterprise Linux
10 1 (0.12%) Robot Operating System
10 1 (0.12%) Ubuntu
10 1 (0.12%) Windows Server 2016
Processes & Methodologies
1 210 (24.25%) Agile
2 174 (20.09%) Project Management
3 127 (14.67%) Mentoring
4 124 (14.32%) Artificial Intelligence
4 124 (14.32%) DevOps
5 108 (12.47%) Coaching
6 107 (12.36%) Problem-Solving
7 100 (11.55%) Project Delivery
8 90 (10.39%) Analytics
9 85 (9.82%) CI/CD
10 84 (9.70%) Continuous Improvement
11 81 (9.35%) Stakeholder Management
12 73 (8.43%) Business Intelligence
13 70 (8.08%) Software Engineering
14 66 (7.62%) SDLC
15 64 (7.39%) Customer Service
16 63 (7.27%) Roadmaps
16 63 (7.27%) Scrum
17 58 (6.70%) Service Delivery
18 57 (6.58%) Cybersecurity
Programming Languages
1 127 (14.67%) SQL
2 122 (14.09%) Java
3 75 (8.66%) Python
4 47 (5.43%) JavaScript
5 33 (3.81%) C#
6 18 (2.08%) Shell Script
7 12 (1.39%) PowerShell
8 11 (1.27%) TypeScript
9 10 (1.15%) PL/SQL
10 7 (0.81%) C++
10 7 (0.81%) Lua
10 7 (0.81%) PHP
11 5 (0.58%) C
12 4 (0.46%) Groovy
12 4 (0.46%) R
13 3 (0.35%) Ruby
13 3 (0.35%) Scala
13 3 (0.35%) VBA
14 2 (0.23%) Bash
14 2 (0.23%) VB
Qualifications
1 207 (23.90%) Security Cleared
2 118 (13.63%) Degree
3 114 (13.16%) SC Cleared
4 49 (5.66%) DBS Check
5 25 (2.89%) ACCA
6 21 (2.42%) DV Cleared
7 18 (2.08%) BPSS Clearance
8 13 (1.50%) Master's Degree
8 13 (1.50%) Microsoft Certification
9 11 (1.27%) Cisco Certification
9 11 (1.27%) HND
10 10 (1.15%) AWS Certification
10 10 (1.15%) CCNA
10 10 (1.15%) Chartered Engineer
11 9 (1.04%) MCSE
12 8 (0.92%) Azure Certification
12 8 (0.92%) CISM
12 8 (0.92%) MAPM
12 8 (0.92%) MRICS
13 7 (0.81%) MCSA
Quality Assurance & Compliance
1 53 (6.12%) Accessibility
2 25 (2.89%) GAAP
2 25 (2.89%) IFRS
3 22 (2.54%) QA
4 17 (1.96%) GDPR
4 17 (1.96%) ISO/IEC 27001
5 16 (1.85%) SLA
6 13 (1.50%) Data Quality
6 13 (1.50%) ISO 9001
7 12 (1.39%) NCSC
7 12 (1.39%) PMO
8 9 (1.04%) NIST
9 6 (0.69%) California Consumer Privacy Act
9 6 (0.69%) GRC
10 4 (0.46%) Cyber Essentials
10 4 (0.46%) Def Stans
11 3 (0.35%) IEC 61508
11 3 (0.35%) ISO 14001
12 2 (0.23%) COBIT
12 2 (0.23%) WCAG
System Software
1 100 (11.55%) Docker
2 39 (4.50%) Active Directory
3 17 (1.96%) VMware Infrastructure
4 5 (0.58%) Hyper-V
5 4 (0.46%) Firmware
6 3 (0.35%) Virtual Desktop
6 3 (0.35%) Virtual Servers
7 2 (0.23%) Embedded Firmware
7 2 (0.23%) Postfix
7 2 (0.23%) VMware NSX
8 1 (0.12%) RHEV
8 1 (0.12%) Virtual Machines
8 1 (0.12%) VMware ESXi
8 1 (0.12%) vSphere
Systems Management
1 81 (9.35%) Kubernetes
2 41 (4.73%) Terraform
3 38 (4.39%) Ansible
4 17 (1.96%) Kibana
5 10 (1.15%) Grafana
6 8 (0.92%) Prometheus
6 8 (0.92%) SCCM
7 6 (0.69%) Progress Chef
8 5 (0.58%) Kustomize
8 5 (0.58%) Microsoft Intune
8 5 (0.58%) Packer
8 5 (0.58%) ZABBIX
9 4 (0.46%) Cisco CUCM
10 3 (0.35%) Functional Safety
11 1 (0.12%) Active Directory Federation Services
11 1 (0.12%) PaperCut
11 1 (0.12%) PowerCLI
11 1 (0.12%) vCenter Server
11 1 (0.12%) vRealize
11 1 (0.12%) VxRail
Vendors
1 133 (15.36%) Microsoft
2 64 (7.39%) Oracle
3 54 (6.24%) Red Hat
4 52 (6.00%) IBM
5 47 (5.43%) SAP
6 45 (5.20%) NEC
7 41 (4.73%) Salesforce
8 25 (2.89%) ServiceNow
9 24 (2.77%) VMware
10 23 (2.66%) Cisco
11 21 (2.42%) Google
12 19 (2.19%) Dynatrace
13 17 (1.96%) MuleSoft
13 17 (1.96%) Splunk
14 15 (1.73%) Informatica
15 13 (1.50%) Citrix
16 12 (1.39%) Facebook
16 12 (1.39%) PeopleSoft
17 11 (1.27%) YouTube
18 9 (1.04%) Dell