Documentation Skills Jobs in the UK excluding London

Documentation Skills
UK > UK excluding London

The table below looks at the prevalence of the term Documentation Skills in permanent job vacancies in the UK excluding London. Included is a benchmarking guide to the salaries offered in vacancies that cited Documentation Skills over the 6 months leading up to 6 July 2025, comparing them to the same period in the previous two years.

6 months to
6 Jul 2025
Same period 2024 Same period 2023
Rank 305 460 496
Rank change year-on-year +155 +36 0
Permanent jobs citing Documentation Skills 325 321 238
As % of all permanent jobs advertised in the UK excluding London 0.76% 0.41% 0.45%
As % of the General category 1.16% 0.76% 0.68%
Number of salaries quoted 124 263 150
10th Percentile £30,375 £25,500 £26,225
25th Percentile £38,973 £30,000 £32,500
Median annual salary (50th Percentile) £47,500 £42,500 £45,000
Median % change year-on-year +11.76% -5.56% -18.18%
75th Percentile £63,750 £57,500 £60,000
90th Percentile £75,000 £72,500 £71,250
UK median annual salary £55,000 £50,000 £57,000
% change year-on-year +10.00% -12.28% -5.00%

All General Skills
UK excluding London

Documentation Skills falls under the General Skills category. For comparison with the information above, the following table provides summary statistics for all permanent job vacancies requiring common skills in the UK excluding London.

Permanent vacancies with a requirement for common skills 28,112 42,278 34,903
As % of all permanent jobs advertised in the UK excluding London 65.58% 54.54% 66.17%
Number of salaries quoted 13,166 26,529 18,111
10th Percentile £25,087 £26,250 £28,250
25th Percentile £31,250 £32,500 £37,500
Median annual salary (50th Percentile) £47,683 £47,500 £52,500
Median % change year-on-year +0.39% -9.52% +5.00%
75th Percentile £63,187 £62,500 £67,500
90th Percentile £77,500 £75,000 £80,627
UK median annual salary £54,793 £52,500 £60,000
% change year-on-year +4.37% -12.50% -

Documentation Skills
Job Vacancy Trend in the UK excluding London

Job postings citing Documentation Skills as a proportion of all IT jobs advertised in the UK excluding London.
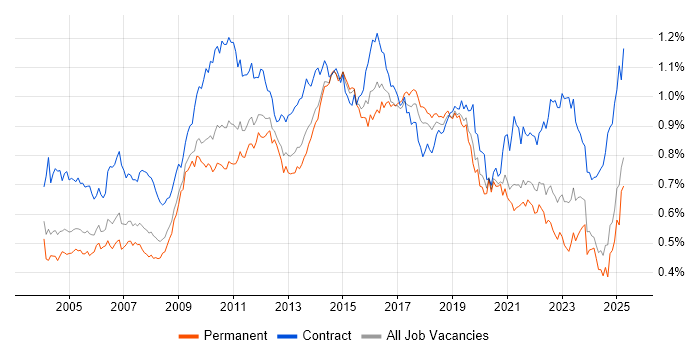
Job vacancy trend for Documentation Skills in the UK excluding London

Documentation Skills
Salary Trend in the UK excluding London

3-month moving average salary quoted in jobs citing Documentation Skills in the UK excluding London.

Salary trend for Documentation Skills in the UK excluding London

Documentation Skills
Salary Histogram in the UK excluding London

Salary distribution for jobs citing Documentation Skills in the UK excluding London over the 6 months to 6 July 2025.

Salary histogram for Documentation Skills in the UK excluding London

Documentation Skills
Job Locations in the UK excluding London

The table below looks at the demand and provides a guide to the median salaries quoted in IT jobs citing Documentation Skills within the UK excluding London region over the 6 months to 6 July 2025. The 'Rank Change' column provides an indication of the change in demand within each location based on the same 6 month period last year.

Location Rank Change
on Same Period
Last Year
Matching
Permanent
IT Job Ads
Median Salary
Past 6 Months
Median Salary
% Change
on Same Period
Last Year
Live
Jobs
Midlands +144 174 £50,000 +25.00% 150
West Midlands +120 123 £50,000 +21.95% 97
North of England +55 81 £42,000 +14.29% 196
East Midlands +83 51 £33,750 -15.63% 53
North West +14 44 £55,000 +37.50% 108
Yorkshire +66 32 £42,000 +33.33% 72
South East -8 27 £70,000 +40.00% 220
East of England +38 22 £50,000 +19.05% 126
South West +99 19 £40,000 -39.62% 97
North East +38 5 £27,000 -20.59% 16
Scotland +85 2 - - 47
Wales +29 1 £50,000 +11.11% 23
Documentation Skills
UK

Documentation Skills
Co-occurring Skills and Capabilities in the UK excluding London by Category

The follow tables expand on the table above by listing co-occurrences grouped by category. The same employment type, locality and period is covered with up to 20 co-occurrences shown in each of the following categories:

Application Platforms
1 21 (6.46%) SharePoint
2 15 (4.62%) Microsoft Exchange
3 3 (0.92%) CMS
3 3 (0.92%) EPiServer
4 2 (0.62%) Apache
4 2 (0.62%) Apache Spark
5 1 (0.31%) Apache Airflow
5 1 (0.31%) Confluence
5 1 (0.31%) IIS
Applications
1 14 (4.31%) Microsoft Office
2 9 (2.77%) Microsoft Excel
3 3 (0.92%) Chatbot
4 2 (0.62%) Microsoft PowerPoint
5 1 (0.31%) MS Visio
Business Applications
1 10 (3.08%) SAP S/4HANA
2 5 (1.54%) Dynamics AX
2 5 (1.54%) SAP IBP
2 5 (1.54%) SAP PP
3 4 (1.23%) Dynamics NAV
3 4 (1.23%) SAP HR
4 3 (0.92%) Payment Gateway
4 3 (0.92%) SAP EHS
4 3 (0.92%) Unit4 Business World
5 1 (0.31%) Sage 200
5 1 (0.31%) SAP ERP
5 1 (0.31%) SAP HCM
5 1 (0.31%) SAP Payroll
Cloud Services
1 48 (14.77%) Azure
2 34 (10.46%) Power Platform
3 25 (7.69%) Microsoft 365
4 20 (6.15%) AWS
5 19 (5.85%) Entra ID
6 14 (4.31%) Azure Data Factory
6 14 (4.31%) Azure Logic Apps
6 14 (4.31%) SaaS
7 9 (2.77%) Boomi
7 9 (2.77%) IaaS
8 8 (2.46%) PaaS
9 6 (1.85%) Dynamics 365
9 6 (1.85%) Power Automate
10 5 (1.54%) Salesforce Commerce Cloud
10 5 (1.54%) SAP Commerce Cloud
11 4 (1.23%) GitHub
11 4 (1.23%) SuccessFactors
12 3 (0.92%) GCP
12 3 (0.92%) OneDrive
12 3 (0.92%) PowerApps
Communications & Networking
1 20 (6.15%) TCP/IP
2 15 (4.62%) DNS
3 14 (4.31%) DHCP
4 10 (3.08%) Firewall
5 8 (2.46%) BGP
5 8 (2.46%) VPN
6 7 (2.15%) Network Security
7 5 (1.54%) OSPF
7 5 (1.54%) WAN
8 4 (1.23%) EIGRP
8 4 (1.23%) LAN
9 3 (0.92%) Unified Communications
9 3 (0.92%) VoIP
10 1 (0.31%) 802.11
10 1 (0.31%) Bluetooth
10 1 (0.31%) HSRP
10 1 (0.31%) HTTP
10 1 (0.31%) Remote Desktop
10 1 (0.31%) RS-232
10 1 (0.31%) SMTP
Database & Business Intelligence
1 32 (9.85%) Power BI
2 23 (7.08%) SQL Server
3 12 (3.69%) Azure SQL Database
3 12 (3.69%) SQL Server Integration Services
3 12 (3.69%) SQL Server Reporting Services
4 9 (2.77%) PostgreSQL
5 8 (2.46%) MySQL
6 5 (1.54%) Amazon RDS
6 5 (1.54%) Data Warehouse
6 5 (1.54%) MariaDB
6 5 (1.54%) Relational Database
7 4 (1.23%) BigQuery
7 4 (1.23%) FileMaker
7 4 (1.23%) Tableau
8 3 (0.92%) Amazon Aurora
8 3 (0.92%) CockroachDB
8 3 (0.92%) Looker
8 3 (0.92%) Metadata
8 3 (0.92%) Metadata Repository
8 3 (0.92%) SAP BW
Development Applications
1 28 (8.62%) JIRA
2 26 (8.00%) Rational DOORS
3 1 (0.31%) Appium
3 1 (0.31%) Git
3 1 (0.31%) Rational Rhapsody
3 1 (0.31%) TestRail
General
1 149 (45.85%) Legal
2 129 (39.69%) Manufacturing
3 91 (28.00%) Social Skills
4 28 (8.62%) Finance
5 22 (6.77%) Analytical Skills
6 20 (6.15%) Presentation Skills
7 17 (5.23%) Organisational Skills
8 13 (4.00%) Law
9 12 (3.69%) Inclusion and Diversity
10 9 (2.77%) Public Sector
11 8 (2.46%) Retail
12 4 (1.23%) Back Office
12 4 (1.23%) Banking
12 4 (1.23%) Marketing
13 3 (0.92%) Advertising
13 3 (0.92%) Financial Institution
13 3 (0.92%) Games
14 2 (0.62%) Aerospace
14 2 (0.62%) Automotive
14 2 (0.62%) Military
Job Titles
1 180 (55.38%) Senior
2 49 (15.08%) Analyst
3 24 (7.38%) Instrumentation Engineer
3 24 (7.38%) Senior Electrical Engineer
4 16 (4.92%) Developer
5 15 (4.62%) Architect
5 15 (4.62%) Support Analyst
6 12 (3.69%) Data Analyst
7 11 (3.38%) Quality Analyst
8 10 (3.08%) Business Analyst
8 10 (3.08%) Data Quality Analyst
9 9 (2.77%) Project Manager
10 8 (2.46%) Consultant
10 8 (2.46%) IT Support
10 8 (2.46%) Network Engineer
11 6 (1.85%) SAP Consultant
11 6 (1.85%) Senior Analyst
11 6 (1.85%) Solutions Architect
11 6 (1.85%) Technical Support
12 5 (1.54%) Technical Analyst
Libraries, Frameworks & Software Standards
1 7 (2.15%) REST
2 5 (1.54%) EDI
2 5 (1.54%) XML
3 3 (0.92%) Kafka
3 3 (0.92%) React
3 3 (0.92%) Spring
3 3 (0.92%) Spring Boot
4 2 (0.62%) .NET
4 2 (0.62%) Middleware
4 2 (0.62%) Pandas
5 1 (0.31%) 802.1X
5 1 (0.31%) ASP.NET
5 1 (0.31%) Elastic Stack
5 1 (0.31%) FHIR
5 1 (0.31%) JSON
5 1 (0.31%) Symfony
5 1 (0.31%) YAML
Miscellaneous
1 24 (7.38%) SCADA
2 14 (4.31%) Product Ownership
3 9 (2.77%) Self-Motivation
4 8 (2.46%) Management Information System
5 6 (1.85%) Virtual Team
6 5 (1.54%) Cloud Native
6 5 (1.54%) Driving Licence
7 4 (1.23%) Data Protection Act
7 4 (1.23%) NHS
7 4 (1.23%) Onboarding
8 3 (0.92%) Cyber Threat
8 3 (0.92%) Data Structures
8 3 (0.92%) Public Cloud
9 2 (0.62%) Analytical Mindset
9 2 (0.62%) Embedded Systems
9 2 (0.62%) Legacy Systems
10 1 (0.31%) Legacy Applications
10 1 (0.31%) Security Operations Centre
10 1 (0.31%) Security Posture
10 1 (0.31%) Team-Oriented Environment
Operating Systems
1 35 (10.77%) Windows
2 21 (6.46%) Windows Server
3 5 (1.54%) Linux
4 2 (0.62%) Windows 10
4 2 (0.62%) Windows Server 2016
5 1 (0.31%) Android
5 1 (0.31%) Apple iOS
5 1 (0.31%) Mac OS X
5 1 (0.31%) Unix
5 1 (0.31%) Windows 8
5 1 (0.31%) Windows Server 2019
Processes & Methodologies
1 144 (44.31%) Mathematics
2 43 (13.23%) Collaborative Working
3 42 (12.92%) Business Intelligence
4 41 (12.62%) Problem-Solving
5 28 (8.62%) Stakeholder Management
6 27 (8.31%) Requirements Gathering
7 26 (8.00%) Hazard Analysis
7 26 (8.00%) Safety Engineering
7 26 (8.00%) Systems Engineering
8 24 (7.38%) Acceptance Criteria
8 24 (7.38%) Agile
8 24 (7.38%) Roadmaps
9 22 (6.77%) Computer Science
9 22 (6.77%) Project Management
10 20 (6.15%) Migration
10 20 (6.15%) Project Delivery
11 19 (5.85%) Business Strategy
11 19 (5.85%) Time Management
12 14 (4.31%) Incident Management
12 14 (4.31%) Test Automation
Programming Languages
1 45 (13.85%) SQL
2 22 (6.77%) PowerShell
3 13 (4.00%) Python
4 10 (3.08%) T-SQL
5 9 (2.77%) C#
6 7 (2.15%) Java
7 6 (1.85%) JavaScript
8 5 (1.54%) C
8 5 (1.54%) PL/SQL
9 3 (0.92%) Bash
10 2 (0.62%) Data Analysis Expressions
11 1 (0.31%) ABAP
11 1 (0.31%) Embedded C
11 1 (0.31%) Perl
11 1 (0.31%) PHP
Qualifications
1 175 (53.85%) Degree
2 167 (51.38%) BPSS Clearance
3 141 (43.38%) Numerate Degree
4 28 (8.62%) Security Cleared
5 18 (5.54%) SC Cleared
6 16 (4.92%) Computer Science Degree
7 9 (2.77%) Microsoft Certification
8 6 (1.85%) DV Cleared
8 6 (1.85%) MCSA
8 6 (1.85%) MCSE
9 4 (1.23%) AWS Certification
10 3 (0.92%) SANS
11 2 (0.62%) CEH
11 2 (0.62%) CISM
11 2 (0.62%) CISSP
11 2 (0.62%) GIAC
11 2 (0.62%) ISSAP
12 1 (0.31%) CCNA
12 1 (0.31%) CCNP
12 1 (0.31%) Cisco Certification
Quality Assurance & Compliance
1 16 (4.92%) GDPR
2 12 (3.69%) Data Quality
3 11 (3.38%) ISO/IEC 27001
4 6 (1.85%) QA
5 5 (1.54%) PMO
6 4 (1.23%) ISO 9001
7 3 (0.92%) California Consumer Privacy Act
7 3 (0.92%) COBIT
7 3 (0.92%) Cyber Essentials
7 3 (0.92%) NIST
7 3 (0.92%) SOC 2
8 2 (0.62%) Cyber Essentials PLUS
8 2 (0.62%) GRC
8 2 (0.62%) JSP 440
8 2 (0.62%) PCI DSS
9 1 (0.31%) DICOM
9 1 (0.31%) HL7
9 1 (0.31%) SLA
9 1 (0.31%) Software Quality Assurance
9 1 (0.31%) Solvency II
System Software
1 21 (6.46%) Active Directory
2 15 (4.62%) VMware Infrastructure
3 10 (3.08%) Hyper-V
4 7 (2.15%) Docker
5 4 (1.23%) VMware NSX
6 2 (0.62%) Firmware
6 2 (0.62%) Virtual Servers
7 1 (0.31%) Embedded Firmware
Systems Management
1 9 (2.77%) Kubernetes
2 6 (1.85%) Ansible
3 3 (0.92%) Microsoft Intune
4 1 (0.31%) Kibana
4 1 (0.31%) SCCM
4 1 (0.31%) Terraform
Vendors
1 62 (19.08%) Microsoft
2 23 (7.08%) VMware
3 16 (4.92%) SAP
4 12 (3.69%) Cisco
5 9 (2.77%) Citrix
5 9 (2.77%) Dell
5 9 (2.77%) Oracle
6 6 (1.85%) BT
7 4 (1.23%) Google
8 3 (0.92%) Fortinet
8 3 (0.92%) HubSpot
8 3 (0.92%) iManage
8 3 (0.92%) Intapp
8 3 (0.92%) PayPal
9 2 (0.62%) Meraki
9 2 (0.62%) NetApp
10 1 (0.31%) LogRhythm
10 1 (0.31%) Sage
10 1 (0.31%) ServiceNow
10 1 (0.31%) Splunk