Business Case Contracts in the City of London

Business Cases
Central London > City of London

The table below provides summary statistics for contract job vacancies advertised in the City of London requiring Business Case skills. It includes a benchmarking guide to the contractor rates offered in vacancies that cited Business Case over the 6 months leading up to 23 July 2025, comparing them to the same period in the previous two years.

6 months to
23 Jul 2025
Same period 2024 Same period 2023
Rank 79 106 95
Rank change year-on-year +27 -11 +23
Contract jobs citing Business Case 44 25 72
As % of all contract jobs advertised in the City of London 2.35% 1.19% 2.12%
As % of the Processes & Methodologies category 2.50% 1.30% 2.33%
Number of daily rates quoted 30 13 41
10th Percentile £342 £410 £475
25th Percentile £409 £513 £513
Median daily rate (50th Percentile) £531 £625 £575
Median % change year-on-year -15.00% +8.70% +4.55%
75th Percentile £655 £663 £700
90th Percentile £675 £728 £800
Central London median daily rate £544 £625 £565
% change year-on-year -13.00% +10.62% +2.73%

All Process and Methodology Skills
City of London

Business Case falls under the Processes and Methodologies category. For comparison with the information above, the following table provides summary statistics for all contract job vacancies requiring process or methodology skills in the City of London.

Contract vacancies with a requirement for process or methodology skills 1,759 1,926 3,085
As % of all contract IT jobs advertised in the City of London 94.01% 91.50% 90.74%
Number of daily rates quoted 1,130 1,316 2,086
10th Percentile £332 £363 £349
25th Percentile £426 £463 £475
Median daily rate (50th Percentile) £550 £575 £600
Median % change year-on-year -4.35% -4.17% +4.35%
75th Percentile £675 £688 £725
90th Percentile £775 £800 £825
Central London median daily rate £550 £565 £600
% change year-on-year -2.65% -5.83% +5.73%
Number of hourly rates quoted 21 18 21
10th Percentile £17.08 £19.71 £14.25
25th Percentile £24.66 £20.88 £15.50
Median hourly rate £31.00 £33.50 £35.00
Median % change year-on-year -7.46% -4.29% -18.36%
75th Percentile £56.75 £74.38 £68.75
90th Percentile £63.75 £137.50 £88.30
Central London median hourly rate £32.50 £30.41 £35.00
% change year-on-year +6.89% -13.13% -16.67%

Business Case
Job Vacancy Trend in the City of London

Job postings citing Business Case as a proportion of all IT jobs advertised in the City of London.
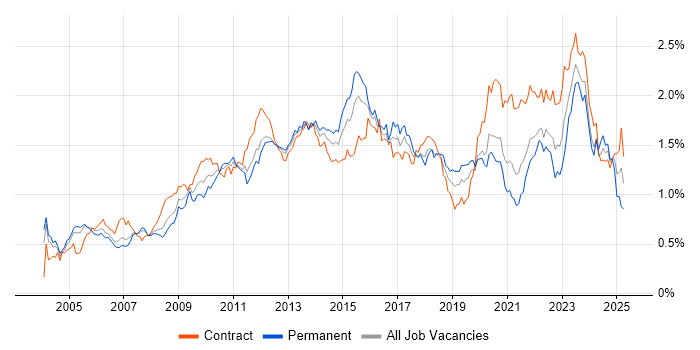
Job vacancy trend for Business Case in the City of London

Business Case
Contractor Daily Rate Trend in the City of London

3-month moving average daily rate quoted in jobs citing Business Case in the City of London.

Daily rate trend for Business Case in the City of London

Business Case
Daily Rate Histogram in the City of London

Daily rate distribution for jobs citing Business Case in the City of London over the 6 months to 23 July 2025.

Daily rate histogram for Business Case in the City of London

Business Case
Contractor Hourly Rate Trend in the City of London

3-month moving average hourly rates quoted in jobs citing Business Case in the City of London.

Hourly rate trend for Business Case in the City of London

Business Case
Co-occurring Skills and Capabilities in the City of London by Category

The follow tables expand on the table above by listing co-occurrences grouped by category. The same employment type, locality and period is covered with up to 20 co-occurrences shown in each of the following categories:

Application Platforms
1 5 (11.36%) Confluence
2 1 (2.27%) CMS
Applications
1 7 (15.91%) Microsoft Excel
2 3 (6.82%) Microsoft PowerPoint
3 2 (4.55%) Trello
Business Applications
1 2 (4.55%) Dynamics CRM
2 1 (2.27%) Loan IQ
2 1 (2.27%) SAP S/4HANA
Cloud Services
1 6 (13.64%) Azure
2 5 (11.36%) AWS
3 3 (6.82%) Azure DevOps
4 2 (4.55%) GCP
4 2 (4.55%) Google Play
5 1 (2.27%) Asana
5 1 (2.27%) Power Platform
5 1 (2.27%) SaaS
Communications & Networking
1 3 (6.82%) BGP
1 3 (6.82%) Firewall
1 3 (6.82%) Multicast
1 3 (6.82%) OSPF
1 3 (6.82%) Unicast
2 1 (2.27%) Intranet
Database & Business Intelligence
1 4 (9.09%) SQL Server
1 4 (9.09%) SQL Server Reporting Services
2 2 (4.55%) Data Lake
2 2 (4.55%) Data Warehouse
2 2 (4.55%) Oracle Database
3 1 (2.27%) Power BI
3 1 (2.27%) Power Query
3 1 (2.27%) Tableau
Development Applications
1 4 (9.09%) JIRA
General
1 22 (50.00%) Finance
2 13 (29.55%) Analytical Skills
2 13 (29.55%) Social Skills
3 8 (18.18%) Banking
4 5 (11.36%) Public Sector
5 4 (9.09%) Investment Banking
6 3 (6.82%) Organisational Skills
7 2 (4.55%) Documentation Skills
7 2 (4.55%) Law
7 2 (4.55%) Legal
7 2 (4.55%) Marketing
8 1 (2.27%) Back Office
8 1 (2.27%) Influencing Skills
Job Titles
1 15 (34.09%) Analyst
2 14 (31.82%) Business Analyst
3 6 (13.64%) Project Manager
4 5 (11.36%) Senior
5 4 (9.09%) Applications Developer
5 4 (9.09%) Automation Developer
5 4 (9.09%) Developer
5 4 (9.09%) Senior Manager
6 3 (6.82%) Digital Analyst
6 3 (6.82%) Digital Business Analyst
6 3 (6.82%) Network Engineer
7 2 (4.55%) Automation Engineer
7 2 (4.55%) Data Manager
7 2 (4.55%) Insurance Business Analyst
7 2 (4.55%) Marketing Manager
7 2 (4.55%) SC Cleared Business Analyst
7 2 (4.55%) Senior Marketing Manager
7 2 (4.55%) Senior Project Manager
7 2 (4.55%) Technical Analyst
7 2 (4.55%) Technical Business Analyst
Libraries, Frameworks & Software Standards
1 4 (9.09%) .NET
2 2 (4.55%) Redux
2 2 (4.55%) RESTful
3 1 (2.27%) Next.js
3 1 (2.27%) React
3 1 (2.27%) React Native
Miscellaneous
1 2 (4.55%) Mobile App
2 1 (2.27%) Greenfield Project
2 1 (2.27%) Legacy Systems
2 1 (2.27%) Management Information System
2 1 (2.27%) Reinsurance
2 1 (2.27%) Self-Motivation
2 1 (2.27%) Taxonomies
Operating Systems
1 2 (4.55%) Windows
Processes & Methodologies
1 22 (50.00%) Agile
2 15 (34.09%) Problem-Solving
3 12 (27.27%) Project Delivery
4 10 (22.73%) Decision-Making
5 9 (20.45%) Continuous Improvement
5 9 (20.45%) Stakeholder Management
6 7 (15.91%) Acceptance Criteria
6 7 (15.91%) DevOps
6 7 (15.91%) Project Management
6 7 (15.91%) Workshop Facilitation
7 6 (13.64%) Data Analysis
7 6 (13.64%) User Acceptance Testing
7 6 (13.64%) User Stories
7 6 (13.64%) Waterfall
8 5 (11.36%) Budgeting
8 5 (11.36%) Business Strategy
8 5 (11.36%) Workflow
9 4 (9.09%) Business Analysis
9 4 (9.09%) Change Management
9 4 (9.09%) PRINCE2
Programming Languages
1 5 (11.36%) C#
1 5 (11.36%) SQL
2 2 (4.55%) JavaScript
2 2 (4.55%) TypeScript
Qualifications
1 3 (6.82%) CCIE
1 3 (6.82%) Cisco Certification
1 3 (6.82%) PMP
1 3 (6.82%) PRINCE2 Certification
1 3 (6.82%) Security Cleared
2 2 (4.55%) PMI Certification
2 2 (4.55%) SC Cleared
3 1 (2.27%) ACCA
3 1 (2.27%) CCAB
3 1 (2.27%) CIMA
3 1 (2.27%) CISM
3 1 (2.27%) CISSP
Quality Assurance & Compliance
1 5 (11.36%) PMO
2 3 (6.82%) QA
3 2 (4.55%) SLA
4 1 (2.27%) Data Quality
4 1 (2.27%) GRC
Systems Management
1 3 (6.82%) Ansible
Vendors
1 6 (13.64%) Microsoft
2 4 (9.09%) Google
2 4 (9.09%) Oracle
3 3 (6.82%) Arista
4 2 (4.55%) Adobe
4 2 (4.55%) Atlassian
4 2 (4.55%) Salesforce
4 2 (4.55%) UiPath
5 1 (2.27%) Ariba
5 1 (2.27%) Guidewire
5 1 (2.27%) PeopleSoft
5 1 (2.27%) Qualys
5 1 (2.27%) SAP
5 1 (2.27%) ServiceNow