Continuous Improvement Contract Job Trends in the City of London

Continual Improvement
Central London > City of London

The table below provides summary statistics and contractor rates for jobs advertised in the City of London requiring Continuous Improvement skills. It covers contract job vacancies from the 6 months leading up to 30 October 2025, with comparisons to the same periods in the previous two years.

6 months to
30 Oct 2025
Same period 2024 Same period 2023
Rank 30 42 59
Rank change year-on-year +12 +17 +43
Contract jobs citing Continuous Improvement 111 92 97
As % of all contract jobs in the City of London 6.52% 4.39% 3.46%
As % of the Processes & Methodologies category 6.91% 4.78% 3.86%
Number of daily rates quoted 80 54 63
10th Percentile £281 £406 £400
25th Percentile £398 £500 £485
Median daily rate (50th Percentile) £519 £600 £550
Median % change year-on-year -13.54% +9.09% -3.34%
75th Percentile £664 £687 £650
90th Percentile £825 £775 £713
Central London median daily rate £515 £600 £550
% change year-on-year -14.17% +9.09% -3.51%
Number of hourly rates quoted 1 0 0
10th Percentile - - -
25th Percentile £32.00 - -
Median hourly rate £34.00 - -
75th Percentile £36.00 - -
90th Percentile - - -
Central London median hourly rate £26.44 - -

All Process and Methodology Skills
City of London

Continuous Improvement falls under the Processes and Methodologies category. For comparison with the information above, the following table provides summary statistics for all contract job vacancies requiring process or methodology skills in the City of London.

Contract vacancies with a requirement for process or methodology skills 1,606 1,925 2,510
As % of all contract IT jobs advertised in the City of London 94.36% 91.75% 89.55%
Number of daily rates quoted 1,114 1,182 1,755
10th Percentile £325 £363 £363
25th Percentile £420 £463 £463
Median daily rate (50th Percentile) £550 £575 £585
Median % change year-on-year -4.35% -1.71% +1.74%
75th Percentile £675 £688 £696
90th Percentile £763 £783 £800
Central London median daily rate £550 £575 £575
% change year-on-year -4.35% - -
Number of hourly rates quoted 18 17 16
10th Percentile £16.90 £16.70 £14.25
25th Percentile £21.07 £23.13 £17.00
Median hourly rate £27.75 £42.50 £31.25
Median % change year-on-year -34.71% +36.00% -33.33%
75th Percentile £44.63 £112.00 £48.19
90th Percentile £63.75 £137.50 £60.88
Central London median hourly rate £27.75 £35.00 £27.50
% change year-on-year -20.71% +27.27% -36.22%

Continuous Improvement
Job Vacancy Trend in the City of London

Historical trend showing the proportion of contract IT job postings citing Continuous Improvement relative to all contract IT jobs advertised in the City of London.
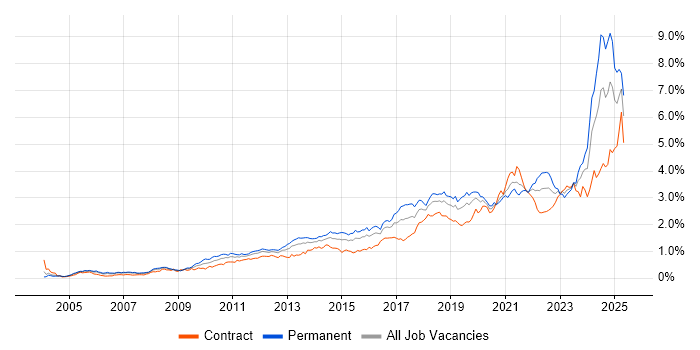
Continuous Improvement job vacancy trend in the City of London

Continuous Improvement
Daily Rate Trend in the City of London

Contractor daily rate distribution trend for jobs in the City of London citing Continuous Improvement.

Contractor daily rate distribution trend for jobs in the City of London citing Continuous Improvement

Continuous Improvement
Daily Rate Histogram in the City of London

Daily rate distribution for jobs citing Continuous Improvement in the City of London over the 6 months to 30 October 2025.

Daily rate histogram for Continuous Improvement in the City of London

Continuous Improvement
Hourly Rate Trend in the City of London

Contractor hourly rate distribution trend for jobs in the City of London citing Continuous Improvement.

Contractor hourly rate distribution trend for jobs in the City of London citing Continuous Improvement

Continuous Improvement
Contract Job Locations in the City of London

The table below looks at the demand and provides a guide to the median contractor rates quoted in IT jobs citing Continuous Improvement within the City of London region over the 6 months to 30 October 2025. The 'Rank Change' column provides an indication of the change in demand within each location based on the same 6 month period last year.

Location Rank Change
on Same Period
Last Year
Matching
Contract
IT Job Ads
Median
Daily Rate
Past 6 Months
Median Daily Rate
% Change
on Same Period
Last Year
Live
Jobs
London Bridge - 1 £725 - 1
Continuous Improvement
Central London

Continuous Improvement
Co-Occurring Skills & Capabilities in the City of London by Category

The following tables expand on the one above by listing co-occurrences grouped by category. They cover the same employment type, locality and period, with up to 20 co-occurrences shown in each category:

Application Platforms
1 6 (5.41%) Confluence
1 6 (5.41%) SharePoint
2 1 (0.90%) Apache
2 1 (0.90%) Apache Airflow
2 1 (0.90%) Microsoft Exchange
2 1 (0.90%) nginx
Applications
1 12 (10.81%) Microsoft Excel
2 3 (2.70%) Microsoft Office
2 3 (2.70%) Microsoft PowerPoint
3 2 (1.80%) MS Visio
3 2 (1.80%) Spreadsheet
4 1 (0.90%) Microsoft Project
Business Applications
1 8 (7.21%) Endur
2 1 (0.90%) NetSuite
2 1 (0.90%) Oracle Assets
2 1 (0.90%) Oracle Cash Management
2 1 (0.90%) Oracle EBS
2 1 (0.90%) Oracle Procure-to-Pay
2 1 (0.90%) Remedy ITSM
2 1 (0.90%) SAP MDG
Cloud Services
1 24 (21.62%) Azure
2 18 (16.22%) AWS
3 11 (9.91%) Azure DevOps
3 11 (9.91%) Power Platform
4 8 (7.21%) SaaS
5 5 (4.50%) GitHub
5 5 (4.50%) Microsoft 365
6 4 (3.60%) GCP
6 4 (3.60%) Power Automate
7 3 (2.70%) AWS CloudFormation
7 3 (2.70%) Entra ID
7 3 (2.70%) GitHub Actions
7 3 (2.70%) Microsoft Copilot
7 3 (2.70%) PowerApps
7 3 (2.70%) Serverless
8 2 (1.80%) Amazon CloudWatch
8 2 (1.80%) Amazon ECS
8 2 (1.80%) Amazon S3
8 2 (1.80%) IaaS
8 2 (1.80%) PaaS
Communications & Networking
1 2 (1.80%) Firewall
1 2 (1.80%) Intrusion Detection
1 2 (1.80%) LAN
1 2 (1.80%) Modbus
2 1 (0.90%) DNS
2 1 (0.90%) Network Security
2 1 (0.90%) VPN
2 1 (0.90%) WAN
2 1 (0.90%) Wi-Fi
Database & Business Intelligence
1 9 (8.11%) Power BI
2 5 (4.50%) Data Mining
2 5 (4.50%) SQL Server
3 3 (2.70%) MySQL
4 2 (1.80%) Airbyte
4 2 (1.80%) Geospatial Data
4 2 (1.80%) NoSQL
4 2 (1.80%) Redis
4 2 (1.80%) Relational Database
4 2 (1.80%) Spatial Data
5 1 (0.90%) Amazon Aurora
5 1 (0.90%) Amazon RDS
5 1 (0.90%) Apache Cassandra
5 1 (0.90%) Couchbase
5 1 (0.90%) CouchDB
5 1 (0.90%) DynamoDB
5 1 (0.90%) MongoDB
5 1 (0.90%) Power Query
5 1 (0.90%) SAP Data Services
5 1 (0.90%) Tableau
Development Applications
1 15 (13.51%) JIRA
2 7 (6.31%) Git
3 3 (2.70%) Jenkins
3 3 (2.70%) Postman
4 2 (1.80%) Cypress.io
4 2 (1.80%) Gradle
4 2 (1.80%) REST Assured
4 2 (1.80%) Selenium
4 2 (1.80%) Team Foundation Server
5 1 (0.90%) Appium
5 1 (0.90%) Bitbucket
5 1 (0.90%) Cucumber
5 1 (0.90%) GitLab
5 1 (0.90%) JUnit
5 1 (0.90%) SoapUI
5 1 (0.90%) TestRail
General
1 52 (46.85%) Social Skills
2 42 (37.84%) Finance
3 25 (22.52%) Analytical Skills
4 16 (14.41%) Banking
5 8 (7.21%) Legal
5 8 (7.21%) Public Sector
6 7 (6.31%) Investment Banking
7 4 (3.60%) Documentation Skills
7 4 (3.60%) Influencing Skills
8 3 (2.70%) Manufacturing
8 3 (2.70%) Telecoms
9 2 (1.80%) Back Office
9 2 (1.80%) Financial Institution
9 2 (1.80%) Marketing
10 1 (0.90%) Automotive
10 1 (0.90%) French Language
10 1 (0.90%) General Ledger
10 1 (0.90%) International Banking
10 1 (0.90%) Law
10 1 (0.90%) Military
Job Titles
1 21 (18.92%) Analyst
2 13 (11.71%) Developer
2 13 (11.71%) Senior
3 12 (10.81%) Business Analyst
4 11 (9.91%) Lead
5 8 (7.21%) Consultant
6 6 (5.41%) Endur Support
6 6 (5.41%) OpenLink Support
6 6 (5.41%) Senior Consultant
7 5 (4.50%) Risk Consultant
8 4 (3.60%) Security Engineer
8 4 (3.60%) Technical Analyst
9 3 (2.70%) Designer
9 3 (2.70%) IT Analyst
9 3 (2.70%) Java Developer
9 3 (2.70%) Process Analyst
9 3 (2.70%) Project Manager
9 3 (2.70%) Senior Analyst
9 3 (2.70%) Systems Analyst
10 2 (1.80%) OpenLink Developer
Libraries, Frameworks & Software Standards
1 8 (7.21%) .NET
2 4 (3.60%) REST
2 4 (3.60%) RESTful
3 3 (2.70%) Middleware
3 3 (2.70%) OAuth
3 3 (2.70%) OAuth2
3 3 (2.70%) React
3 3 (2.70%) Spring
4 2 (1.80%) AngularJS
4 2 (1.80%) FastAPI
4 2 (1.80%) Node.js
4 2 (1.80%) Spring Boot
5 1 (0.90%) Entity Framework
5 1 (0.90%) Flutter
5 1 (0.90%) GraphQL
5 1 (0.90%) JWT
5 1 (0.90%) Memcached
5 1 (0.90%) Regular Expression
5 1 (0.90%) Spring Batch
5 1 (0.90%) Vue
Miscellaneous
1 10 (9.01%) Product Ownership
2 6 (5.41%) Management Information System
3 5 (4.50%) Market Risk
4 4 (3.60%) Greenfield Project
4 4 (3.60%) Legacy Systems
5 3 (2.70%) Onboarding
5 3 (2.70%) Operational Technology
5 3 (2.70%) SCADA
6 2 (1.80%) Algorithms
6 2 (1.80%) Analytical Mindset
6 2 (1.80%) Cloud Native
6 2 (1.80%) Data Structures
6 2 (1.80%) Distributed Systems
6 2 (1.80%) Insider Threat
6 2 (1.80%) Life Science
6 2 (1.80%) Reinsurance
6 2 (1.80%) Renewable Energy
6 2 (1.80%) Security Posture
7 1 (0.90%) Industry 4.0
7 1 (0.90%) Self-Motivation
Operating Systems
1 6 (5.41%) Windows
2 3 (2.70%) Linux
2 3 (2.70%) Unix
3 1 (0.90%) Mac OS
3 1 (0.90%) Red Hat Enterprise Linux
3 1 (0.90%) Solaris
3 1 (0.90%) Windows 10
3 1 (0.90%) Windows Server
Processes & Methodologies
1 47 (42.34%) Agile
2 38 (34.23%) Problem-Solving
3 27 (24.32%) DevOps
4 22 (19.82%) Stakeholder Engagement
5 16 (14.41%) CI/CD
6 15 (13.51%) Analytics
6 15 (13.51%) Scrum
7 14 (12.61%) Stakeholder Management
8 12 (10.81%) Project Delivery
9 11 (9.91%) Business Intelligence
9 11 (9.91%) Project Management
9 11 (9.91%) SDLC
9 11 (9.91%) Service Delivery
10 10 (9.01%) Decision-Making
10 10 (9.01%) Roadmaps
11 9 (8.11%) Risk Management
11 9 (8.11%) User Acceptance Testing
12 8 (7.21%) Workshop Facilitation
13 7 (6.31%) Collaborative Working
13 7 (6.31%) Sprint Planning
Programming Languages
1 20 (18.02%) SQL
2 14 (12.61%) Python
3 12 (10.81%) Java
4 6 (5.41%) C#
4 6 (5.41%) PowerShell
5 4 (3.60%) JavaScript
6 3 (2.70%) Bash
7 2 (1.80%) PL/SQL
7 2 (1.80%) VBA
8 1 (0.90%) C++
8 1 (0.90%) Go
8 1 (0.90%) Korn
8 1 (0.90%) Perl
8 1 (0.90%) PHP
8 1 (0.90%) PromQL
8 1 (0.90%) R
8 1 (0.90%) TypeScript
Qualifications
1 12 (10.81%) Degree
2 9 (8.11%) Security Cleared
3 7 (6.31%) SC Cleared
4 5 (4.50%) BPSS Clearance
4 5 (4.50%) Computer Science Degree
5 2 (1.80%) CBAP
5 2 (1.80%) CCNA
5 2 (1.80%) CCNP
5 2 (1.80%) Cisco Certification
5 2 (1.80%) ISEB
5 2 (1.80%) Microsoft Certification
5 2 (1.80%) PMI Certification
5 2 (1.80%) PMP
6 1 (0.90%) APMG
6 1 (0.90%) CCAB
6 1 (0.90%) CISSP
6 1 (0.90%) DV Cleared
6 1 (0.90%) ITIL Foundation Certificate
6 1 (0.90%) Postgraduate
6 1 (0.90%) Six Sigma Green Belt
Quality Assurance & Compliance
1 10 (9.01%) QA
2 5 (4.50%) Basel II
3 3 (2.70%) Accessibility
3 3 (2.70%) Data Quality
4 2 (1.80%) GRC
4 2 (1.80%) ISO/IEC 27001
4 2 (1.80%) ISO/IEC 27002 (supersedes ISO/IEC 17799)
4 2 (1.80%) PMO
4 2 (1.80%) SLA
5 1 (0.90%) COBIT
5 1 (0.90%) COSO
5 1 (0.90%) Cyber Essentials
5 1 (0.90%) Cyber Essentials PLUS
5 1 (0.90%) GAAP
5 1 (0.90%) GDPR
5 1 (0.90%) IFRS
5 1 (0.90%) ISO 14001
5 1 (0.90%) PCI DSS
5 1 (0.90%) Sarbanes-Oxley
5 1 (0.90%) WCAG
System Software
1 5 (4.50%) Docker
2 4 (3.60%) Active Directory
3 2 (1.80%) Virtual Machines
Systems Management
1 6 (5.41%) ITRS Geneos
2 5 (4.50%) Terraform
3 4 (3.60%) Kubernetes
4 3 (2.70%) SCCM
5 2 (1.80%) Microsoft Intune
6 1 (0.90%) Ansible
6 1 (0.90%) Consul
6 1 (0.90%) Grafana
6 1 (0.90%) HP ALM
6 1 (0.90%) Packer
6 1 (0.90%) Prometheus
6 1 (0.90%) QRadar
Vendors
1 25 (22.52%) Microsoft
2 5 (4.50%) Oracle
2 5 (4.50%) Salesforce
2 5 (4.50%) SAP
3 4 (3.60%) ServiceNow
4 3 (2.70%) Informatica
5 2 (1.80%) Alteryx
5 2 (1.80%) Blue Prism
5 2 (1.80%) Google
5 2 (1.80%) OpenLink
5 2 (1.80%) Rockwell
5 2 (1.80%) Splunk
5 2 (1.80%) UiPath
6 1 (0.90%) Automation Anywhere
6 1 (0.90%) Exabeam
6 1 (0.90%) OpenAI
6 1 (0.90%) Rollbar
6 1 (0.90%) Tanium
6 1 (0.90%) Tenable
6 1 (0.90%) Xactly