Confluence Contract Job Trends in the City of London

Confluence
Central London > City of London

The table below provides summary statistics and contractor rates for jobs advertised in the City of London requiring Confluence skills. It covers contract job vacancies from the 6 months leading up to 27 November 2025, with comparisons to the same periods in the previous two years.

6 months to
27 Nov 2025
Same period 2024 Same period 2023
Rank 59 82 90
Rank change year-on-year +23 +8 +5
Contract jobs citing Confluence 69 47 56
As % of all contract jobs in the City of London 3.82% 2.17% 2.11%
As % of the Application Platforms category 32.09% 18.58% 16.77%
Number of daily rates quoted 54 26 29
10th Percentile £311 £372 £395
25th Percentile £402 £445 £513
Median daily rate (50th Percentile) £500 £556 £600
Median % change year-on-year -10.11% -7.29% -4.00%
75th Percentile £638 £630 £658
90th Percentile £695 £838 £790
Central London median daily rate £500 £550 £588
% change year-on-year -9.09% -6.38% -6.37%
Number of hourly rates quoted 1 0 0
10th Percentile - - -
25th Percentile £86.25 - -
Median hourly rate £87.50 - -
75th Percentile £88.75 - -
90th Percentile - - -
Central London median hourly rate £87.50 - -

All Application Platform Skills
City of London

Confluence falls under the Application Platforms category. For comparison with the information above, the following table provides summary statistics for all contract job vacancies requiring application platform skills in the City of London.

Contract vacancies with a requirement for application platform skills 215 253 334
As % of all contract IT jobs advertised in the City of London 11.90% 11.68% 12.57%
Number of daily rates quoted 155 140 211
10th Percentile £308 £325 £260
25th Percentile £406 £363 £400
Median daily rate (50th Percentile) £525 £538 £525
Median % change year-on-year -2.33% +2.38% -4.55%
75th Percentile £622 £627 £627
90th Percentile £688 £762 £700
Central London median daily rate £525 £535 £525
% change year-on-year -1.87% +1.90% -4.55%
Number of hourly rates quoted 2 2 4
10th Percentile £63.75 - -
25th Percentile £67.50 £112.50 £17.00
Median hourly rate £75.00 £125.00 £19.00
Median % change year-on-year -40.00% +557.89% +12.19%
75th Percentile £82.50 £137.50 £21.69
90th Percentile £86.25 - £22.93
Central London median hourly rate £62.50 £80.00 £19.00
% change year-on-year -21.88% +321.05% +12.19%

Confluence
Job Vacancy Trend in the City of London

Historical trend showing the proportion of contract IT job postings citing Confluence relative to all contract IT jobs advertised in the City of London.
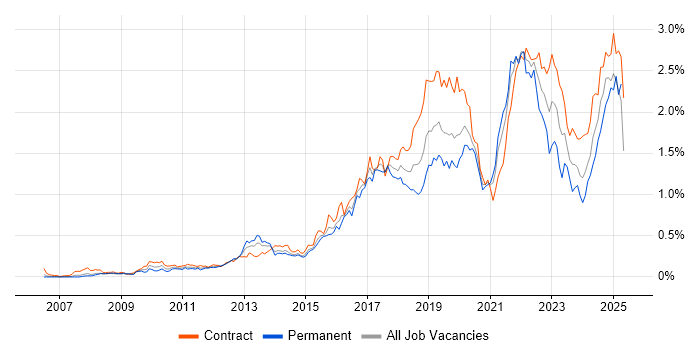
Confluence job vacancy trend in the City of London

Confluence
Daily Rate Trend in the City of London

Contractor daily rate distribution trend for jobs in the City of London citing Confluence.

Contractor daily rate distribution trend for jobs in the City of London citing Confluence

Confluence
Daily Rate Histogram in the City of London

Daily rate distribution for jobs citing Confluence in the City of London over the 6 months to 27 November 2025.

Daily rate histogram for Confluence in the City of London

Confluence
Contract Job Locations in the City of London

The table below looks at the demand and provides a guide to the median contractor rates quoted in IT jobs citing Confluence within the City of London region over the 6 months to 27 November 2025. The 'Rank Change' column provides an indication of the change in demand within each location based on the same 6 month period last year.

Location Rank Change
on Same Period
Last Year
Matching
Contract
IT Job Ads
Median
Daily Rate
Past 6 Months
Median Daily Rate
% Change
on Same Period
Last Year
Live
Jobs
London Bridge - 1 - -
Confluence
Central London

Confluence
Co-Occurring Skills & Capabilities in the City of London by Category

The following tables expand on the one above by listing co-occurrences grouped by category. They cover the same employment type, locality and period, with up to 20 co-occurrences shown in each category:

Application Platforms
1 5 (7.25%) SharePoint
2 1 (1.45%) Camunda
2 1 (1.45%) nginx
2 1 (1.45%) Oracle SOA Suite
2 1 (1.45%) WordPress
Applications
1 11 (15.94%) MS Visio
2 9 (13.04%) Microsoft Excel
3 3 (4.35%) Microsoft Office
3 3 (4.35%) Microsoft PowerPoint
3 3 (4.35%) Microsoft Project
3 3 (4.35%) Trello
Business Applications
1 2 (2.90%) Fidessa
1 2 (2.90%) Remedy ITSM
2 1 (1.45%) Oracle BPM
2 1 (1.45%) SAP S/4HANA
Cloud Services
1 9 (13.04%) AWS
1 9 (13.04%) Azure
2 6 (8.70%) GitHub
2 6 (8.70%) Power Platform
3 4 (5.80%) Amazon CloudWatch
3 4 (5.80%) Azure DevOps
4 3 (4.35%) Amazon EC2
4 3 (4.35%) Amazon S3
5 2 (2.90%) Amazon ECS
5 2 (2.90%) Amazon EKS
5 2 (2.90%) AWS CloudFormation
5 2 (2.90%) AWS Lambda
5 2 (2.90%) Dynamics 365
5 2 (2.90%) GitHub Actions
5 2 (2.90%) Microsoft 365
5 2 (2.90%) PaaS
5 2 (2.90%) Power Automate
5 2 (2.90%) PowerApps
5 2 (2.90%) SaaS
5 2 (2.90%) Serverless
Communications & Networking
1 2 (2.90%) DNS
1 2 (2.90%) Firewall
1 2 (2.90%) SSL
2 1 (1.45%) DHCP
2 1 (1.45%) NetScaler
2 1 (1.45%) OpenLDAP
2 1 (1.45%) SSH
Database & Business Intelligence
1 6 (8.70%) Power BI
2 3 (4.35%) Tableau
3 2 (2.90%) Amazon RDS
3 2 (2.90%) Metadata
3 2 (2.90%) Tick Data
4 1 (1.45%) Amazon Aurora
4 1 (1.45%) CouchDB
4 1 (1.45%) Data Warehouse
4 1 (1.45%) Hadoop
4 1 (1.45%) MySQL
4 1 (1.45%) NoSQL
4 1 (1.45%) Oracle Database
4 1 (1.45%) PostgreSQL
4 1 (1.45%) Redis
4 1 (1.45%) SQL Server
Development Applications
1 65 (94.20%) JIRA
2 6 (8.70%) Git
2 6 (8.70%) Jenkins
3 4 (5.80%) Bitbucket
4 3 (4.35%) GitLab
4 3 (4.35%) SonarQube
4 3 (4.35%) Sonatype Nexus
5 2 (2.90%) Cypress.io
5 2 (2.90%) Maven
5 2 (2.90%) Postman
5 2 (2.90%) Selenium
6 1 (1.45%) Android Studio
6 1 (1.45%) Cucumber
6 1 (1.45%) Gatling
6 1 (1.45%) Hamcrest
6 1 (1.45%) JUnit
6 1 (1.45%) ScriptRunner
6 1 (1.45%) Serenity BDD
6 1 (1.45%) TeamCity
6 1 (1.45%) Zephyr
General
1 23 (33.33%) Finance
1 23 (33.33%) Social Skills
2 20 (28.99%) Analytical Skills
3 13 (18.84%) Banking
4 6 (8.70%) Public Sector
5 5 (7.25%) Documentation Skills
6 4 (5.80%) Organisational Skills
7 3 (4.35%) Front Office
7 3 (4.35%) Legal
7 3 (4.35%) Retail
7 3 (4.35%) Telecoms
8 2 (2.90%) Investment Banking
8 2 (2.90%) Retail Banking
9 1 (1.45%) Back Office
9 1 (1.45%) Financial Institution
9 1 (1.45%) Influencing Skills
9 1 (1.45%) Private Banking
Job Titles
1 20 (28.99%) Analyst
2 18 (26.09%) Business Analyst
3 12 (17.39%) Senior
4 8 (11.59%) Developer
5 5 (7.25%) Project Manager
5 5 (7.25%) Senior Analyst
6 4 (5.80%) Architect
6 4 (5.80%) Lead
6 4 (5.80%) Senior Business Analyst
7 3 (4.35%) Agile Business Analyst
7 3 (4.35%) Payments Analyst
7 3 (4.35%) Payments Business Analyst
7 3 (4.35%) Product Owner
7 3 (4.35%) Scrum Master
7 3 (4.35%) Solutions Architect
8 2 (2.90%) Front-End Developer (Client-Side Developer)
8 2 (2.90%) Information Assurance Specialist
8 2 (2.90%) Information Security Specialist
8 2 (2.90%) Senior Architect
8 2 (2.90%) Technical Leader
Libraries, Frameworks & Software Standards
1 5 (7.25%) HTML
2 4 (5.80%) AngularJS
2 4 (5.80%) HTML5
2 4 (5.80%) REST
2 4 (5.80%) Spring
3 3 (4.35%) CSS
3 3 (4.35%) LDAP
3 3 (4.35%) React
3 3 (4.35%) Web Services
4 2 (2.90%) .NET
4 2 (2.90%) Apache Camel
4 2 (2.90%) JDBC
4 2 (2.90%) jQuery
4 2 (2.90%) JSON
4 2 (2.90%) Next.js
4 2 (2.90%) ODBC
4 2 (2.90%) RabbitMQ
4 2 (2.90%) SAML
4 2 (2.90%) SOAP
5 1 (1.45%) WireMock
Miscellaneous
1 10 (14.49%) Product Ownership
2 4 (5.80%) Management Information System
2 4 (5.80%) SWIFT Messaging Network
3 3 (4.35%) Equities
3 3 (4.35%) Self-Motivation
4 2 (2.90%) Data Centre
4 2 (2.90%) Derivative
4 2 (2.90%) NHS
5 1 (1.45%) Cloud Native
5 1 (1.45%) Credit Risk
5 1 (1.45%) Cyber Threat
5 1 (1.45%) e-Learning
5 1 (1.45%) Fixed Income
5 1 (1.45%) Foreign Exchange (FX)
5 1 (1.45%) Market Risk
5 1 (1.45%) PACS
5 1 (1.45%) PMI
5 1 (1.45%) Replication
5 1 (1.45%) Tandem
5 1 (1.45%) Taxonomies
Operating Systems
1 3 (4.35%) Windows
2 2 (2.90%) Linux
2 2 (2.90%) Unix
3 1 (1.45%) Android
Processes & Methodologies
1 50 (72.46%) Agile
2 22 (31.88%) Stakeholder Management
3 17 (24.64%) Scrum
4 16 (23.19%) Stakeholder Engagement
5 15 (21.74%) Problem-Solving
6 14 (20.29%) User Stories
7 12 (17.39%) DevOps
7 12 (17.39%) Roadmaps
7 12 (17.39%) User Acceptance Testing
8 11 (15.94%) Acceptance Criteria
8 11 (15.94%) Migration
8 11 (15.94%) Project Management
9 9 (13.04%) CI/CD
9 9 (13.04%) Continuous Improvement
9 9 (13.04%) Project Delivery
9 9 (13.04%) Requirements Gathering
9 9 (13.04%) Workshop Facilitation
10 8 (11.59%) Risk Management
10 8 (11.59%) Waterfall
11 6 (8.70%) Business Intelligence
Programming Languages
1 9 (13.04%) SQL
2 7 (10.14%) Java
3 6 (8.70%) JavaScript
3 6 (8.70%) Python
4 2 (2.90%) Apex Code
4 2 (2.90%) TypeScript
5 1 (1.45%) Bash
5 1 (1.45%) Go
5 1 (1.45%) Groovy
5 1 (1.45%) Kotlin
5 1 (1.45%) PHP
Qualifications
1 18 (26.09%) SC Cleared
1 18 (26.09%) Security Cleared
2 8 (11.59%) Degree
3 4 (5.80%) BPSS Clearance
4 2 (2.90%) CESG Certified Professional
4 2 (2.90%) CISSP
4 2 (2.90%) Computer Science Degree
4 2 (2.90%) PMI Certification
5 1 (1.45%) CBAP
5 1 (1.45%) CFA
5 1 (1.45%) CSPO
5 1 (1.45%) ITIL Foundation Certificate
5 1 (1.45%) PMP
Quality Assurance & Compliance
1 7 (10.14%) QA
2 3 (4.35%) ISO 20022
2 3 (4.35%) PMO
3 2 (2.90%) Accessibility
3 2 (2.90%) GDPR
3 2 (2.90%) ISO/IEC 27001
3 2 (2.90%) NCSC
3 2 (2.90%) SEPA
4 1 (1.45%) COBIT
4 1 (1.45%) GRC
4 1 (1.45%) NIST
4 1 (1.45%) PSD2
4 1 (1.45%) WCAG
System Software
1 3 (4.35%) Docker
2 2 (2.90%) Active Directory
3 1 (1.45%) Microsoft App-V
Systems Management
1 2 (2.90%) Ansible
1 2 (2.90%) Kubernetes
1 2 (2.90%) Single Sign-On
1 2 (2.90%) Terraform
2 1 (1.45%) Ambari
2 1 (1.45%) Consul
2 1 (1.45%) Opsgenie
2 1 (1.45%) Packer
2 1 (1.45%) Puppet
2 1 (1.45%) RSA Archer
2 1 (1.45%) ZABBIX
Vendors
1 15 (21.74%) Microsoft
2 6 (8.70%) Atlassian
3 4 (5.80%) ServiceNow
4 3 (4.35%) Salesforce
5 2 (2.90%) BMC
5 2 (2.90%) Citrix
5 2 (2.90%) DocuSign
5 2 (2.90%) Google
5 2 (2.90%) HP
5 2 (2.90%) Ivanti
5 2 (2.90%) Remedy
5 2 (2.90%) Solace
6 1 (1.45%) Bloomberg
6 1 (1.45%) CA Agile Central
6 1 (1.45%) Duck Creek
6 1 (1.45%) IBM
6 1 (1.45%) MuleSoft
6 1 (1.45%) SAP
6 1 (1.45%) Sonatype
6 1 (1.45%) Splunk