Performance Monitoring Contract Job Trends in the City of London

Performance Monitoring
Central London > City of London

The table below provides summary statistics and contractor rates for jobs advertised in the City of London requiring Performance Monitoring skills. It covers vacancies from the 6 months leading up to 13 September 2025, with comparisons to the same periods in the previous two years.

6 months to
13 Sep 2025
Same period 2024 Same period 2023
Rank 104 120 151
Rank change year-on-year +16 +31 +39
Contract jobs citing Performance Monitoring 14 4 5
As % of all contract jobs advertised in the City of London 0.78% 0.19% 0.16%
As % of the Processes & Methodologies category 0.83% 0.21% 0.18%
Number of daily rates quoted 11 4 4
10th Percentile £385 £504 £437
25th Percentile £429 £509 £550
Median daily rate (50th Percentile) £600 £525 £614
Median % change year-on-year +14.29% -14.43% -12.04%
75th Percentile £649 £623 £636
90th Percentile £700 £776 £675
Central London median daily rate £560 £525 £612
% change year-on-year +6.67% -14.22% +2.00%

All Process and Methodology Skills
City of London

Performance Monitoring falls under the Processes and Methodologies category. For comparison with the information above, the following table provides summary statistics for all contract job vacancies requiring process or methodology skills in the City of London.

Contract vacancies with a requirement for process or methodology skills 1,686 1,923 2,807
As % of all contract IT jobs advertised in the City of London 94.14% 92.10% 90.37%
Number of daily rates quoted 1,117 1,231 1,943
10th Percentile £325 £388 £363
25th Percentile £424 £475 £475
Median daily rate (50th Percentile) £550 £575 £600
Median % change year-on-year -4.35% -4.17% +4.35%
75th Percentile £675 £688 £713
90th Percentile £774 £788 £813
Central London median daily rate £550 £575 £600
% change year-on-year -4.35% -4.17% +4.35%
Number of hourly rates quoted 22 17 14
10th Percentile £17.35 £15.20 £14.25
25th Percentile £23.98 £20.22 £14.84
Median hourly rate £28.33 £27.00 £31.25
Median % change year-on-year +4.91% -13.60% -27.33%
75th Percentile £53.50 £78.75 £49.96
90th Percentile £63.75 £137.50 £64.03
Central London median hourly rate £29.07 £35.00 £27.50
% change year-on-year -16.94% +27.27% -35.29%

Performance Monitoring
Job Vacancy Trend in the City of London

Job postings citing Performance Monitoring as a proportion of all IT jobs advertised in the City of London.
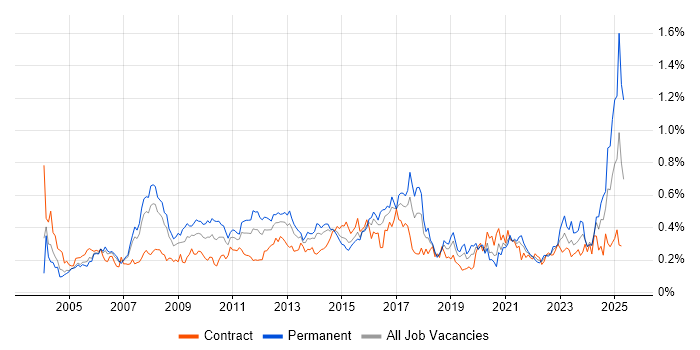
Job vacancy trend for Performance Monitoring in the City of London

Performance Monitoring
Daily Rate Trend in the City of London

Contractor daily rate distribution trend for jobs in the City of London citing Performance Monitoring.

Contractor daily rate distribution trend for jobs in the City of London citing Performance Monitoring

Performance Monitoring
Daily Rate Histogram in the City of London

Daily rate distribution for jobs citing Performance Monitoring in the City of London over the 6 months to 13 September 2025.

Daily rate histogram for Performance Monitoring in the City of London

Performance Monitoring
Hourly Rate Trend in the City of London

Contractor hourly rate distribution trend for jobs in the City of London citing Performance Monitoring.

Contractor hourly rate distribution trend for jobs in the City of London citing Performance Monitoring

Performance Monitoring
Contract Job Locations in the City of London

The table below looks at the demand and provides a guide to the median contractor rates quoted in IT jobs citing Performance Monitoring within the City of London region over the 6 months to 13 September 2025. The 'Rank Change' column provides an indication of the change in demand within each location based on the same 6 month period last year.

Location Rank Change
on Same Period
Last Year
Matching
Contract
IT Job Ads
Median
Daily Rate
Past 6 Months
Median Daily Rate
% Change
on Same Period
Last Year
Live
Jobs
Moorgate - 1 £390 -
Performance Monitoring
Central London

Performance Monitoring
Co-occurring Skills and Capabilities in the City of London by Category

The follow tables expand on the table above by listing co-occurrences grouped by category. The same employment type, locality and period is covered with up to 20 co-occurrences shown in each of the following categories:

Application Platforms
1 1 (7.14%) WebSphere
Cloud Services
1 3 (21.43%) AWS
2 2 (14.29%) Amazon EC2
3 1 (7.14%) Amazon CloudWatch
3 1 (7.14%) Amazon S3
3 1 (7.14%) AWS CodePipeline
3 1 (7.14%) AWS Lambda
3 1 (7.14%) Azure
3 1 (7.14%) Firebase
3 1 (7.14%) GCP
3 1 (7.14%) GitHub
3 1 (7.14%) GitHub Actions
3 1 (7.14%) SaaS
3 1 (7.14%) Serverless
3 1 (7.14%) SuccessFactors
3 1 (7.14%) Virtual Private Cloud
Communications & Networking
1 1 (7.14%) DNS
1 1 (7.14%) Internet
1 1 (7.14%) NAS
1 1 (7.14%) Remote Desktop
1 1 (7.14%) SAN
1 1 (7.14%) SSH
1 1 (7.14%) TCP/IP
1 1 (7.14%) VPN
Database & Business Intelligence
1 1 (7.14%) Amazon RDS
1 1 (7.14%) KDB
1 1 (7.14%) Kdb+
1 1 (7.14%) Oracle Database
Development Applications
1 2 (14.29%) Cypress.io
1 2 (14.29%) Storybook
2 1 (7.14%) Artifactory
2 1 (7.14%) Atlassian Bamboo
2 1 (7.14%) Git
2 1 (7.14%) GitLab
2 1 (7.14%) IBM UrbanCode
2 1 (7.14%) Jenkins
2 1 (7.14%) JIRA
2 1 (7.14%) QUnit
General
1 7 (50.00%) Finance
2 6 (42.86%) Banking
2 6 (42.86%) Social Skills
3 3 (21.43%) Analytical Skills
4 2 (14.29%) Public Sector
5 1 (7.14%) Financial Institution
5 1 (7.14%) Front Office
5 1 (7.14%) Investment Banking
5 1 (7.14%) Legal
Job Titles
1 2 (14.29%) AWS DevOps
1 2 (14.29%) AWS DevOps Engineer
1 2 (14.29%) AWS Engineer
1 2 (14.29%) DevOps Engineer
1 2 (14.29%) Front-End Engineer (Client-Side Engineer)
1 2 (14.29%) Senior
2 1 (7.14%) Analyst
2 1 (7.14%) Architect
2 1 (7.14%) Developer
2 1 (7.14%) KDB Developer
2 1 (7.14%) Lead
2 1 (7.14%) Mobile Architect
2 1 (7.14%) Payments Analyst
2 1 (7.14%) Senior Developer
2 1 (7.14%) Service Delivery Manager
2 1 (7.14%) Service Manager
2 1 (7.14%) Subject Matter Expert
2 1 (7.14%) Technical Analyst
2 1 (7.14%) Technical Architect
2 1 (7.14%) Windows Engineer
Libraries, Frameworks & Software Standards
1 3 (21.43%) RESTful
2 2 (14.29%) AngularJS
2 2 (14.29%) CSS
2 2 (14.29%) CSS3
2 2 (14.29%) Express.js
2 2 (14.29%) HTML
2 2 (14.29%) HTML5
2 2 (14.29%) Jest
2 2 (14.29%) React
3 1 (7.14%) Apollo GraphQL
3 1 (7.14%) GraphQL
3 1 (7.14%) JWT
3 1 (7.14%) OAuth
3 1 (7.14%) OAuth2
3 1 (7.14%) React Native
3 1 (7.14%) Redux
3 1 (7.14%) Spring
3 1 (7.14%) Spring Boot
3 1 (7.14%) Zustand
Miscellaneous
1 2 (14.29%) Mobile App
2 1 (7.14%) Algorithms
2 1 (7.14%) Fixed Income
2 1 (7.14%) Hybrid Cloud
2 1 (7.14%) Onboarding
2 1 (7.14%) Product Ownership
2 1 (7.14%) SWIFT Messaging Network
Operating Systems
1 3 (21.43%) Linux
2 2 (14.29%) Unix
3 1 (7.14%) Android
3 1 (7.14%) Apple iOS
3 1 (7.14%) Windows
Processes & Methodologies
1 6 (42.86%) CI/CD
2 5 (35.71%) DevOps
3 4 (28.57%) Agile
3 4 (28.57%) User Experience
4 3 (21.43%) Continuous Improvement
4 3 (21.43%) Fintech
4 3 (21.43%) Observability
4 3 (21.43%) Problem-Solving
4 3 (21.43%) Service Delivery
4 3 (21.43%) Stakeholder Management
5 2 (14.29%) Analytics
5 2 (14.29%) Collaborative Culture
5 2 (14.29%) DevSecOps
5 2 (14.29%) Front End Development
5 2 (14.29%) Infrastructure as Code
5 2 (14.29%) Infrastructure Automation
5 2 (14.29%) Load Balancing
5 2 (14.29%) Risk Management
5 2 (14.29%) Site Reliability Engineering
5 2 (14.29%) Stakeholder Engagement
Programming Languages
1 3 (21.43%) TypeScript
2 2 (14.29%) JavaScript
3 1 (7.14%) Bash
3 1 (7.14%) Java
3 1 (7.14%) Kotlin
3 1 (7.14%) Objective-C
3 1 (7.14%) Swift
Qualifications
1 2 (14.29%) SC Cleared
1 2 (14.29%) Security Cleared
2 1 (7.14%) Degree
2 1 (7.14%) PMI Certification
2 1 (7.14%) PMP
2 1 (7.14%) Postgraduate
Quality Assurance & Compliance
1 3 (21.43%) QA
2 1 (7.14%) Cyber Essentials
2 1 (7.14%) Cyber Essentials PLUS
2 1 (7.14%) ISO 20022
2 1 (7.14%) PMO
2 1 (7.14%) SEPA
2 1 (7.14%) SLA
System Software
1 1 (7.14%) Tivoli Workload Scheduler
Systems Management
1 2 (14.29%) Terraform
2 1 (7.14%) Ansible
2 1 (7.14%) Packer
2 1 (7.14%) Rundeck
2 1 (7.14%) Tivoli
2 1 (7.14%) yum
Vendors
1 2 (14.29%) Dynatrace
1 2 (14.29%) Microsoft
2 1 (7.14%) DocuSign
2 1 (7.14%) IBM
2 1 (7.14%) OpenText
2 1 (7.14%) Oracle
2 1 (7.14%) SAP