Development Operations Engineer
Central London > City of London
The median Development Operations Engineer daily rate in the City of London is £500, according to job vacancies posted in the 6 months leading up to 14 February 2026.
The table below compares current contractor rates and summary statistics with the previous two years.
| 6 months to 14 Feb 2026 |
Same period 2025 | Same period 2024 | |
|---|---|---|---|
| Rank | 72 | 74 | 94 |
| Rank change year-on-year | +2 | +20 | -18 |
| Contract jobs requiring a DevOps Engineer | 53 | 45 | 40 |
| As % of all contract jobs in the City of London | 2.75% | 2.47% | 1.66% |
| As % of the Job Titles category | 2.93% | 2.65% | 1.76% |
| Number of daily rates quoted | 49 | 29 | 31 |
| 10th Percentile | £356 | £421 | £400 |
| 25th Percentile | £413 | £505 | £460 |
| Median daily rate (50th Percentile) | £500 | £550 | £550 |
| Median % change year-on-year | -9.09% | - | -15.38% |
| 75th Percentile | £575 | £664 | £650 |
| 90th Percentile | £651 | £740 | £738 |
| Central London median daily rate | £500 | £543 | £550 |
| % change year-on-year | -7.83% | -1.36% | -12.00% |
All Contract IT Job Roles
City of London
For comparison with the information above, the following table provides summary statistics for all contract IT job vacancies in the City of London. Most job vacancies include a discernible job title that can be normalized. As such, the figures in the second row provide an indication of the number of contract jobs in our overall sample.
| Contract vacancies in the City of London with a recognized job title | 1,809 | 1,695 | 2,279 |
| % of contract IT jobs with a recognized job title | 93.97% | 92.98% | 94.60% |
| Number of daily rates quoted | 1,241 | 1,024 | 1,637 |
| 10th Percentile | £350 | £351 | £347 |
| 25th Percentile | £433 | £463 | £455 |
| Median daily rate (50th Percentile) | £538 | £575 | £563 |
| Median % change year-on-year | -6.52% | +2.22% | -4.66% |
| 75th Percentile | £675 | £676 | £688 |
| 90th Percentile | £775 | £779 | £788 |
| Central London median daily rate | £550 | £575 | £550 |
| % change year-on-year | -4.35% | +4.55% | -4.35% |
| Number of hourly rates quoted | 18 | 7 | 21 |
| 10th Percentile | £20.18 | £22.00 | £17.00 |
| 25th Percentile | £26.52 | £26.63 | £18.93 |
| Median hourly rate | £40.64 | £38.50 | £24.00 |
| Median % change year-on-year | +5.56% | +60.42% | -28.89% |
| 75th Percentile | £51.00 | £80.38 | £40.00 |
| 90th Percentile | £59.72 | £112.00 | £50.25 |
| Central London median hourly rate | £27.04 | £35.00 | £26.00 |
| % change year-on-year | -22.76% | +34.62% | -10.34% |
DevOps Engineer
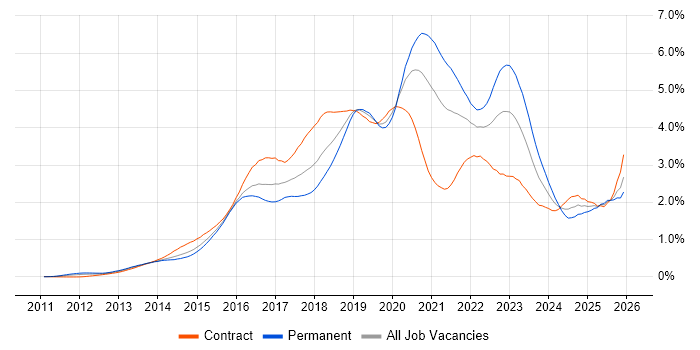
Job Vacancy Trend in the City of London
Historical trend showing the proportion of contract IT job postings featuring 'DevOps Engineer' in the job title relative to all contract IT jobs advertised in the City of London.

DevOps Engineer
Daily Rate Trend in the City of London
Contractor daily rate distribution trend for DevOps Engineer job vacancies in the City of London.

DevOps Engineer
Daily Rate Histogram in the City of London
Daily rate distribution for jobs citing DevOps Engineer in the City of London over the 6 months to 14 February 2026.
DevOps Engineer Skill Set
Top 30 Co-Occurring Skills & Capabilities in the City of London
For the 6 months to 14 February 2026, DevOps Engineer contract job roles required the following skills and capabilities in order of popularity. The figures indicate the absolute number of co-occurrences and as a proportion of all contract job ads across the City of London region featuring DevOps Engineer in the job title.
|
|
DevOps Engineer Skill Set
Co-Occurring Skills & Capabilities in the City of London by Category
The following tables expand on the one above by listing co-occurrences grouped by category. They cover the same employment type, locality and period, with up to 20 co-occurrences shown in each category:
|
|
||||||||||||||||||||||||||||||||||||||||||||||||||||||||||||||||||||||||||||||||||||||||||||||||
|
|
||||||||||||||||||||||||||||||||||||||||||||||||||||||||||||||||||||||||||||||||||||||||||||||||
|
|
||||||||||||||||||||||||||||||||||||||||||||||||||||||||||||||||||||||||||||||||||||||||||||||||
|
|
||||||||||||||||||||||||||||||||||||||||||||||||||||||||||||||||||||||||||||||||||||||||||||||||
|
|
||||||||||||||||||||||||||||||||||||||||||||||||||||||||||||||||||||||||||||||||||||||||||||||||
|
|
||||||||||||||||||||||||||||||||||||||||||||||||||||||||||||||||||||||||||||||||||||||||||||||||
|
|
||||||||||||||||||||||||||||||||||||||||||||||||||||||||||||||||||||||||||||||||||||||||||||||||
|
|
||||||||||||||||||||||||||||||||||||||||||||||||||||||||||||||||||||||||||||||||||||||||||||||||
|
|||||||||||||||||||||||||||||||||||||||||||||||||||||||||||||||||||||||||||||||||||||||||||||||||
