Creative Thinking Contracts with Work from Home Options

Creative Thinking
UK > Work from Home

The table below provides summary statistics for contract job vacancies with an option to work from home (WFH) and a requirement for Creative Thinking skills. Included is a benchmarking guide to the contractor rates offered in vacancies that have cited Creative Thinking over the 6 months to 6 May 2024 with a comparison to the same period in the previous 2 years.

6 months to
6 May 2024
Same period 2023 Same period 2022
Rank 301 362 469
Rank change year-on-year +61 +107 -70
Contract jobs citing Creative Thinking 43 113 150
As % of all contract jobs with a WFH option 0.28% 0.44% 0.34%
As % of the Processes & Methodologies category 0.32% 0.49% 0.37%
Number of daily rates quoted 27 92 116
10th Percentile £348 £413 £356
25th Percentile £416 £463 £429
Median daily rate (50th Percentile) £515 £551 £523
Median % change year-on-year -6.58% +5.50% +26.67%
75th Percentile £594 £675 £625
90th Percentile £630 £775 £729
UK median daily rate £500 £550 £500
% change year-on-year -9.09% +10.00% +17.65%
Number of hourly rates quoted 2 0 0
10th Percentile £10.60 - -
25th Percentile £13.38 - -
Median hourly rate £20.01 - -
75th Percentile £24.89 - -
90th Percentile £26.62 - -
UK median hourly rate £19.50 £50.00 £16.93
% change year-on-year -61.00% +195.33% -23.05%

All Process and Methodology Skills
Work from Home

Creative Thinking is in the Processes and Methodologies category. The following table is for comparison with the above and provides summary statistics for all contract job vacancies with a WFH option and a requirement for process or methodology skills.

Contract vacancies with a requirement for process or methodology skills 13,387 22,922 40,601
As % of all contract jobs with a WFH option 87.93% 89.77% 91.08%
Number of daily rates quoted 8,971 16,192 29,477
10th Percentile £325 £363 £363
25th Percentile £425 £450 £431
Median daily rate (50th Percentile) £525 £540 £525
Median % change year-on-year -2.78% +2.86% +8.25%
75th Percentile £638 £650 £630
90th Percentile £750 £750 £725
UK median daily rate £525 £550 £530
% change year-on-year -4.55% +3.77% +8.72%
Number of hourly rates quoted 576 528 542
10th Percentile £15.08 £18.68 £13.75
25th Percentile £24.25 £30.00 £20.00
Median hourly rate £42.50 £55.00 £35.00
Median % change year-on-year -22.73% +57.14% +40.00%
75th Percentile £60.00 £68.81 £55.63
90th Percentile £75.13 £80.25 £67.50
UK median hourly rate £35.96 £36.00 £25.00
% change year-on-year -0.11% +44.00% +2.04%

Creative Thinking
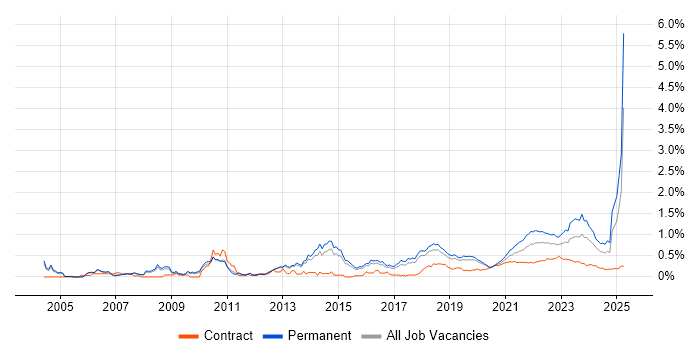
Trend for Jobs with a WFH Option

Job vacancies with a work from home option citing Creative Thinking as a proportion of all IT jobs advertised.

Creative Thinking trend for jobs with a WFH option

Creative Thinking
Daily Rate Trend for Jobs with a WFH Option

3-month moving average daily rate quoted in job vacancies with a work from home option citing Creative Thinking.

Creative Thinking daily rate for jobs with a WFH option

Creative Thinking
Daily Rate Histogram for Jobs with a WFH Option

Daily rate distribution for jobs with a work from home option citing Creative Thinking over the 6 months to 6 May 2024.

Creative Thinking daily rate histogram for jobs with a WFH option

Creative Thinking
Hourly Rate Trend for Jobs with a WFH Option

3-month moving average hourly rate quoted in job vacancies with a work from home option citing Creative Thinking.

Creative Thinking hourly rate for jobs with a WFH option

Creative Thinking
Hourly Rate Histogram for Jobs with a WFH Option

Hourly rate distribution for jobs with a work from home option citing Creative Thinking over the 6 months to 6 May 2024.

Creative Thinking hourly rate histogram for jobs with a WFH option

Creative Thinking
Co-occurring Skills and Capabilities with WFH Options by Category

The follow tables expand on the table above by listing co-occurrences grouped by category. The same employment type, locality and period is covered with up to 20 co-occurrences shown in each of the following categories:

Application Platforms
1 1 (2.33%) SharePoint
Applications
1 4 (9.30%) Microsoft Excel
2 3 (6.98%) Microsoft Office
3 2 (4.65%) Microsoft PowerPoint
3 2 (4.65%) Microsoft Project
4 1 (2.33%) Adobe Creative Suite
4 1 (2.33%) AutoCAD
4 1 (2.33%) Autodesk Inventor
4 1 (2.33%) MS Visio
4 1 (2.33%) Sketch
Cloud Services
1 6 (13.95%) AWS
1 6 (13.95%) Azure
2 5 (11.63%) Azure DevOps
3 3 (6.98%) Serverless
4 2 (4.65%) Azure API Management
4 2 (4.65%) Azure Data Factory
4 2 (4.65%) Azure Functions
4 2 (4.65%) Azure Logic Apps
4 2 (4.65%) Azure Service Bus
4 2 (4.65%) Dynamics 365
4 2 (4.65%) Figma
4 2 (4.65%) PaaS
4 2 (4.65%) Power Platform
5 1 (2.33%) GCP
5 1 (2.33%) Microsoft 365
5 1 (2.33%) SaaS
Communications & Networking
1 1 (2.33%) DHCP
1 1 (2.33%) DNS
1 1 (2.33%) Firewall
1 1 (2.33%) IP Telephony
1 1 (2.33%) Network Security
1 1 (2.33%) Wireless
Database & Business Intelligence
1 2 (4.65%) Azure SQL Database
1 2 (4.65%) Relational Database
1 2 (4.65%) SQL Server
2 1 (2.33%) DB2
2 1 (2.33%) MySQL
2 1 (2.33%) Oracle Reports
2 1 (2.33%) PostgreSQL
2 1 (2.33%) Power BI
2 1 (2.33%) Tableau
Development Applications
1 4 (9.30%) JIRA
2 3 (6.98%) Git
2 3 (6.98%) Jenkins
2 3 (6.98%) JUnit
2 3 (6.98%) Selenium
3 2 (4.65%) Postman
4 1 (2.33%) Axure RP
4 1 (2.33%) Cypress.io
4 1 (2.33%) Gerrit
4 1 (2.33%) Serenity BDD
4 1 (2.33%) TestNG
4 1 (2.33%) Visual Studio
4 1 (2.33%) WebDriver
General
1 25 (58.14%) Social Skills
2 13 (30.23%) Analytical Skills
3 8 (18.60%) Finance
4 5 (11.63%) Legal
5 3 (6.98%) Law
5 3 (6.98%) Presentation Skills
6 2 (4.65%) Banking
6 2 (4.65%) Local Government
6 2 (4.65%) Public Sector
6 2 (4.65%) Retail
7 1 (2.33%) Documentation Skills
7 1 (2.33%) Games
7 1 (2.33%) Inclusion and Diversity
7 1 (2.33%) Influencing Skills
7 1 (2.33%) Investment Banking
7 1 (2.33%) Manufacturing
7 1 (2.33%) Organisational Skills
7 1 (2.33%) Telecoms
Job Titles
1 7 (16.28%) Analyst
2 5 (11.63%) Designer
2 5 (11.63%) Senior
2 5 (11.63%) Test Engineer
3 4 (9.30%) Developer
3 4 (9.30%) Senior Test Engineer
4 3 (6.98%) Lead
4 3 (6.98%) Project Manager
4 3 (6.98%) Service Designer
5 2 (4.65%) Agile Delivery Manager
5 2 (4.65%) Azure Developer
5 2 (4.65%) Business Analyst
5 2 (4.65%) C# Developer
5 2 (4.65%) Data Analyst
5 2 (4.65%) Delivery Manager
5 2 (4.65%) SEO Engineer
5 2 (4.65%) SQL Developer
6 1 (2.33%) AutoCAD Designer
6 1 (2.33%) ITIL Change Analyst
6 1 (2.33%) Principal Security Architect
Libraries, Frameworks & Software Standards
1 3 (6.98%) Swagger
2 2 (4.65%) OpenAPI
3 1 (2.33%) .NET
3 1 (2.33%) AngularJS
3 1 (2.33%) Hibernate
3 1 (2.33%) HTML
3 1 (2.33%) HTML5
3 1 (2.33%) JSON
3 1 (2.33%) NestJS
3 1 (2.33%) Next.js
3 1 (2.33%) Oracle Fusion
3 1 (2.33%) Prisma
3 1 (2.33%) React
3 1 (2.33%) REST
3 1 (2.33%) Shiny
3 1 (2.33%) Spring
3 1 (2.33%) YAML
Miscellaneous
1 7 (16.28%) Self-Motivation
2 6 (13.95%) Product Ownership
3 3 (6.98%) Algorithms
4 2 (4.65%) Virtual Team
5 1 (2.33%) Analytical Mindset
5 1 (2.33%) Data Protection Act
5 1 (2.33%) Digital Media
5 1 (2.33%) Graphic Design
5 1 (2.33%) Management Information System
5 1 (2.33%) Team-Oriented Environment
Operating Systems
1 1 (2.33%) Linux
1 1 (2.33%) Unix
1 1 (2.33%) Windows
1 1 (2.33%) Windows Server
Processes & Methodologies
1 17 (39.53%) Agile
1 17 (39.53%) Problem-Solving
2 14 (32.56%) Stakeholder Management
3 8 (18.60%) Scrum
4 7 (16.28%) Decision-Making
4 7 (16.28%) DevOps
5 6 (13.95%) Continuous Improvement
5 6 (13.95%) Customer Experience
5 6 (13.95%) Kanban
5 6 (13.95%) Scenario Testing
5 6 (13.95%) Test Automation
6 5 (11.63%) Business Analysis
6 5 (11.63%) Change Management
6 5 (11.63%) CI/CD
6 5 (11.63%) Coaching
6 5 (11.63%) Data Protection
6 5 (11.63%) Functional Testing
6 5 (11.63%) Non-Functional Testing
6 5 (11.63%) Project Delivery
6 5 (11.63%) Test Management
Programming Languages
1 6 (13.95%) SQL
2 5 (11.63%) Python
3 4 (9.30%) JavaScript
4 3 (6.98%) C#
4 3 (6.98%) Java
5 2 (4.65%) TypeScript
6 1 (2.33%) Bicep
6 1 (2.33%) PowerShell
6 1 (2.33%) R
Qualifications
1 9 (20.93%) Security Cleared
2 7 (16.28%) SC Cleared
3 3 (6.98%) Degree
4 2 (4.65%) ISTQB
5 1 (2.33%) CBAP
5 1 (2.33%) DV Cleared
5 1 (2.33%) IIBA
5 1 (2.33%) PRINCE2 Practitioner
5 1 (2.33%) SANS
Quality Assurance & Compliance
1 6 (13.95%) QA
2 3 (6.98%) GDPR
3 2 (4.65%) Accessibility
4 1 (2.33%) Actionable Recommendations
4 1 (2.33%) Data Quality
4 1 (2.33%) PMO
System Software
1 1 (2.33%) Docker
Systems Management
1 1 (2.33%) FortiGate
1 1 (2.33%) Progress Chef
1 1 (2.33%) Puppet
1 1 (2.33%) Terraform
Vendors
1 9 (20.93%) Microsoft
2 2 (4.65%) Oracle
3 1 (2.33%) Adobe
3 1 (2.33%) Citrix
3 1 (2.33%) HP
3 1 (2.33%) SAP
3 1 (2.33%) ServiceNow
3 1 (2.33%) Workday