QA Contracts with Hybrid/Remote/WFH Options

Quality Assurance (QA)
UK > Work from Home

The table below provides summary statistics for remote or hybrid contract work requiring QA skills. It includes a benchmarking guide to the contractor rates offered in vacancies that cited QA over the 6 months leading up to 1 May 2025, comparing them to the same period in the previous two years.

6 months to
1 May 2025
Same period 2024 Same period 2023
Rank 70 58 79
Rank change year-on-year -12 +21 -8
Contract jobs citing QA 332 517 719
As % of all contract jobs with a WFH option 3.35% 3.37% 2.78%
As % of the Quality Assurance & Compliance category 22.31% 23.08% 22.90%
Number of daily rates quoted 242 328 544
10th Percentile £313 £324 £302
25th Percentile £400 £413 £400
Median daily rate (50th Percentile) £495 £500 £498
Median % change year-on-year -1.00% +0.50% -0.50%
75th Percentile £575 £594 £600
90th Percentile £675 £718 £696
UK median daily rate £475 £509 £500
% change year-on-year -6.59% +1.70% -1.96%
Number of hourly rates quoted 11 24 4
10th Percentile £18.50 £13.48 -
25th Percentile £19.90 £14.00 £12.50
Median hourly rate £35.00 £19.75 £16.00
Median % change year-on-year +77.22% +23.44% -67.18%
75th Percentile £64.25 £26.79 £20.23
90th Percentile £75.00 £68.00 £21.54
UK median hourly rate £42.50 £15.57 £22.49
% change year-on-year +173.05% -30.78% -52.41%

All Quality Assurance and Compliance Skills
Work from Home

QA falls under the Quality Assurance and Compliance category. For comparison with the information above, the following table provides summary statistics for all contract job vacancies with remote or hybrid options requiring quality assurance or compliance skills.

Contract vacancies with a requirement for quality assurance or compliance skills 1,488 2,240 3,140
As % of all contract jobs with a WFH option 15.02% 14.60% 12.14%
Number of daily rates quoted 1,005 1,532 2,292
10th Percentile £281 £313 £325
25th Percentile £400 £420 £415
Median daily rate (50th Percentile) £500 £510 £515
Median % change year-on-year -1.96% -0.97% +3.00%
75th Percentile £603 £623 £625
90th Percentile £713 £750 £725
UK median daily rate £500 £510 £525
% change year-on-year -1.96% -2.86% +2.44%
Number of hourly rates quoted 47 79 63
10th Percentile £17.98 £12.75 £18.54
25th Percentile £23.13 £14.00 £25.50
Median hourly rate £39.00 £22.87 £43.00
Median % change year-on-year +70.53% -46.81% -2.16%
75th Percentile £67.50 £44.38 £61.88
90th Percentile £87.15 £65.00 £72.35
UK median hourly rate £34.50 £20.80 £37.50
% change year-on-year +65.85% -44.53% +33.93%

QA
Trend for Jobs with a WFH Option

Job vacancies with remote working options citing QA as a proportion of all IT jobs advertised.
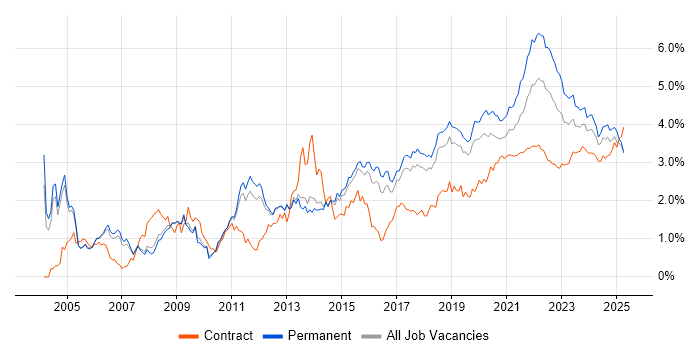
QA trend for jobs with Hybrid/Remote/WFH options

QA
Daily Rate Trend for Jobs with a WFH Option

3-month moving average daily rate quoted in job vacancies with remote working options citing QA.

QA daily rate for jobs with a WFH option

QA
Daily Rate Histogram for Jobs with a WFH Option

Daily rate distribution for jobs with remote working options citing QA over the 6 months to 1 May 2025.

QA daily rate histogram for jobs with a WFH option

QA
Hourly Rate Trend for Jobs with a WFH Option

3-month moving average hourly rate quoted in job vacancies with remote working options citing QA.

QA hourly rate for jobs with a WFH option

QA
Hourly Rate Histogram for Jobs with a WFH Option

Hourly rate distribution for jobs with remote working options citing QA over the 6 months to 1 May 2025.

QA hourly rate histogram for jobs with a WFH option

QA
Co-occurring Skills and Capabilities with WFH Options by Category

The follow tables expand on the table above by listing co-occurrences grouped by category. The same employment type, locality and period is covered with up to 20 co-occurrences shown in each of the following categories:

Application Platforms
1 23 (6.93%) Confluence
2 6 (1.81%) SharePoint
3 2 (0.60%) Apache Airflow
3 2 (0.60%) ArcGIS
3 2 (0.60%) CMS
3 2 (0.60%) MQSeries
3 2 (0.60%) Oracle Workflow
3 2 (0.60%) SAS
3 2 (0.60%) Tomcat
4 1 (0.30%) Apache
4 1 (0.30%) CICS
4 1 (0.30%) Magnolia
4 1 (0.30%) Microsoft Exchange
4 1 (0.30%) nginx
4 1 (0.30%) WebLogic
4 1 (0.30%) WebSphere
Applications
1 11 (3.31%) Microsoft Excel
2 7 (2.11%) MS Visio
3 2 (0.60%) Microsoft Office
3 2 (0.60%) Sketch
4 1 (0.30%) Adobe Illustrator
4 1 (0.30%) EViews
4 1 (0.30%) MadCap Flare
4 1 (0.30%) Microsoft PowerPoint
4 1 (0.30%) Notepad++
4 1 (0.30%) Photoshop
4 1 (0.30%) Trello
Business Applications
1 15 (4.52%) SAP S/4HANA
2 6 (1.81%) SAP PP
3 5 (1.51%) Dynamics CRM
4 2 (0.60%) Misys Midas
4 2 (0.60%) NetSuite
4 2 (0.60%) Payment Gateway
4 2 (0.60%) SAP Hybris
4 2 (0.60%) SAP IBP
4 2 (0.60%) SAP MM
4 2 (0.60%) SAP SCM
5 1 (0.30%) MultiFonds
5 1 (0.30%) SAP CAR
5 1 (0.30%) SAP CRM
5 1 (0.30%) SAP MDG
5 1 (0.30%) SAP Retail
5 1 (0.30%) SAP SD
5 1 (0.30%) Workday HCM
Cloud Services
1 66 (19.88%) AWS
2 63 (18.98%) Azure
3 26 (7.83%) GCP
4 19 (5.72%) Azure DevOps
5 18 (5.42%) GitHub
6 17 (5.12%) Power Platform
7 16 (4.82%) Serverless
8 15 (4.52%) Dynamics 365
9 10 (3.01%) AWS Lambda
10 7 (2.11%) GitHub Actions
11 6 (1.81%) SaaS
12 5 (1.51%) Amazon CloudWatch
12 5 (1.51%) BrowserStack
12 5 (1.51%) PowerApps
12 5 (1.51%) Sauce Labs
13 3 (0.90%) Amazon SQS
13 3 (0.90%) Azure Functions
13 3 (0.90%) Azure Machine Learning
13 3 (0.90%) Figma
13 3 (0.90%) Power Automate
Communications & Networking
1 5 (1.51%) DNS
1 5 (1.51%) TCP/IP
2 4 (1.20%) DHCP
2 4 (1.20%) Network Security
2 4 (1.20%) WAN
3 3 (0.90%) DOCSIS
3 3 (0.90%) Firewall
3 3 (0.90%) LAN
3 3 (0.90%) VPN
3 3 (0.90%) Wi-Fi
4 2 (0.60%) BGP
4 2 (0.60%) EIGRP
4 2 (0.60%) IPsec
4 2 (0.60%) OSPF
4 2 (0.60%) Radio Access Network
4 2 (0.60%) VLAN
4 2 (0.60%) Wireless
5 1 (0.30%) HSRP
5 1 (0.30%) MQTT
5 1 (0.30%) Unified Communications
Database & Business Intelligence
1 15 (4.52%) SQL Server
2 14 (4.22%) PostgreSQL
3 12 (3.61%) Power BI
4 7 (2.11%) Data Warehouse
5 6 (1.81%) MySQL
6 5 (1.51%) MongoDB
6 5 (1.51%) MS Access
6 5 (1.51%) NoSQL
7 4 (1.20%) Metadata
7 4 (1.20%) Relational Database
8 3 (0.90%) Looker
8 3 (0.90%) Tableau
9 2 (0.60%) Amazon RDS
9 2 (0.60%) Amazon Redshift
9 2 (0.60%) DynamoDB
9 2 (0.60%) Geospatial Data
9 2 (0.60%) InfluxDB
9 2 (0.60%) Power Query
9 2 (0.60%) Qlik Sense
9 2 (0.60%) Redis
Development Applications
1 52 (15.66%) JIRA
2 30 (9.04%) Git
3 26 (7.83%) Jenkins
4 24 (7.23%) GitLab
4 24 (7.23%) Selenium
5 19 (5.72%) Postman
6 14 (4.22%) Cypress.io
6 14 (4.22%) REST Assured
7 13 (3.92%) Cucumber
7 13 (3.92%) JMeter
8 8 (2.41%) Gatling
8 8 (2.41%) QARun
8 8 (2.41%) WinRunner
9 7 (2.11%) Appium
9 7 (2.11%) JUnit
9 7 (2.11%) SpecFlow
10 5 (1.51%) Maven
10 5 (1.51%) NeoLoad
10 5 (1.51%) NUnit
11 4 (1.20%) CircleCI
General
1 133 (40.06%) Social Skills
2 69 (20.78%) Analytical Skills
3 57 (17.17%) Finance
4 41 (12.35%) Public Sector
5 26 (7.83%) Banking
6 15 (4.52%) Manufacturing
7 11 (3.31%) Telecoms
8 9 (2.71%) Inclusion and Diversity
9 8 (2.41%) Retail
10 6 (1.81%) Legal
10 6 (1.81%) Organisational Skills
11 5 (1.51%) Back Office
11 5 (1.51%) Front Office
11 5 (1.51%) Investment Banking
11 5 (1.51%) Marketing
12 4 (1.20%) Aerospace
12 4 (1.20%) Automotive
12 4 (1.20%) Games
12 4 (1.20%) Pharmaceutical
12 4 (1.20%) Presentation Skills
Job Titles
1 52 (15.66%) Analyst
2 43 (12.95%) Developer
3 38 (11.45%) Lead
4 27 (8.13%) Architect
5 26 (7.83%) Senior
5 26 (7.83%) Tester
6 23 (6.93%) QA Engineer
7 21 (6.33%) Business Analyst
8 19 (5.72%) Consultant
9 18 (5.42%) Data Analyst
10 16 (4.82%) Test Manager
11 14 (4.22%) Solutions Architect
12 12 (3.61%) Test Analyst
12 12 (3.61%) Test Engineer
12 12 (3.61%) Test Leader
13 11 (3.31%) QA Leader
13 11 (3.31%) QA Tester
14 10 (3.01%) Automation Tester
14 10 (3.01%) Java Developer
15 9 (2.71%) Senior Developer
Libraries, Frameworks & Software Standards
1 22 (6.63%) Playwright
2 17 (5.12%) RESTful
3 13 (3.92%) .NET
3 13 (3.92%) Middleware
4 12 (3.61%) CSS
4 12 (3.61%) Node.js
4 12 (3.61%) React
5 11 (3.31%) HTML
5 11 (3.31%) Web Services
6 9 (2.71%) JSON
6 9 (2.71%) REST
7 7 (2.11%) XML
8 6 (1.81%) AngularJS
8 6 (1.81%) OAuth
8 6 (1.81%) Spring
8 6 (1.81%) Spring Boot
9 5 (1.51%) .NET Core
9 5 (1.51%) ASP.NET
9 5 (1.51%) OpenID
9 5 (1.51%) pytest
Miscellaneous
1 22 (6.63%) Product Ownership
2 13 (3.92%) Legacy Systems
2 13 (3.92%) Management Information System
3 11 (3.31%) Virtual Team
4 7 (2.11%) Life Science
4 7 (2.11%) Onboarding
5 6 (1.81%) Cloud Native
5 6 (1.81%) Data Centre
5 6 (1.81%) Enterprise Software
5 6 (1.81%) Mobile App
6 5 (1.51%) Derivative
6 5 (1.51%) IoT
7 4 (1.20%) Algorithms
7 4 (1.20%) Data Protection Act
7 4 (1.20%) Data Structures
7 4 (1.20%) Embedded Systems
8 3 (0.90%) Equities
8 3 (0.90%) Online Games
8 3 (0.90%) Public Cloud
8 3 (0.90%) State Machine
Operating Systems
1 20 (6.02%) Windows
2 10 (3.01%) Linux
3 7 (2.11%) Unix
4 6 (1.81%) Apple iOS
5 3 (0.90%) Android
5 3 (0.90%) Windows Server
6 2 (0.60%) Windows 7
7 1 (0.30%) Red Hat Enterprise Linux
7 1 (0.30%) Windows 10
7 1 (0.30%) Windows Server 2012
7 1 (0.30%) zOS
Processes & Methodologies
1 139 (41.87%) Agile
2 92 (27.71%) Test Automation
3 91 (27.41%) Problem-Solving
4 71 (21.39%) DevOps
5 66 (19.88%) CI/CD
6 53 (15.96%) Stakeholder Management
7 47 (14.16%) Migration
8 45 (13.55%) Scrum
8 45 (13.55%) User Acceptance Testing
9 40 (12.05%) Test Strategy
10 36 (10.84%) Validation
11 34 (10.24%) Software Testing
12 29 (8.73%) Continuous Improvement
12 29 (8.73%) Software Engineering
13 28 (8.43%) Project Management
14 27 (8.13%) Waterfall
15 26 (7.83%) Test Scripting
16 25 (7.53%) Performance Testing
17 24 (7.23%) Microservices
17 24 (7.23%) Stakeholder Engagement
Programming Languages
1 64 (19.28%) Python
2 55 (16.57%) SQL
3 47 (14.16%) Java
4 31 (9.34%) JavaScript
5 24 (7.23%) C#
6 21 (6.33%) TypeScript
7 11 (3.31%) PowerShell
8 8 (2.41%) C++
8 8 (2.41%) Ruby
9 6 (1.81%) Bash
9 6 (1.81%) Scala
9 6 (1.81%) Shell Script
10 5 (1.51%) Kotlin
10 5 (1.51%) PHP
10 5 (1.51%) Swift
10 5 (1.51%) VBA
11 4 (1.20%) VB
12 3 (0.90%) Go
12 3 (0.90%) R
13 2 (0.60%) VBScript
Qualifications
1 70 (21.08%) Security Cleared
2 62 (18.67%) SC Cleared
3 35 (10.54%) Degree
4 16 (4.82%) Computer Science Degree
5 12 (3.61%) AWS Certification
6 11 (3.31%) BPSS Clearance
6 11 (3.31%) Microsoft Certification
7 9 (2.71%) Azure Certification
7 9 (2.71%) ISTQB
8 7 (2.11%) AWS Certified Solutions Architect
8 7 (2.11%) Master's Degree
9 3 (0.90%) ISEB
9 3 (0.90%) ISTQB Foundation Certification
9 3 (0.90%) PMI Certification
9 3 (0.90%) PMP
10 2 (0.60%) APMG
10 2 (0.60%) CSPO
10 2 (0.60%) DV Cleared
10 2 (0.60%) TOGAF Certification
11 1 (0.30%) ISTQB Advanced Certification
Quality Assurance & Compliance
1 15 (4.52%) Accessibility
2 13 (3.92%) Data Quality
3 7 (2.11%) PMO
4 5 (1.51%) Software Quality Assurance
5 3 (0.90%) GDPR
5 3 (0.90%) GxP
6 2 (0.60%) HIPAA
6 2 (0.60%) ISO/IEC 27001
6 2 (0.60%) PCI DSS
6 2 (0.60%) SLA
7 1 (0.30%) 21 CFR Part 11
7 1 (0.30%) Disclosure Scotland
7 1 (0.30%) IFRS
7 1 (0.30%) IFRS 9
7 1 (0.30%) ISO 9001
7 1 (0.30%) ISO/IEC 20000
7 1 (0.30%) MiFID
7 1 (0.30%) NIST
7 1 (0.30%) SOC 2
7 1 (0.30%) WCAG
System Software
1 32 (9.64%) Docker
2 3 (0.90%) Active Directory
2 3 (0.90%) Microsoft App-V
3 1 (0.30%) Firmware
3 1 (0.30%) VMware Infrastructure
Systems Management
1 21 (6.33%) Kubernetes
2 18 (5.42%) Terraform
3 11 (3.31%) Ansible
4 5 (1.51%) Grafana
5 4 (1.20%) Microsoft Intune
5 4 (1.20%) SCCM
6 3 (0.90%) Progress Chef
7 2 (0.60%) Control-M
7 2 (0.60%) Kibana
7 2 (0.60%) Packer
7 2 (0.60%) Prometheus
8 1 (0.30%) HP ALM
8 1 (0.30%) Nagios
8 1 (0.30%) Puppet
8 1 (0.30%) Rancher
8 1 (0.30%) Red Hat Satellite
8 1 (0.30%) Single Sign-On
8 1 (0.30%) TrustSec
Vendors
1 45 (13.55%) Microsoft
2 22 (6.63%) SAP
3 16 (4.82%) Google
4 11 (3.31%) Oracle
5 7 (2.11%) Databricks
5 7 (2.11%) Salesforce
6 5 (1.51%) ServiceNow
6 5 (1.51%) Splunk
7 4 (1.20%) Citrix
7 4 (1.20%) Planview
7 4 (1.20%) Workday
8 3 (0.90%) Adobe
8 3 (0.90%) Ariba
8 3 (0.90%) Cisco
8 3 (0.90%) ION Trading
8 3 (0.90%) Palantir
8 3 (0.90%) Solace
9 2 (0.60%) CheckPoint
9 2 (0.60%) CyberArk
9 2 (0.60%) New Relic