Creative Thinking Jobs with Work from Home Options

Creative Thinking
UK > Work from Home

The table below provides summary statistics for permanent job vacancies with an option to work from home (WFH) and a requirement for Creative Thinking skills. Included is a benchmarking guide to the salaries offered in vacancies that have cited Creative Thinking over the 6 months to 7 May 2024 with a comparison to the same period in the previous 2 years.

6 months to
7 May 2024
Same period 2023 Same period 2022
Rank 287 301 309
Rank change year-on-year +14 +8 +89
Permanent jobs citing Creative Thinking 370 442 821
As % of all permanent jobs with a WFH option 1.10% 1.06% 1.20%
As % of the Processes & Methodologies category 1.20% 1.11% 1.23%
Number of salaries quoted 205 244 389
10th Percentile £30,850 £41,117 £41,250
25th Percentile £45,000 £55,414 £52,500
Median annual salary (50th Percentile) £55,000 £67,206 £66,837
Median % change year-on-year -18.16% +0.55% +11.39%
75th Percentile £74,500 £87,500 £95,000
90th Percentile £87,500 £93,000 £100,000
UK median annual salary £50,000 £65,000 £62,500
% change year-on-year -23.08% +4.00% +8.70%

All Process and Methodology Skills
Work from Home

Creative Thinking is in the Processes and Methodologies category. The following table is for comparison with the above and provides summary statistics for all permanent job vacancies with a WFH option and a requirement for process or methodology skills.

Permanent vacancies with a requirement for process or methodology skills 30,775 39,955 66,612
As % of all permanent jobs with a WFH option 91.47% 96.10% 96.96%
Number of salaries quoted 23,345 27,739 41,261
10th Percentile £33,750 £37,500 £36,250
25th Percentile £42,500 £47,500 £45,750
Median annual salary (50th Percentile) £57,500 £62,500 £60,000
Median % change year-on-year -8.00% +4.17% +9.09%
75th Percentile £75,000 £82,500 £80,000
90th Percentile £95,000 £100,000 £95,000
UK median annual salary £55,000 £61,180 £60,000
% change year-on-year -10.10% +1.97% +9.09%

Creative Thinking
Trend for Jobs with a WFH Option

Job vacancies with a work from home option citing Creative Thinking as a proportion of all IT jobs advertised.
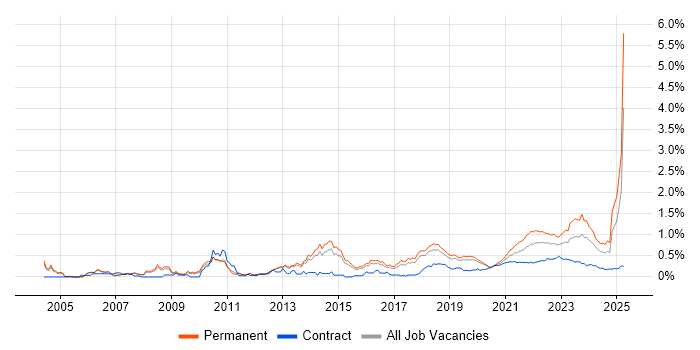
Creative Thinking trend for jobs with a WFH option

Creative Thinking
Salary Trend for Jobs with a WFH Option

3-month moving average salary quoted in job vacancies with a work from home option citing Creative Thinking.

Creative Thinking salary trend for jobs with a WFH option

Creative Thinking
Salary Histogram for Jobs with a WFH Option

Salary distribution for jobs with a work from home option citing Creative Thinking over the 6 months to 7 May 2024.

Creative Thinking salary histogram for jobs with a WFH option

Creative Thinking
Co-occurring Skills and Capabilities with WFH Options by Category

The follow tables expand on the table above by listing co-occurrences grouped by category. The same employment type, locality and period is covered with up to 20 co-occurrences shown in each of the following categories:

Application Platforms
1 38 (10.27%) Microsoft Exchange
2 11 (2.97%) CMS
2 11 (2.97%) IIS
3 3 (0.81%) SharePoint
4 2 (0.54%) WordPress
5 1 (0.27%) Apache Spark
5 1 (0.27%) ArcGIS
Applications
1 15 (4.05%) Microsoft Office
2 14 (3.78%) Adobe XD
3 9 (2.43%) Microsoft Excel
4 8 (2.16%) Photoshop
5 6 (1.62%) Microsoft PowerPoint
6 4 (1.08%) Maya
7 3 (0.81%) Adobe Illustrator
7 3 (0.81%) InDesign
7 3 (0.81%) UserZoom
8 2 (0.54%) MS Visio
9 1 (0.27%) Acrobat
9 1 (0.27%) Adobe Captivate
9 1 (0.27%) Adobe Premiere
Business Applications
1 36 (9.73%) Endur
2 13 (3.51%) Unit4 Business World
3 11 (2.97%) Dynamics CRM
4 3 (0.81%) OpenLink RightAngle
Cloud Services
1 44 (11.89%) AWS
2 26 (7.03%) Azure
3 16 (4.32%) Cloud Computing
3 16 (4.32%) Power Platform
4 13 (3.51%) GCP
5 7 (1.89%) Canva
6 6 (1.62%) Microsoft 365
7 5 (1.35%) Dynamics 365
7 5 (1.35%) Serverless
8 4 (1.08%) AWS CloudFormation
8 4 (1.08%) AWS Fargate
8 4 (1.08%) Azure DevOps
8 4 (1.08%) Power Automate
9 3 (0.81%) Azure Pipelines
9 3 (0.81%) Figma
9 3 (0.81%) Google Analytics
9 3 (0.81%) IaaS
9 3 (0.81%) MailChimp
9 3 (0.81%) PaaS
9 3 (0.81%) SaaS
Communications & Networking
1 13 (3.51%) TCP/IP
1 13 (3.51%) Wireless
2 11 (2.97%) WAN
3 9 (2.43%) Broadband
4 8 (2.16%) Firewall
4 8 (2.16%) NGN
4 8 (2.16%) TACACS
5 7 (1.89%) HTTP
5 7 (1.89%) MQTT
6 5 (1.35%) DHCP
6 5 (1.35%) DNS
6 5 (1.35%) VoIP
6 5 (1.35%) Wi-Fi
7 3 (0.81%) 5G
7 3 (0.81%) Internet
7 3 (0.81%) Intrusion Detection
7 3 (0.81%) SD-WAN
8 1 (0.27%) Intranet
Database & Business Intelligence
1 42 (11.35%) SQL Server
2 40 (10.81%) Relational Database
3 36 (9.73%) RDBMS
4 13 (3.51%) DB2
5 10 (2.70%) Metadata
6 9 (2.43%) Power BI
7 6 (1.62%) Tableau
8 5 (1.35%) Looker
9 3 (0.81%) Metadata Repository
9 3 (0.81%) SQL Server Integration Services
9 3 (0.81%) SQL Server Reporting Services
10 2 (0.54%) Data Lake
10 2 (0.54%) Data Warehouse
10 2 (0.54%) QlikView
11 1 (0.27%) Azure SQL Database
11 1 (0.27%) BigQuery
11 1 (0.27%) GIS
11 1 (0.27%) MySQL
11 1 (0.27%) NoSQL
11 1 (0.27%) Spatial Data
Development Applications
1 21 (5.68%) Git
2 13 (3.51%) Axure RP
2 13 (3.51%) Balsamiq
3 5 (1.35%) GitLab
3 5 (1.35%) LabVIEW
3 5 (1.35%) Visual Studio
4 1 (0.27%) Mockito
General
1 161 (43.51%) Social Skills
2 112 (30.27%) Marketing
3 100 (27.03%) Finance
3 100 (27.03%) Inclusion and Diversity
4 83 (22.43%) Public Sector
5 54 (14.59%) Analytical Skills
6 49 (13.24%) Games
7 29 (7.84%) Presentation Skills
8 27 (7.30%) Retail
9 25 (6.76%) Legal
10 18 (4.86%) Aerospace
10 18 (4.86%) Law
10 18 (4.86%) Telecoms
11 17 (4.59%) Influencing Skills
12 13 (3.51%) Organisational Skills
12 13 (3.51%) Pharmaceutical
13 10 (2.70%) Advertising
13 10 (2.70%) Aviation
13 10 (2.70%) Military
14 8 (2.16%) Manufacturing
Job Titles
1 82 (22.16%) Senior
2 41 (11.08%) Consultant
3 39 (10.54%) Lead
4 38 (10.27%) Architect
5 35 (9.46%) Analyst
6 27 (7.30%) Developer
6 27 (7.30%) Project Manager
7 24 (6.49%) Senior Manager
8 23 (6.22%) Development Manager
9 18 (4.86%) Business Analyst
10 16 (4.32%) Endur Manager
10 16 (4.32%) OpenLink Manager
10 16 (4.32%) Senior Architect
10 16 (4.32%) Senior Development Manager
10 16 (4.32%) Software Development Manager
10 16 (4.32%) Software Manager
11 15 (4.05%) IT Manager
12 14 (3.78%) Security Consultant
12 14 (3.78%) Senior Consultant
12 14 (3.78%) Software Architect
Libraries, Frameworks & Software Standards
1 36 (9.73%) HTML
2 28 (7.57%) CSS
3 18 (4.86%) .NET
4 11 (2.97%) ASP.NET
4 11 (2.97%) React
5 10 (2.70%) Entity Framework
5 10 (2.70%) Node.js
5 10 (2.70%) Spring
6 9 (2.43%) .NET Core
6 9 (2.43%) ASP.NET Core
6 9 (2.43%) Hibernate
6 9 (2.43%) Spring MVC
7 7 (1.89%) Django
7 7 (1.89%) Flask
8 6 (1.62%) Vue
9 4 (1.08%) .NET Framework
9 4 (1.08%) AWS CDK
9 4 (1.08%) AWS SAM
9 4 (1.08%) GraphQL
9 4 (1.08%) HTML5 Canvas
Miscellaneous
1 54 (14.59%) Product Ownership
2 37 (10.00%) Management Information System
3 36 (9.73%) Swaptions
4 21 (5.68%) Social Media
5 16 (4.32%) IoT
6 11 (2.97%) CESG
6 11 (2.97%) Data Centre
6 11 (2.97%) Virtual Team
7 7 (1.89%) Algorithms
7 7 (1.89%) Arduino
7 7 (1.89%) Raspberry Pi
7 7 (1.89%) Self-Motivation
8 6 (1.62%) Blog
8 6 (1.62%) Mobile App
8 6 (1.62%) Operational Technology
9 5 (1.35%) CCTV
9 5 (1.35%) Photography
10 4 (1.08%) Cyber Threat
10 4 (1.08%) Foreign Exchange (FX)
10 4 (1.08%) Greenfield Project
Operating Systems
1 16 (4.32%) Linux
2 14 (3.78%) Windows
3 13 (3.51%) Unix
3 13 (3.51%) Windows Server
4 3 (0.81%) Android
4 3 (0.81%) Apple iOS
Processes & Methodologies
1 135 (36.49%) Agile
2 87 (23.51%) Problem-Solving
3 61 (16.49%) Project Management
4 58 (15.68%) Project Delivery
5 54 (14.59%) SDLC
6 51 (13.78%) Roadmaps
7 50 (13.51%) Data Modelling
7 50 (13.51%) Decision-Making
8 45 (12.16%) Coaching
9 44 (11.89%) Risk Management
10 43 (11.62%) Workshop Facilitation
11 42 (11.35%) Analytics
11 42 (11.35%) Scrum
11 42 (11.35%) Strategic Roadmap
12 40 (10.81%) Business Transformation
12 40 (10.81%) Mentoring
12 40 (10.81%) User Experience
13 35 (9.46%) Cybersecurity
14 34 (9.19%) Computer Science
15 33 (8.92%) Waterfall
Programming Languages
1 57 (15.41%) Java
2 37 (10.00%) SQL
3 36 (9.73%) VB
4 35 (9.46%) Python
5 30 (8.11%) JavaScript
6 15 (4.05%) C#
7 11 (2.97%) C
7 11 (2.97%) TypeScript
8 7 (1.89%) Bash
9 5 (1.35%) R
10 4 (1.08%) C++
10 4 (1.08%) PowerShell
11 3 (0.81%) Kotlin
11 3 (0.81%) Perl
11 3 (0.81%) Swift
12 2 (0.54%) T-SQL
Qualifications
1 101 (27.30%) Degree
2 73 (19.73%) Security Cleared
3 48 (12.97%) SC Cleared
4 33 (8.92%) DV Cleared
5 30 (8.11%) Computer Science Degree
6 24 (6.49%) Microsoft Certification
7 13 (3.51%) CISA
7 13 (3.51%) Master's Degree
8 11 (2.97%) CISMP
8 11 (2.97%) IISP
9 10 (2.70%) ACCA
9 10 (2.70%) CREST Certified
10 7 (1.89%) CIPD
11 3 (0.81%) PRINCE2 Practitioner
12 2 (0.54%) ISTQB
12 2 (0.54%) ITIL Certification
12 2 (0.54%) MOS
13 1 (0.27%) PhD
13 1 (0.27%) PMI Certification
13 1 (0.27%) PMP
Quality Assurance & Compliance
1 24 (6.49%) PMO
1 24 (6.49%) QA
2 14 (3.78%) NIST
3 13 (3.51%) Accessibility
3 13 (3.51%) ITGC
3 13 (3.51%) WCAG
4 11 (2.97%) HMG Security Policy Framework
4 11 (2.97%) JSP 440
4 11 (2.97%) NIST 800
4 11 (2.97%) RMADS
5 9 (2.43%) GDPR
6 7 (1.89%) Data Quality
6 7 (1.89%) Good Clinical Practice
7 3 (0.81%) NCSC
7 3 (0.81%) SLA
8 2 (0.54%) Actionable Recommendations
9 1 (0.27%) COSHH
9 1 (0.27%) ISO/IEC 17025
9 1 (0.27%) ISO/IEC 27001
9 1 (0.27%) PCI DSS
System Software
1 14 (3.78%) Docker
2 7 (1.89%) Firmware
Systems Management
1 20 (5.41%) Kubernetes
2 13 (3.51%) SCOM
3 8 (2.16%) Ansible
4 4 (1.08%) Terraform
5 1 (0.27%) Microsoft Intune
Vendors
1 64 (17.30%) Microsoft
2 51 (13.78%) Oracle
3 36 (9.73%) OpenLink
3 36 (9.73%) Sybase
3 36 (9.73%) TIBCO
4 24 (6.49%) Adobe
5 23 (6.22%) SAP
6 13 (3.51%) Google
6 13 (3.51%) Sage
7 8 (2.16%) Aruba
7 8 (2.16%) VMware
8 7 (1.89%) NVIDIA
8 7 (1.89%) TikTok
9 6 (1.62%) Facebook
10 5 (1.35%) Twitter
11 4 (1.08%) ServiceNow
12 3 (0.81%) Instagram
12 3 (0.81%) Qualtrics
12 3 (0.81%) YouTube
13 1 (0.27%) Hootsuite