Computer Science Degree Contracts with Hybrid/Remote/WFH Options

Computer Science Degree
UK > Work from Home

The table below provides summary statistics for remote or hybrid contract work with a requirement for Computer Science Degree qualifications. It includes a benchmarking guide to the contractor rates offered over the 6 months leading up to 1 May 2025, comparing them to the same period in the previous two years.

6 months to
1 May 2025
Same period 2024 Same period 2023
Rank 137 142 261
Rank change year-on-year +5 +119 +108
Contract jobs citing Computer Science Degree 187 229 227
As % of all contract jobs with a WFH option 1.89% 1.49% 0.88%
As % of the Qualifications category 6.77% 5.40% 3.45%
Number of daily rates quoted 122 154 150
10th Percentile £283 £315 £424
25th Percentile £400 £413 £485
Median daily rate (50th Percentile) £500 £550 £618
Median % change year-on-year -9.09% -10.93% +12.27%
75th Percentile £649 £675 £863
90th Percentile £738 £809 £950
UK median daily rate £500 £550 £575
% change year-on-year -9.09% -4.35% +4.55%
Number of hourly rates quoted 0 3 5
10th Percentile - £56.25 £39.45
25th Percentile - £63.75 £52.50
Median hourly rate - £77.50 £55.00
Median % change year-on-year - +40.91% +13.40%
75th Percentile - £79.38 £70.00
90th Percentile - £79.75 -
UK median hourly rate £57.50 £55.00 £55.00
% change year-on-year +4.55% - +13.40%

All Academic and Professional Certifications
Work from Home

Computer Science Degree falls under the Academic Qualifications and Professional Certifications category. For comparison with the information above, the following table provides summary statistics for all contract job vacancies with remote or hybrid options requiring academic qualifications or professional certifications.

Contract vacancies requiring academic qualifications or professional certifications 2,762 4,242 6,586
As % of all contract jobs with a WFH option 27.88% 27.64% 25.47%
Number of daily rates quoted 1,865 2,651 4,417
10th Percentile £350 £325 £381
25th Percentile £425 £440 £454
Median daily rate (50th Percentile) £525 £525 £550
Median % change year-on-year - -4.55% +2.80%
75th Percentile £613 £638 £650
90th Percentile £700 £730 £745
UK median daily rate £525 £535 £550
% change year-on-year -1.87% -2.73% +4.76%
Number of hourly rates quoted 104 269 292
10th Percentile £19.10 £15.85 £20.00
25th Percentile £26.25 £25.00 £42.50
Median hourly rate £54.51 £43.00 £65.00
Median % change year-on-year +26.76% -33.85% +33.22%
75th Percentile £67.75 £65.00 £73.75
90th Percentile £85.78 £83.84 £85.00
UK median hourly rate £40.00 £40.00 £54.00
% change year-on-year - -25.93% +29.16%

Computer Science Degree
Trend for Jobs with a WFH Option

Job vacancies with remote working options citing Computer Science Degree as a proportion of all IT jobs advertised.
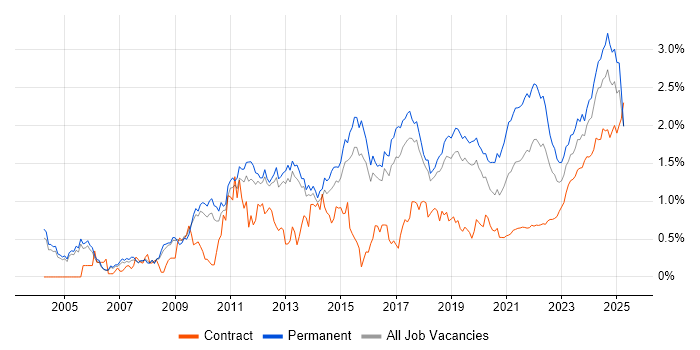
Computer Science Degree trend for jobs with Hybrid/Remote/WFH options

Computer Science Degree
Daily Rate Trend for Jobs with a WFH Option

3-month moving average daily rate quoted in job vacancies with remote working options citing Computer Science Degree.

Computer Science Degree daily rate for jobs with a WFH option

Computer Science Degree
Daily Rate Histogram for Jobs with a WFH Option

Daily rate distribution for jobs with remote working options citing Computer Science Degree over the 6 months to 1 May 2025.

Computer Science Degree daily rate histogram for jobs with a WFH option

Computer Science Degree
Hourly Rate Trend for Jobs with a WFH Option

3-month moving average hourly rate quoted in job vacancies with remote working options citing Computer Science Degree.

Computer Science Degree hourly rate for jobs with a WFH option

Computer Science Degree
Co-occurring Skills and Capabilities with WFH Options by Category

The follow tables expand on the table above by listing co-occurrences grouped by category. The same employment type, locality and period is covered with up to 20 co-occurrences shown in each of the following categories:

Application Platforms
1 5 (2.67%) Confluence
2 4 (2.14%) OpenStack
3 3 (1.60%) Apache Spark
4 2 (1.07%) Apache
4 2 (1.07%) CMS
5 1 (0.53%) BizTalk Server
5 1 (0.53%) ThingWorx
Applications
1 4 (2.14%) Microsoft Office
2 2 (1.07%) Adobe Captivate
2 2 (1.07%) Microsoft Excel
2 2 (1.07%) MS Visio
2 2 (1.07%) Trello
3 1 (0.53%) Microsoft Project
Business Applications
1 8 (4.28%) SAP S/4HANA
2 4 (2.14%) SAP EWM
3 3 (1.60%) Payment Gateway
4 1 (0.53%) Dynamics CRM
4 1 (0.53%) Endur
4 1 (0.53%) Maximo
4 1 (0.53%) SAP HCM
4 1 (0.53%) Siebel CRM
4 1 (0.53%) Unit4 Business World
4 1 (0.53%) Workday HCM
Cloud Services
1 61 (32.62%) AWS
2 49 (26.20%) Azure
3 26 (13.90%) GCP
4 15 (8.02%) Amazon S3
5 14 (7.49%) Serverless
6 12 (6.42%) AWS Lambda
7 8 (4.28%) Azure DevOps
7 8 (4.28%) Power Platform
8 7 (3.74%) GitHub
9 6 (3.21%) Amazon EC2
10 5 (2.67%) Amazon SageMaker
10 5 (2.67%) Cloud Computing
11 4 (2.14%) Entra ID
11 4 (2.14%) SaaS
12 3 (1.60%) Kong
12 3 (1.60%) OpenShift
12 3 (1.60%) PaaS
12 3 (1.60%) Power Automate
12 3 (1.60%) PowerApps
13 2 (1.07%) Azure Logic Apps
Communications & Networking
1 16 (8.56%) Firewall
2 10 (5.35%) Network Security
3 8 (4.28%) VPN
4 6 (3.21%) SSL
5 5 (2.67%) S/MIME
6 3 (1.60%) TCP/IP
6 3 (1.60%) Wireless
7 2 (1.07%) Cisco Nexus
7 2 (1.07%) DNS
7 2 (1.07%) DWDM
7 2 (1.07%) Intrusion Detection
7 2 (1.07%) LAN
7 2 (1.07%) NGFW
7 2 (1.07%) WAN
8 1 (0.53%) Internet
8 1 (0.53%) MQTT
8 1 (0.53%) Wireshark
Database & Business Intelligence
1 8 (4.28%) PostgreSQL
2 7 (3.74%) NoSQL
2 7 (3.74%) Oracle Database
3 6 (3.21%) Data Warehouse
3 6 (3.21%) Power BI
3 6 (3.21%) SQL Server
4 5 (2.67%) DynamoDB
4 5 (2.67%) Metadata
4 5 (2.67%) MySQL
5 4 (2.14%) Amazon Redshift
5 4 (2.14%) Data Lake
5 4 (2.14%) Metadata Repository
5 4 (2.14%) Relational Database
6 3 (1.60%) Amazon RDS
6 3 (1.60%) Apache Cassandra
6 3 (1.60%) Big Data
6 3 (1.60%) Elasticsearch
6 3 (1.60%) Hazelcast
6 3 (1.60%) Kdb+
6 3 (1.60%) Power Query
Development Applications
1 19 (10.16%) Git
2 12 (6.42%) Jenkins
3 9 (4.81%) GitLab
4 8 (4.28%) JIRA
5 4 (2.14%) Maven
5 4 (2.14%) REST Assured
6 3 (1.60%) Artifactory
6 3 (1.60%) Cypress.io
6 3 (1.60%) JMeter
7 2 (1.07%) Sonatype Nexus
8 1 (0.53%) Bitbucket
8 1 (0.53%) Burp Suite
8 1 (0.53%) Gatling
8 1 (0.53%) JProfiler
8 1 (0.53%) Metasploit
8 1 (0.53%) Postman
8 1 (0.53%) Selenium
8 1 (0.53%) Team Foundation Server
8 1 (0.53%) TestNG
8 1 (0.53%) Travis CI
General
1 118 (63.10%) Social Skills
2 77 (41.18%) Analytical Skills
3 29 (15.51%) Finance
4 20 (10.70%) Public Sector
5 9 (4.81%) Automotive
5 9 (4.81%) Banking
6 8 (4.28%) Manufacturing
7 7 (3.74%) Inclusion and Diversity
7 7 (3.74%) Telecoms
8 6 (3.21%) Legal
8 6 (3.21%) Presentation Skills
9 5 (2.67%) Back Office
9 5 (2.67%) Investment Banking
10 3 (1.60%) Front Office
10 3 (1.60%) Marketing
11 2 (1.07%) Documentation Skills
11 2 (1.07%) Organisational Skills
11 2 (1.07%) Retail
12 1 (0.53%) Digital Health
12 1 (0.53%) Multimedia
Job Titles
1 35 (18.72%) Architect
2 28 (14.97%) Developer
3 26 (13.90%) Senior
4 16 (8.56%) Solutions Architect
5 13 (6.95%) Lead
6 11 (5.88%) Software Engineer
7 10 (5.35%) Cloud Engineer
8 9 (4.81%) Consultant
9 8 (4.28%) Analyst
10 7 (3.74%) AWS Engineer
10 7 (3.74%) Cloud Architect
10 7 (3.74%) Java Developer
10 7 (3.74%) Network Engineer
11 6 (3.21%) C++ Software Engineer
11 6 (3.21%) Data Engineer
11 6 (3.21%) DevOps Engineer
11 6 (3.21%) Full-Stack Engineer
11 6 (3.21%) Security Engineer
11 6 (3.21%) Senior Developer
12 5 (2.67%) Infrastructure Architect
Libraries, Frameworks & Software Standards
1 11 (5.88%) Node.js
1 11 (5.88%) React
1 11 (5.88%) Spring
2 9 (4.81%) CSS
3 7 (3.74%) AngularJS
3 7 (3.74%) HTML
3 7 (3.74%) REST
4 6 (3.21%) Kafka
4 6 (3.21%) RESTful
5 4 (2.14%) .NET
5 4 (2.14%) Hibernate
5 4 (2.14%) Jest
5 4 (2.14%) SOAP
6 3 (1.60%) ActiveMQ
6 3 (1.60%) J2EE
6 3 (1.60%) LDAP
6 3 (1.60%) Middleware
6 3 (1.60%) OAuth
6 3 (1.60%) Playwright
6 3 (1.60%) scikit-learn
Miscellaneous
1 23 (12.30%) Management Information System
2 16 (8.56%) Cloud Native
3 13 (6.95%) Algorithms
4 11 (5.88%) Product Ownership
5 10 (5.35%) Enterprise Software
6 9 (4.81%) Data Protection Act
7 8 (4.28%) Industry 4.0
8 7 (3.74%) Analytical Mindset
8 7 (3.74%) Data Structures
8 7 (3.74%) Distributed Systems
8 7 (3.74%) IoT
8 7 (3.74%) Operational Technology
9 6 (3.21%) PKI
10 5 (2.67%) Hedge funds
10 5 (2.67%) Security Posture
11 4 (2.14%) Data Centre
11 4 (2.14%) Virtual Team
12 3 (1.60%) Legacy Systems
12 3 (1.60%) Manufacturing Execution System
12 3 (1.60%) Renewable Energy
Operating Systems
1 19 (10.16%) Linux
2 4 (2.14%) SUSE
3 2 (1.07%) Red Hat Enterprise Linux
4 1 (0.53%) Unix
4 1 (0.53%) Windows
Processes & Methodologies
1 183 (97.86%) Computer Science
2 99 (52.94%) Problem-Solving
3 60 (32.09%) Agile
4 41 (21.93%) CI/CD
5 36 (19.25%) DevOps
6 30 (16.04%) Mentoring
7 27 (14.44%) Migration
7 27 (14.44%) Software Engineering
8 24 (12.83%) Analytics
9 23 (12.30%) Technical Leadership
10 20 (10.70%) Data Modelling
10 20 (10.70%) Roadmaps
11 18 (9.63%) Project Management
12 17 (9.09%) Stakeholder Management
13 16 (8.56%) Cloud Security
13 16 (8.56%) Decision-Making
13 16 (8.56%) Risk Management
14 14 (7.49%) Collaborative Working
14 14 (7.49%) Data Science
14 14 (7.49%) Infrastructure as Code
Programming Languages
1 71 (37.97%) Python
2 33 (17.65%) Java
3 30 (16.04%) SQL
4 21 (11.23%) PowerShell
5 16 (8.56%) JavaScript
6 14 (7.49%) Bash
7 10 (5.35%) C++
8 8 (4.28%) C#
9 6 (3.21%) Perl
9 6 (3.21%) TypeScript
10 3 (1.60%) Data Analysis Expressions
10 3 (1.60%) Ruby
10 3 (1.60%) Scala
11 2 (1.07%) ABAP
11 2 (1.07%) Apex Code
11 2 (1.07%) Groovy
11 2 (1.07%) PHP
11 2 (1.07%) VBA
12 1 (0.53%) Go
12 1 (0.53%) PL/SQL
Qualifications
1 187 (100.00%) Degree
2 33 (17.65%) Master's Degree
3 28 (14.97%) Azure Certification
4 27 (14.44%) AWS Certification
5 22 (11.76%) Microsoft Certification
6 19 (10.16%) AWS Certified Solutions Architect
7 16 (8.56%) CISSP
7 16 (8.56%) Security Cleared
8 12 (6.42%) Cisco Certification
8 12 (6.42%) SC Cleared
9 10 (5.35%) CCNA
10 9 (4.81%) CISM
11 6 (3.21%) CCNP
11 6 (3.21%) PMI Certification
12 5 (2.67%) CEH
12 5 (2.67%) PMP
13 4 (2.14%) CISA
13 4 (2.14%) PhD
14 3 (1.60%) BPSS Clearance
14 3 (1.60%) CITP
Quality Assurance & Compliance
1 16 (8.56%) QA
2 11 (5.88%) ISO/IEC 27001
3 9 (4.81%) GDPR
3 9 (4.81%) NIST
4 7 (3.74%) Data Quality
4 7 (3.74%) PCI DSS
5 5 (2.67%) Accessibility
6 4 (2.14%) Sarbanes-Oxley
7 3 (1.60%) ISO/IEC 27005
8 2 (1.07%) California Consumer Privacy Act
8 2 (1.07%) Disclosure Scotland
8 2 (1.07%) HIPAA
8 2 (1.07%) ISO/IEC 27002 (supersedes ISO/IEC 17799)
8 2 (1.07%) NCSC
9 1 (0.53%) FedRAMP
9 1 (0.53%) NIST 800
9 1 (0.53%) SOC 2
System Software
1 19 (10.16%) Docker
2 7 (3.74%) Active Directory
3 2 (1.07%) Apache ZooKeeper
4 1 (0.53%) Oracle RAC
4 1 (0.53%) Virtual Machines
4 1 (0.53%) VMware Infrastructure
Systems Management
1 24 (12.83%) Kubernetes
2 23 (12.30%) Terraform
3 19 (10.16%) Ansible
4 7 (3.74%) Progress Chef
5 6 (3.21%) Argo
6 4 (2.14%) Grafana
6 4 (2.14%) Prometheus
7 3 (1.60%) Control-M
7 3 (1.60%) Istio
7 3 (1.60%) MOM
7 3 (1.60%) Puppet
7 3 (1.60%) Rundeck
8 2 (1.07%) Consul
8 2 (1.07%) logstash
9 1 (0.53%) Hadoop YARN
9 1 (0.53%) Kibana
9 1 (0.53%) Oracle RMAN
9 1 (0.53%) Single Sign-On
Vendors
1 46 (24.60%) Microsoft
2 27 (14.44%) SAP
3 24 (12.83%) Google
4 15 (8.02%) Oracle
5 7 (3.74%) Databricks
6 6 (3.21%) Cisco
7 5 (2.67%) Cloudera
7 5 (2.67%) ServiceNow
8 4 (2.14%) Splunk
9 3 (1.60%) CyberArk
9 3 (1.60%) Dynatrace
9 3 (1.60%) Red Hat
9 3 (1.60%) Rockwell
9 3 (1.60%) Salesforce
9 3 (1.60%) Siemens
10 2 (1.07%) Adobe
10 2 (1.07%) Arista
11 1 (0.53%) OpenLink
11 1 (0.53%) Remedy
11 1 (0.53%) Siebel