Data Centre Contracts with Hybrid/Remote/WFH Options

Data Center
UK > Work from Home

The table below looks at the prevalence of the term Data Centre in remote or hybrid contract work. Included is a benchmarking guide to the contractor rates offered in vacancies that cited Data Centre over the 6 months leading up to 1 May 2025, comparing them to the same period in the previous two years.

6 months to
1 May 2025
Same period 2024 Same period 2023
Rank 133 139 82
Rank change year-on-year +6 -57 +30
Contract jobs citing Data Centre 192 237 709
As % of all contract jobs with a WFH option 1.94% 1.54% 2.74%
As % of the Miscellaneous category 5.87% 5.38% 8.71%
Number of daily rates quoted 132 153 509
10th Percentile £374 £400 £404
25th Percentile £455 £456 £463
Median daily rate (50th Percentile) £519 £550 £550
Median % change year-on-year -5.68% - +4.76%
75th Percentile £596 £615 £630
90th Percentile £638 £700 £725
UK median daily rate £513 £525 £550
% change year-on-year -2.38% -4.55% +5.77%
Number of hourly rates quoted 1 3 5
10th Percentile - £51.70 -
25th Percentile - £54.25 £20.00
Median hourly rate £65.00 £63.00 £65.00
Median % change year-on-year +3.17% -3.08% +126.09%
75th Percentile - £72.50 £75.00
90th Percentile - £75.50 £84.00
UK median hourly rate £26.08 £24.44 £21.67
% change year-on-year +6.73% +12.76% -22.26%

All Generic Skills
Work from Home

Data Centre falls under the General and Transferable Skills category. For comparison with the information above, the following table provides summary statistics for all contract job vacancies with remote or hybrid options requiring generic IT skills.

Contract vacancies with a requirement for generic IT skills 3,272 4,408 8,138
As % of all contract jobs with a WFH option 33.03% 28.73% 31.47%
Number of daily rates quoted 2,222 2,974 5,725
10th Percentile £350 £325 £363
25th Percentile £425 £431 £454
Median daily rate (50th Percentile) £545 £550 £550
Median % change year-on-year -0.91% - +2.33%
75th Percentile £680 £675 £688
90th Percentile £825 £800 £800
UK median daily rate £525 £538 £550
% change year-on-year -2.33% -2.27% -
Number of hourly rates quoted 76 199 151
10th Percentile £18.75 £15.48 £19.00
25th Percentile £26.25 £25.50 £31.38
Median hourly rate £41.75 £51.00 £57.50
Median % change year-on-year -18.14% -11.30% +29.21%
75th Percentile £64.57 £65.02 £70.00
90th Percentile £78.13 £72.50 £85.00
UK median hourly rate £32.05 £30.00 £22.49
% change year-on-year +6.83% +33.42% -18.24%

Data Centre
Trend for Jobs with a WFH Option

Job vacancies with remote working options citing Data Centre as a proportion of all IT jobs advertised.
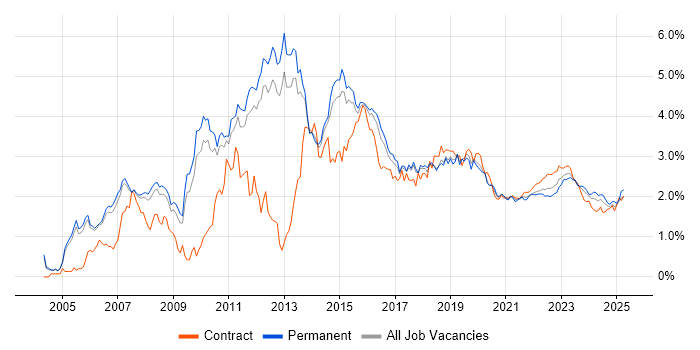
Data Centre trend for jobs with Hybrid/Remote/WFH options

Data Centre
Daily Rate Trend for Jobs with a WFH Option

3-month moving average daily rate quoted in job vacancies with remote working options citing Data Centre.

Data Centre daily rate for jobs with a WFH option

Data Centre
Daily Rate Histogram for Jobs with a WFH Option

Daily rate distribution for jobs with remote working options citing Data Centre over the 6 months to 1 May 2025.

Data Centre daily rate histogram for jobs with a WFH option

Data Centre
Hourly Rate Trend for Jobs with a WFH Option

3-month moving average hourly rate quoted in job vacancies with remote working options citing Data Centre.

Data Centre hourly rate for jobs with a WFH option

Data Centre
Co-occurring Skills and Capabilities with WFH Options by Category

The follow tables expand on the table above by listing co-occurrences grouped by category. The same employment type, locality and period is covered with up to 20 co-occurrences shown in each of the following categories:

Application Platforms
1 6 (3.13%) Confluence
2 4 (2.08%) Microsoft Exchange
2 4 (2.08%) SharePoint
3 3 (1.56%) OpenStack
4 2 (1.04%) IBM Notes
5 1 (0.52%) BizTalk Server
5 1 (0.52%) CMS
Applications
1 8 (4.17%) Microsoft Office
2 3 (1.56%) Microsoft PowerPoint
3 1 (0.52%) Microsoft Excel
3 1 (0.52%) Microsoft Project
3 1 (0.52%) Spreadsheet
Business Applications
1 4 (2.08%) Dynamics CRM
2 1 (0.52%) NetSuite
Cloud Services
1 42 (21.88%) Azure
2 20 (10.42%) AWS
3 11 (5.73%) Entra ID
4 10 (5.21%) SaaS
5 7 (3.65%) Microsoft 365
6 5 (2.60%) GCP
7 4 (2.08%) IaaS
7 4 (2.08%) OneDrive
7 4 (2.08%) PaaS
7 4 (2.08%) Power Platform
8 3 (1.56%) Azure AKS
8 3 (1.56%) GitHub
9 2 (1.04%) Azure DevOps
9 2 (1.04%) Azure ExpressRoute
9 2 (1.04%) Mimecast
9 2 (1.04%) OpenShift
9 2 (1.04%) Rubrik
10 1 (0.52%) GitHub Actions
10 1 (0.52%) Microsoft Purview
10 1 (0.52%) Nutanix
Communications & Networking
1 56 (29.17%) Firewall
2 24 (12.50%) DNS
2 24 (12.50%) Network Security
3 23 (11.98%) WAN
4 22 (11.46%) BGP
5 20 (10.42%) LAN
5 20 (10.42%) VPN
6 19 (9.90%) DHCP
7 18 (9.38%) OSPF
7 18 (9.38%) TCP/IP
8 15 (7.81%) Cisco Nexus
9 13 (6.77%) Wireless
10 11 (5.73%) VXLAN
11 7 (3.65%) EIGRP
11 7 (3.65%) Ethernet VPN
11 7 (3.65%) Wi-Fi
12 6 (3.13%) Internet
12 6 (3.13%) MPLS
12 6 (3.13%) SD-WAN
13 5 (2.60%) SNMP
Database & Business Intelligence
1 10 (5.21%) SQL Server
2 9 (4.69%) Oracle Database
3 6 (3.13%) SQL Server Integration Services
3 6 (3.13%) SQL Server Reporting Services
4 4 (2.08%) Oracle Reports
4 4 (2.08%) Power BI
4 4 (2.08%) Relational Database
5 3 (1.56%) PostgreSQL
6 2 (1.04%) MongoDB
7 1 (0.52%) MySQL
Development Applications
1 6 (3.13%) JIRA
2 5 (2.60%) Jenkins
2 5 (2.60%) Sonatype Nexus
3 3 (1.56%) Git
3 3 (1.56%) Oracle Forms
4 2 (1.04%) Bitbucket
5 1 (0.52%) Artifactory
5 1 (0.52%) Gatling
5 1 (0.52%) GitLab
5 1 (0.52%) JMeter
5 1 (0.52%) Maven
5 1 (0.52%) ScriptRunner
5 1 (0.52%) TestDirector
General
1 60 (31.25%) Finance
2 43 (22.40%) Social Skills
3 20 (10.42%) Analytical Skills
4 15 (7.81%) Banking
5 10 (5.21%) Inclusion and Diversity
5 10 (5.21%) Public Sector
6 5 (2.60%) Organisational Skills
6 5 (2.60%) Telecoms
7 4 (2.08%) Documentation Skills
7 4 (2.08%) Retail
8 3 (1.56%) Military
8 3 (1.56%) Police
9 2 (1.04%) Aerospace
9 2 (1.04%) Fire and Rescue
9 2 (1.04%) Investment Banking
9 2 (1.04%) Law
9 2 (1.04%) Local Government
9 2 (1.04%) Manufacturing
9 2 (1.04%) Presentation Skills
9 2 (1.04%) Swedish Language
Job Titles
1 39 (20.31%) Architect
2 32 (16.67%) Network Engineer
3 21 (10.94%) Lead
4 19 (9.90%) Senior
5 17 (8.85%) Solutions Architect
6 14 (7.29%) Project Manager
7 13 (6.77%) Analyst
8 12 (6.25%) Consultant
9 11 (5.73%) Network Architect
10 10 (5.21%) Senior Network Engineer
11 9 (4.69%) Infrastructure Manager
12 7 (3.65%) Data Centre Engineer
12 7 (3.65%) Test Manager
13 6 (3.13%) Applications Support
13 6 (3.13%) Infrastructure Project Manager
13 6 (3.13%) Security Architect
13 6 (3.13%) Security Engineer
14 5 (2.60%) Cisco Engineer
14 5 (2.60%) Infrastructure Engineer
14 5 (2.60%) Server Engineer
Libraries, Frameworks & Software Standards
1 5 (2.60%) LDAP
2 4 (2.08%) RFC 2544
3 3 (1.56%) .NET
3 3 (1.56%) Kafka
3 3 (1.56%) YAML
4 2 (1.04%) 802.1X
4 2 (1.04%) NETCONF
4 2 (1.04%) REST
5 1 (0.52%) ADO
5 1 (0.52%) Elastic Stack
5 1 (0.52%) FIX Protocol
5 1 (0.52%) HTML
5 1 (0.52%) OAuth
5 1 (0.52%) PySpark
5 1 (0.52%) RESTful
5 1 (0.52%) SAML
5 1 (0.52%) SOAP
5 1 (0.52%) Spring
5 1 (0.52%) Web Services
5 1 (0.52%) XML
Miscellaneous
1 10 (5.21%) Data Protection Act
2 7 (3.65%) Management Information System
3 6 (3.13%) Enterprise Storage
3 6 (3.13%) Private Cloud
4 5 (2.60%) Cyber Threat
4 5 (2.60%) PKI
4 5 (2.60%) Public Cloud
4 5 (2.60%) Security Posture
5 4 (2.08%) Cloud Native
5 4 (2.08%) Fibre Optics
5 4 (2.08%) Hybrid Cloud
5 4 (2.08%) Replication
5 4 (2.08%) Self-Motivation
6 3 (1.56%) Linux Command Line
6 3 (1.56%) Onboarding
6 3 (1.56%) SWIFT Messaging Network
7 2 (1.04%) Driving Licence
7 2 (1.04%) Legacy Applications
7 2 (1.04%) Robotics
7 2 (1.04%) SCADA
Operating Systems
1 32 (16.67%) Linux
2 31 (16.15%) Windows
3 15 (7.81%) Windows Server
4 7 (3.65%) Red Hat Enterprise Linux
5 5 (2.60%) Windows Server 2019
6 3 (1.56%) Unix
7 2 (1.04%) zOS
8 1 (0.52%) VyOS
8 1 (0.52%) Windows 10
8 1 (0.52%) Windows Server 2012
Processes & Methodologies
1 56 (29.17%) Migration
2 32 (16.67%) Problem-Solving
3 24 (12.50%) Agile
4 16 (8.33%) Stakeholder Management
5 15 (7.81%) Change Management
5 15 (7.81%) Infrastructure Engineering
5 15 (7.81%) ITIL
5 15 (7.81%) Project Management
6 14 (7.29%) Disaster Recovery
6 14 (7.29%) High Availability
6 14 (7.29%) Network Design
6 14 (7.29%) Roadmaps
6 14 (7.29%) Stakeholder Engagement
7 13 (6.77%) Technical Leadership
8 12 (6.25%) Risk Management
9 11 (5.73%) Data Protection
9 11 (5.73%) DevOps
10 9 (4.69%) CI/CD
10 9 (4.69%) Cloud Security
10 9 (4.69%) Network Management
Programming Languages
1 18 (9.38%) Python
2 13 (6.77%) SQL
3 12 (6.25%) PowerShell
4 6 (3.13%) Bash
5 3 (1.56%) Java
6 2 (1.04%) Groovy
6 2 (1.04%) JCL
6 2 (1.04%) REXX
7 1 (0.52%) Go
7 1 (0.52%) Perl
7 1 (0.52%) Ruby
7 1 (0.52%) Shell Script
Qualifications
1 47 (24.48%) Security Cleared
2 37 (19.27%) SC Cleared
3 27 (14.06%) Cisco Certification
4 21 (10.94%) CCNP
5 12 (6.25%) Degree
6 8 (4.17%) DV Cleared
7 7 (3.65%) CCIE
8 4 (2.08%) ACCA
8 4 (2.08%) CIMA
8 4 (2.08%) Computer Science Degree
9 3 (1.56%) BPSS Clearance
9 3 (1.56%) CCIE Data Center
9 3 (1.56%) CCNA
10 2 (1.04%) AWS Certification
10 2 (1.04%) Microsoft Certification
10 2 (1.04%) PMI Certification
10 2 (1.04%) PMP
11 1 (0.52%) CISSP
11 1 (0.52%) OCA
11 1 (0.52%) Oracle Certification
Quality Assurance & Compliance
1 6 (3.13%) QA
2 4 (2.08%) GDPR
2 4 (2.08%) SLA
3 3 (1.56%) PCI DSS
4 2 (1.04%) PMO
5 1 (0.52%) COBIT
5 1 (0.52%) Disclosure Scotland
5 1 (0.52%) HIPAA
5 1 (0.52%) NIST
System Software
1 26 (13.54%) VMware Infrastructure
2 20 (10.42%) Active Directory
3 10 (5.21%) VMware ESXi
4 9 (4.69%) Hyper-V
5 7 (3.65%) Virtual Machines
5 7 (3.65%) VMware NSX
6 5 (2.60%) vSphere
7 4 (2.08%) Docker
8 2 (1.04%) NFS
8 2 (1.04%) Time Sharing Option
9 1 (0.52%) Firmware
9 1 (0.52%) Microcode
9 1 (0.52%) Terminal Server
9 1 (0.52%) Virtual Servers
Systems Management
1 15 (7.81%) Ansible
2 11 (5.73%) FortiGate
3 9 (4.69%) vCenter Server
4 7 (3.65%) Terraform
5 6 (3.13%) Kubernetes
5 6 (3.13%) Single Sign-On
6 4 (2.08%) NetBackup
6 4 (2.08%) Oracle RMAN
7 3 (1.56%) Microsoft Intune
7 3 (1.56%) Progress Chef
8 2 (1.04%) Grafana
8 2 (1.04%) SCCM
8 2 (1.04%) Tivoli Storage Manager
9 1 (0.52%) CASB
9 1 (0.52%) Cloudify
9 1 (0.52%) HP ALM
9 1 (0.52%) OfficeScan
9 1 (0.52%) PowerCLI
9 1 (0.52%) Prometheus
9 1 (0.52%) Trend Micro Deep Security
Vendors
1 51 (26.56%) Cisco
2 43 (22.40%) VMware
3 28 (14.58%) Microsoft
4 18 (9.38%) Palo Alto
5 17 (8.85%) Fortinet
6 13 (6.77%) Oracle
7 12 (6.25%) Dell
7 12 (6.25%) Juniper
8 11 (5.73%) HP
9 10 (5.21%) Red Hat
9 10 (5.21%) ServiceNow
10 8 (4.17%) F5
10 8 (4.17%) IBM
11 7 (3.65%) Commvault
11 7 (3.65%) Meraki
12 6 (3.13%) CheckPoint
12 6 (3.13%) CyberArk
13 5 (2.60%) Arista
13 5 (2.60%) Broadcom
13 5 (2.60%) SolarWinds