Legacy Systems Contracts with Hybrid/Remote/WFH Options

Legacy System
UK > Work from Home

The table below looks at the prevalence of the term Legacy Systems in remote or hybrid contract work. Included is a benchmarking guide to the contractor rates offered in vacancies that cited Legacy Systems over the 6 months leading up to 1 May 2025, comparing them to the same period in the previous two years.

6 months to
1 May 2025
Same period 2024 Same period 2023
Rank 195 234 252
Rank change year-on-year +39 +18 +9
Contract jobs citing Legacy Systems 109 111 241
As % of all contract jobs with a WFH option 1.10% 0.72% 0.93%
As % of the Miscellaneous category 3.33% 2.52% 2.96%
Number of daily rates quoted 65 86 188
10th Percentile £405 £411 £394
25th Percentile £470 £463 £450
Median daily rate (50th Percentile) £572 £500 £500
Median % change year-on-year +14.40% - -7.41%
75th Percentile £725 £584 £600
90th Percentile £773 £688 £725
UK median daily rate £556 £525 £525
% change year-on-year +5.95% - -4.55%
Number of hourly rates quoted 1 1 2
10th Percentile - - -
25th Percentile - £51.25 £56.25
Median hourly rate £18.22 £52.50 £57.50
Median % change year-on-year -65.30% -8.70% +50.70%
75th Percentile - £53.75 £58.75
90th Percentile - - -
UK median hourly rate £36.00 £15.79 £57.50
% change year-on-year +127.99% -72.54% +108.50%

All Generic Skills
Work from Home

Legacy Systems falls under the General and Transferable Skills category. For comparison with the information above, the following table provides summary statistics for all contract job vacancies with remote or hybrid options requiring generic IT skills.

Contract vacancies with a requirement for generic IT skills 3,272 4,408 8,138
As % of all contract jobs with a WFH option 33.03% 28.73% 31.47%
Number of daily rates quoted 2,222 2,974 5,725
10th Percentile £350 £325 £363
25th Percentile £425 £431 £454
Median daily rate (50th Percentile) £545 £550 £550
Median % change year-on-year -0.91% - +2.33%
75th Percentile £680 £675 £688
90th Percentile £825 £800 £800
UK median daily rate £525 £538 £550
% change year-on-year -2.33% -2.27% -
Number of hourly rates quoted 76 199 151
10th Percentile £18.75 £15.48 £19.00
25th Percentile £26.25 £25.50 £31.38
Median hourly rate £41.75 £51.00 £57.50
Median % change year-on-year -18.14% -11.30% +29.21%
75th Percentile £64.57 £65.02 £70.00
90th Percentile £78.13 £72.50 £85.00
UK median hourly rate £32.05 £30.00 £22.49
% change year-on-year +6.83% +33.42% -18.24%

Legacy Systems
Trend for Jobs with a WFH Option

Job vacancies with remote working options citing Legacy Systems as a proportion of all IT jobs advertised.
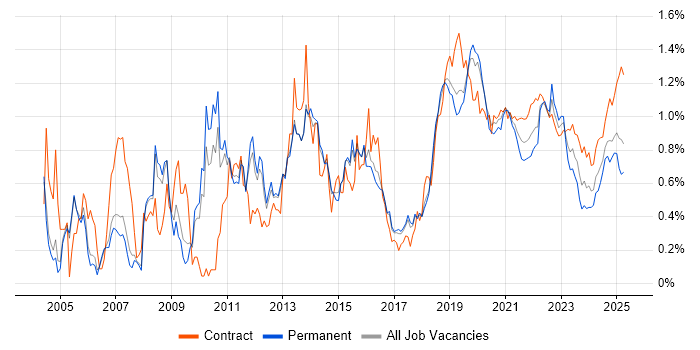
Legacy Systems trend for jobs with Hybrid/Remote/WFH options

Legacy Systems
Daily Rate Trend for Jobs with a WFH Option

3-month moving average daily rate quoted in job vacancies with remote working options citing Legacy Systems.

Legacy Systems daily rate for jobs with a WFH option

Legacy Systems
Daily Rate Histogram for Jobs with a WFH Option

Daily rate distribution for jobs with remote working options citing Legacy Systems over the 6 months to 1 May 2025.

Legacy Systems daily rate histogram for jobs with a WFH option

Legacy Systems
Hourly Rate Trend for Jobs with a WFH Option

3-month moving average hourly rate quoted in job vacancies with remote working options citing Legacy Systems.

Legacy Systems hourly rate for jobs with a WFH option

Legacy Systems
Co-occurring Skills and Capabilities with WFH Options by Category

The follow tables expand on the table above by listing co-occurrences grouped by category. The same employment type, locality and period is covered with up to 20 co-occurrences shown in each of the following categories:

Application Platforms
1 4 (3.67%) Confluence
1 4 (3.67%) SharePoint
2 2 (1.83%) Apache Airflow
3 1 (0.92%) Apache
3 1 (0.92%) BizTalk Server
3 1 (0.92%) GeoServer
3 1 (0.92%) Oracle Workflow
Applications
1 3 (2.75%) MS Visio
2 1 (0.92%) Microsoft Excel
Business Applications
1 7 (6.42%) SAP S/4HANA
2 4 (3.67%) Aladdin
3 3 (2.75%) Oracle EBS
4 2 (1.83%) NetSuite
4 2 (1.83%) SAP SCM
5 1 (0.92%) Oracle Applications
5 1 (0.92%) Oracle ERP
5 1 (0.92%) Salesforce CRM
5 1 (0.92%) SAP APO
5 1 (0.92%) SAP CRM
5 1 (0.92%) SAP EWM
5 1 (0.92%) SAP Forecasting and Replenishment
5 1 (0.92%) SAP MDG
5 1 (0.92%) SAP PM
5 1 (0.92%) SAP POS DM
5 1 (0.92%) SAP Retail
5 1 (0.92%) Summit
Cloud Services
1 25 (22.94%) Azure
2 19 (17.43%) AWS
3 8 (7.34%) Snowflake
4 7 (6.42%) GCP
5 6 (5.50%) Power Platform
6 5 (4.59%) AWS Lambda
6 5 (4.59%) SaaS
6 5 (4.59%) Serverless
7 4 (3.67%) Amazon S3
8 3 (2.75%) AWS CloudFormation
8 3 (2.75%) Azure Cosmos DB
8 3 (2.75%) Azure DevOps
9 2 (1.83%) Apple Pay
9 2 (1.83%) Azure Functions
9 2 (1.83%) Azure Synapse Analytics
9 2 (1.83%) Entra ID
9 2 (1.83%) GitHub
9 2 (1.83%) Google Pay
10 1 (0.92%) Amazon EMR
10 1 (0.92%) Microsoft 365
Communications & Networking
1 1 (0.92%) BGP
1 1 (0.92%) Cisco Nexus
1 1 (0.92%) Ethernet
1 1 (0.92%) Ethernet VPN
1 1 (0.92%) Extranet
1 1 (0.92%) Firewall
1 1 (0.92%) Intranet
1 1 (0.92%) LAN
1 1 (0.92%) Multicast
1 1 (0.92%) PBX
1 1 (0.92%) VoIP
1 1 (0.92%) VPN
1 1 (0.92%) VXLAN
1 1 (0.92%) Wi-Fi
Database & Business Intelligence
1 6 (5.50%) Data Lake
1 6 (5.50%) Data Warehouse
1 6 (5.50%) PostgreSQL
1 6 (5.50%) Power BI
2 4 (3.67%) SQL Server
3 3 (2.75%) SAP HANA
4 2 (1.83%) Amazon Aurora
4 2 (1.83%) Azure SQL Database
4 2 (1.83%) DynamoDB
4 2 (1.83%) MongoDB
4 2 (1.83%) NoSQL
4 2 (1.83%) Oracle Database
4 2 (1.83%) SAP BW
4 2 (1.83%) SAP Data Services
5 1 (0.92%) Adabas
5 1 (0.92%) Data Mining
5 1 (0.92%) DB2
5 1 (0.92%) GIS
5 1 (0.92%) MySQL
5 1 (0.92%) PowerCenter
Development Applications
1 13 (11.93%) JIRA
2 4 (3.67%) Team Foundation Server
3 3 (2.75%) Git
3 3 (2.75%) REST Assured
4 2 (1.83%) Jenkins
4 2 (1.83%) MSTest
4 2 (1.83%) NUnit
4 2 (1.83%) Postman
4 2 (1.83%) Visual Studio
5 1 (0.92%) Bitbucket
5 1 (0.92%) CircleCI
5 1 (0.92%) Cucumber
5 1 (0.92%) Cypress.io
5 1 (0.92%) ERwin
5 1 (0.92%) GitLab
5 1 (0.92%) LSMW
5 1 (0.92%) Subversion
General
1 31 (28.44%) Social Skills
2 26 (23.85%) Finance
3 18 (16.51%) Analytical Skills
4 15 (13.76%) Public Sector
5 9 (8.26%) Banking
6 5 (4.59%) Automotive
7 4 (3.67%) Retail
8 3 (2.75%) Back Office
8 3 (2.75%) Law
8 3 (2.75%) Manufacturing
8 3 (2.75%) Telecoms
9 2 (1.83%) Billing
9 2 (1.83%) Documentation Skills
9 2 (1.83%) Legal
9 2 (1.83%) Local Government
9 2 (1.83%) Marketing
9 2 (1.83%) Organisational Skills
10 1 (0.92%) Aviation
10 1 (0.92%) Inclusion and Diversity
10 1 (0.92%) Influencing Skills
Job Titles
1 21 (19.27%) Architect
2 14 (12.84%) Analyst
3 12 (11.01%) Consultant
3 12 (11.01%) Data Engineer
4 11 (10.09%) Lead
5 10 (9.17%) Developer
5 10 (9.17%) Solutions Architect
6 9 (8.26%) Project Manager
7 8 (7.34%) Business Analyst
7 8 (7.34%) Tester
8 5 (4.59%) Data Architect
9 4 (3.67%) .NET Developer
9 4 (3.67%) Data Analyst
9 4 (3.67%) Senior
10 3 (2.75%) Data Migration Engineer
10 3 (2.75%) Enterprise Architect
10 3 (2.75%) Migration Consultant
10 3 (2.75%) Migration Engineer
10 3 (2.75%) SAP Consultant
10 3 (2.75%) Technical Analyst
Libraries, Frameworks & Software Standards
1 8 (7.34%) .NET
2 5 (4.59%) .NET Core
2 5 (4.59%) Middleware
2 5 (4.59%) REST
3 4 (3.67%) AngularJS
3 4 (3.67%) Oracle Fusion
3 4 (3.67%) Spring Boot
3 4 (3.67%) Web Services
4 3 (2.75%) Gherkin
4 3 (2.75%) Node.js
4 3 (2.75%) PySpark
5 2 (1.83%) ADO
5 2 (1.83%) FHIR
5 2 (1.83%) Kafka
5 2 (1.83%) Next.js
5 2 (1.83%) React
5 2 (1.83%) SOAP
5 2 (1.83%) Spring
5 2 (1.83%) WCF
5 2 (1.83%) XML
Miscellaneous
1 8 (7.34%) SCADA
2 6 (5.50%) Management Information System
3 3 (2.75%) Data Structures
4 2 (1.83%) Cloud Native
4 2 (1.83%) Cyber Threat
4 2 (1.83%) Digital Wallet
4 2 (1.83%) Enterprise Software
4 2 (1.83%) Legacy Applications
4 2 (1.83%) Onboarding
4 2 (1.83%) Operational Technology
4 2 (1.83%) PMI
4 2 (1.83%) Public Cloud
4 2 (1.83%) Self-Motivation
5 1 (0.92%) Data Protection Act
5 1 (0.92%) Foreign Exchange (FX)
5 1 (0.92%) Life Science
5 1 (0.92%) Mainframe
5 1 (0.92%) NHS
5 1 (0.92%) Product Ownership
5 1 (0.92%) VWAP
Operating Systems
1 4 (3.67%) Windows
2 2 (1.83%) Unix
3 1 (0.92%) Windows Server
3 1 (0.92%) Windows Server 2008
3 1 (0.92%) Windows Server 2019
Processes & Methodologies
1 48 (44.04%) Migration
2 25 (22.94%) Data Migration
3 21 (19.27%) Problem-Solving
4 20 (18.35%) Data Modelling
5 19 (17.43%) Agile
5 19 (17.43%) Stakeholder Management
6 18 (16.51%) Data Governance
6 18 (16.51%) ETL
7 14 (12.84%) ERP
8 13 (11.93%) DevOps
9 12 (11.01%) CI/CD
10 11 (10.09%) User Acceptance Testing
10 11 (10.09%) Validation
11 10 (9.17%) Business Intelligence
11 10 (9.17%) Data Management
11 10 (9.17%) Stakeholder Engagement
12 9 (8.26%) Continuous Improvement
12 9 (8.26%) CRM
12 9 (8.26%) Mentoring
12 9 (8.26%) Workshop Facilitation
Programming Languages
1 25 (22.94%) SQL
2 13 (11.93%) Python
3 6 (5.50%) JavaScript
4 5 (4.59%) C#
4 5 (4.59%) PL/SQL
5 4 (3.67%) Bash
5 4 (3.67%) Java
6 2 (1.83%) PowerShell
6 2 (1.83%) T-SQL
6 2 (1.83%) TypeScript
7 1 (0.92%) ABAP
7 1 (0.92%) C++
7 1 (0.92%) COBOL
7 1 (0.92%) FoxPro (VFP)
7 1 (0.92%) Go
7 1 (0.92%) JCL
7 1 (0.92%) Natural
7 1 (0.92%) Ruby
7 1 (0.92%) Rust
7 1 (0.92%) Shell Script
Qualifications
1 10 (9.17%) Security Cleared
2 8 (7.34%) SC Cleared
3 6 (5.50%) Degree
4 5 (4.59%) PMI Certification
5 3 (2.75%) Computer Science Degree
5 3 (2.75%) PMP
6 2 (1.83%) BPSS Clearance
7 1 (0.92%) AWS Certification
7 1 (0.92%) AWS Certified Solutions Architect
7 1 (0.92%) Azure Certification
7 1 (0.92%) CSPO
7 1 (0.92%) DV Cleared
7 1 (0.92%) ISTQB
7 1 (0.92%) Master's Degree
7 1 (0.92%) Microsoft Certification
7 1 (0.92%) SnowPro
7 1 (0.92%) TOGAF Certification
Quality Assurance & Compliance
1 13 (11.93%) Data Quality
1 13 (11.93%) QA
2 6 (5.50%) GDPR
3 4 (3.67%) Accessibility
4 2 (1.83%) Disclosure Scotland
4 2 (1.83%) NIST
4 2 (1.83%) NIST 800
4 2 (1.83%) PMO
5 1 (0.92%) EMIR
5 1 (0.92%) HIPAA
5 1 (0.92%) ISO/IEC 27001
5 1 (0.92%) MiFID
System Software
1 4 (3.67%) Docker
2 2 (1.83%) Active Directory
3 1 (0.92%) Virtual Desktop
Systems Management
1 4 (3.67%) Kubernetes
2 2 (1.83%) Terraform
3 1 (0.92%) Grafana
3 1 (0.92%) SCCM
3 1 (0.92%) Single Sign-On
Vendors
1 12 (11.01%) Oracle
1 12 (11.01%) SAP
2 11 (10.09%) Microsoft
3 10 (9.17%) Salesforce
4 6 (5.50%) Databricks
4 6 (5.50%) Google
5 3 (2.75%) ServiceNow
6 2 (1.83%) Apple
6 2 (1.83%) Ariba
6 2 (1.83%) MuleSoft
7 1 (0.92%) Bloomberg
7 1 (0.92%) Cisco
7 1 (0.92%) Citrix
7 1 (0.92%) Ericsson
7 1 (0.92%) IBM
7 1 (0.92%) Informatica
7 1 (0.92%) Murex
7 1 (0.92%) QAD
7 1 (0.92%) Siemens
7 1 (0.92%) Teradata