User Stories Contracts with Hybrid/Remote/WFH Options

User Story
UK > Work from Home

The table below provides summary statistics for remote or hybrid contract work requiring User Stories skills. It includes a benchmarking guide to the contractor rates offered in vacancies that cited User Stories over the 6 months leading up to 1 May 2025, comparing them to the same period in the previous two years.

6 months to
1 May 2025
Same period 2024 Same period 2023
Rank 140 99 107
Rank change year-on-year -41 +8 -28
Contract jobs citing User Stories 183 342 581
As % of all contract jobs with a WFH option 1.85% 2.23% 2.25%
As % of the Processes & Methodologies category 2.03% 2.54% 2.50%
Number of daily rates quoted 123 238 427
10th Percentile £356 £396 £400
25th Percentile £413 £450 £440
Median daily rate (50th Percentile) £475 £525 £520
Median % change year-on-year -9.52% +0.96% +4.00%
75th Percentile £597 £587 £600
90th Percentile £671 £638 £650
UK median daily rate £500 £538 £515
% change year-on-year -6.98% +4.37% +2.49%
Number of hourly rates quoted 3 2 2
10th Percentile - £52.88 -
25th Percentile - £55.31 £62.00
Median hourly rate £53.50 £61.25 £64.00
Median % change year-on-year -12.65% -4.30% +82.86%
75th Percentile £63.00 £67.81 £66.00
90th Percentile £68.70 £70.63 -
UK median hourly rate £53.50 £42.75 £64.50
% change year-on-year +25.15% -33.72% +51.76%

All Process and Methodology Skills
Work from Home

User Stories falls under the Processes and Methodologies category. For comparison with the information above, the following table provides summary statistics for all contract job vacancies with remote or hybrid options requiring process or methodology skills.

Contract vacancies with a requirement for process or methodology skills 9,021 13,483 23,229
As % of all contract jobs with a WFH option 91.08% 87.87% 89.84%
Number of daily rates quoted 6,191 8,996 16,418
10th Percentile £340 £325 £363
25th Percentile £419 £425 £450
Median daily rate (50th Percentile) £525 £525 £540
Median % change year-on-year - -2.78% +2.86%
75th Percentile £638 £638 £650
90th Percentile £763 £750 £750
UK median daily rate £520 £525 £550
% change year-on-year -0.95% -4.55% +4.76%
Number of hourly rates quoted 224 579 532
10th Percentile £14.20 £15.17 £19.00
25th Percentile £19.56 £25.25 £30.54
Median hourly rate £39.52 £43.00 £55.00
Median % change year-on-year -8.09% -21.82% +57.14%
75th Percentile £66.13 £60.00 £68.75
90th Percentile £75.00 £75.25 £80.23
UK median hourly rate £29.00 £35.65 £37.30
% change year-on-year -18.65% -4.42% +49.20%

User Stories
Trend for Jobs with a WFH Option

Job vacancies with remote working options citing User Stories as a proportion of all IT jobs advertised.
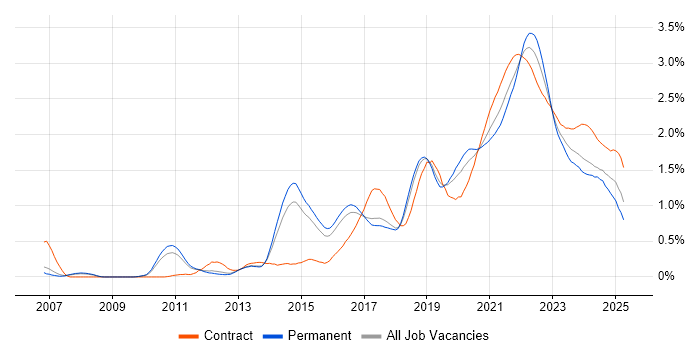
User Stories trend for jobs with Hybrid/Remote/WFH options

User Stories
Daily Rate Trend for Jobs with a WFH Option

3-month moving average daily rate quoted in job vacancies with remote working options citing User Stories.

User Stories daily rate for jobs with a WFH option

User Stories
Daily Rate Histogram for Jobs with a WFH Option

Daily rate distribution for jobs with remote working options citing User Stories over the 6 months to 1 May 2025.

User Stories daily rate histogram for jobs with a WFH option

User Stories
Hourly Rate Trend for Jobs with a WFH Option

3-month moving average hourly rate quoted in job vacancies with remote working options citing User Stories.

User Stories hourly rate for jobs with a WFH option

User Stories
Hourly Rate Histogram for Jobs with a WFH Option

Hourly rate distribution for jobs with remote working options citing User Stories over the 6 months to 1 May 2025.

User Stories hourly rate histogram for jobs with a WFH option

User Stories
Co-occurring Skills and Capabilities with WFH Options by Category

The follow tables expand on the table above by listing co-occurrences grouped by category. The same employment type, locality and period is covered with up to 20 co-occurrences shown in each of the following categories:

Application Platforms
1 34 (18.58%) Confluence
2 4 (2.19%) CMS
3 3 (1.64%) Apache Spark
3 3 (1.64%) Drupal
3 3 (1.64%) Oracle Workflow
4 1 (0.55%) Oracle Self-Service HR
4 1 (0.55%) SharePoint
4 1 (0.55%) Sitecore CMS
Applications
1 12 (6.56%) Trello
2 7 (3.83%) MS Visio
3 4 (2.19%) Microsoft Excel
4 3 (1.64%) Microsoft PowerPoint
5 1 (0.55%) Adobe XD
5 1 (0.55%) Fusion 360
5 1 (0.55%) InVision
5 1 (0.55%) Microsoft Office
5 1 (0.55%) Siemens NX
5 1 (0.55%) Sketch
5 1 (0.55%) UserZoom
Business Applications
1 4 (2.19%) Dynamics CRM
1 4 (2.19%) SAP S/4HANA
2 2 (1.09%) Primavera
2 2 (1.09%) SAP MM
2 2 (1.09%) Teamcenter
3 1 (0.55%) iTrent
3 1 (0.55%) Oracle EBS
3 1 (0.55%) Oracle E-Business Tax
3 1 (0.55%) Oracle FAH
3 1 (0.55%) Oracle Financials
3 1 (0.55%) Oracle Payables
3 1 (0.55%) Salesforce CRM
3 1 (0.55%) SAP MDG
3 1 (0.55%) SAP MDM
3 1 (0.55%) SAP PLM
3 1 (0.55%) Workday HCM
Cloud Services
1 39 (21.31%) Azure
2 17 (9.29%) Azure DevOps
3 15 (8.20%) AWS
4 14 (7.65%) Power Platform
5 6 (3.28%) Dynamics 365
6 5 (2.73%) Miro
6 5 (2.73%) SaaS
7 4 (2.19%) PowerApps
8 3 (1.64%) Azure Data Factory
8 3 (1.64%) Azure Functions
8 3 (1.64%) Azure Logic Apps
8 3 (1.64%) GCP
8 3 (1.64%) GitHub
8 3 (1.64%) Serverless
9 2 (1.09%) Amazon CloudWatch
9 2 (1.09%) Asana
9 2 (1.09%) Azure Service Bus
9 2 (1.09%) Azure Storage
9 2 (1.09%) Microsoft Purview
9 2 (1.09%) Salesforce Sales Cloud
Communications & Networking
1 1 (0.55%) Converged Networks
1 1 (0.55%) MQTT
Database & Business Intelligence
1 9 (4.92%) Power BI
2 6 (3.28%) PostgreSQL
3 4 (2.19%) Tableau
4 3 (1.64%) Amazon RDS
4 3 (1.64%) Azure SQL Database
5 2 (1.09%) Amazon Athena
5 2 (1.09%) Big Data
5 2 (1.09%) BusinessObjects
5 2 (1.09%) BusinessObjects Business Intelligence
5 2 (1.09%) Oracle Reports
5 2 (1.09%) Relational Database
5 2 (1.09%) Snowflake Schema
5 2 (1.09%) Tableau Server
6 1 (0.55%) Data Mining
6 1 (0.55%) Data Warehouse
6 1 (0.55%) Delta Lake
6 1 (0.55%) DocumentDB
6 1 (0.55%) MySQL
6 1 (0.55%) Semantic Layer
6 1 (0.55%) SQL Server
Development Applications
1 50 (27.32%) JIRA
2 5 (2.73%) GitLab
3 4 (2.19%) Jenkins
4 3 (1.64%) Git
5 2 (1.09%) Postman
5 2 (1.09%) Selenium
5 2 (1.09%) SonarQube
6 1 (0.55%) Axure RP
6 1 (0.55%) Cucumber
6 1 (0.55%) Cypress.io
6 1 (0.55%) Gatling
6 1 (0.55%) Hamcrest
6 1 (0.55%) JUnit
6 1 (0.55%) Maven
6 1 (0.55%) MLflow
6 1 (0.55%) REST Assured
6 1 (0.55%) Serenity BDD
6 1 (0.55%) SpecFlow
6 1 (0.55%) TestComplete
6 1 (0.55%) Visual Studio Code
General
1 81 (44.26%) Social Skills
2 36 (19.67%) Public Sector
3 30 (16.39%) Finance
4 29 (15.85%) Analytical Skills
5 22 (12.02%) Banking
6 10 (5.46%) Inclusion and Diversity
7 6 (3.28%) Influencing Skills
7 6 (3.28%) Marketing
7 6 (3.28%) Presentation Skills
8 5 (2.73%) Documentation Skills
8 5 (2.73%) Manufacturing
8 5 (2.73%) Retail
9 3 (1.64%) Legal
9 3 (1.64%) Organisational Skills
10 2 (1.09%) Automotive
10 2 (1.09%) Electronics
10 2 (1.09%) Investment Banking
10 2 (1.09%) Pharmaceutical
11 1 (0.55%) Billing
11 1 (0.55%) General Ledger
Job Titles
1 93 (50.82%) Analyst
2 85 (46.45%) Business Analyst
3 18 (9.84%) Senior
4 17 (9.29%) Product Owner
5 11 (6.01%) Senior Analyst
6 10 (5.46%) Agile Business Analyst
6 10 (5.46%) Consultant
6 10 (5.46%) Data Business Analyst
6 10 (5.46%) Senior Business Analyst
7 9 (4.92%) Data Analyst
7 9 (4.92%) Product Manager
7 9 (4.92%) Technical Analyst
7 9 (4.92%) Technical Business Analyst
8 8 (4.37%) Developer
9 6 (3.28%) Architect
9 6 (3.28%) Designer
9 6 (3.28%) Interaction Designer
9 6 (3.28%) Product Analyst
10 5 (2.73%) SAP Analyst
10 5 (2.73%) SAP Engineer
Libraries, Frameworks & Software Standards
1 5 (2.73%) CSS
2 4 (2.19%) HTML
3 3 (1.64%) ADO
3 3 (1.64%) OAuth
3 3 (1.64%) RabbitMQ
3 3 (1.64%) REST
4 2 (1.09%) .NET
4 2 (1.09%) .NET Framework
4 2 (1.09%) AngularJS
4 2 (1.09%) Elastic Stack
4 2 (1.09%) Entity Framework
4 2 (1.09%) Gherkin
4 2 (1.09%) Kafka
4 2 (1.09%) PySpark
4 2 (1.09%) SAP TM
4 2 (1.09%) Sass
4 2 (1.09%) Spring
4 2 (1.09%) Spring Boot
4 2 (1.09%) Swagger
4 2 (1.09%) Web Services
Miscellaneous
1 56 (30.60%) Product Ownership
2 4 (2.19%) Analytical Mindset
2 4 (2.19%) Life Science
2 4 (2.19%) Virtual Team
3 3 (1.64%) Data Protection Act
3 3 (1.64%) Legacy Systems
3 3 (1.64%) Management Information System
3 3 (1.64%) Onboarding
3 3 (1.64%) Renewable Energy
4 2 (1.09%) Educational Technology
4 2 (1.09%) IoT
4 2 (1.09%) SCADA
5 1 (0.55%) Derivative
5 1 (0.55%) Embedded Systems
5 1 (0.55%) Enterprise Software
5 1 (0.55%) Linux Command Line
5 1 (0.55%) Mobile App
5 1 (0.55%) Public Cloud
5 1 (0.55%) Reinsurance
5 1 (0.55%) Smart Meter
Operating Systems
1 2 (1.09%) Linux
1 2 (1.09%) Windows
2 1 (0.55%) Android
2 1 (0.55%) Apple iOS
Processes & Methodologies
1 130 (71.04%) Agile
2 67 (36.61%) Acceptance Criteria
3 43 (23.50%) Workshop Facilitation
4 42 (22.95%) Problem-Solving
5 41 (22.40%) Scrum
6 39 (21.31%) Stakeholder Management
7 36 (19.67%) Business Analysis
8 34 (18.58%) User Experience
9 31 (16.94%) Sprint Planning
9 31 (16.94%) User Research
10 29 (15.85%) Requirements Gathering
11 27 (14.75%) Roadmaps
12 26 (14.21%) Epics
12 26 (14.21%) Product Backlog
13 24 (13.11%) Backlog Management
13 24 (13.11%) DevOps
14 21 (11.48%) Analytics
14 21 (11.48%) Continuous Improvement
14 21 (11.48%) User Acceptance Testing
15 20 (10.93%) GAP Analysis
Programming Languages
1 12 (6.56%) SQL
2 7 (3.83%) Python
3 5 (2.73%) Java
4 3 (1.64%) C#
5 2 (1.09%) ABAP
5 2 (1.09%) JavaScript
5 2 (1.09%) T-SQL
6 1 (0.55%) Bash
6 1 (0.55%) Data Analysis Expressions
6 1 (0.55%) Ruby
6 1 (0.55%) TypeScript
Qualifications
1 24 (13.11%) Security Cleared
2 19 (10.38%) Degree
3 12 (6.56%) SC Cleared
4 4 (2.19%) Computer Science Degree
4 4 (2.19%) IIBA
5 3 (1.64%) CSPO
5 3 (1.64%) DV Cleared
6 2 (1.09%) BPSS Clearance
6 2 (1.09%) SAFe Agilist
7 1 (0.55%) Master's Degree
7 1 (0.55%) Numerate Degree
7 1 (0.55%) PMI Certification
Quality Assurance & Compliance
1 21 (11.48%) QA
2 14 (7.65%) Accessibility
3 4 (2.19%) Data Quality
4 2 (1.09%) COREP
4 2 (1.09%) FINREP
4 2 (1.09%) GRC
4 2 (1.09%) GxP
4 2 (1.09%) HL7
5 1 (0.55%) Actionable Recommendations
5 1 (0.55%) MiFID
System Software
1 6 (3.28%) Docker
2 1 (0.55%) Active Directory
Systems Management
1 4 (2.19%) Kubernetes
2 3 (1.64%) HP ALM
2 3 (1.64%) Terraform
3 1 (0.55%) Ansible
3 1 (0.55%) Argo
3 1 (0.55%) Grafana
3 1 (0.55%) HP Quality Center
3 1 (0.55%) MIIS
3 1 (0.55%) Progress Chef
3 1 (0.55%) Prometheus
3 1 (0.55%) Puppet
3 1 (0.55%) Rancher
3 1 (0.55%) SCCM
Vendors
1 20 (10.93%) Microsoft
2 15 (8.20%) SAP
3 11 (6.01%) Oracle
3 11 (6.01%) Salesforce
4 4 (2.19%) Databricks
5 3 (1.64%) Google
5 3 (1.64%) HP
5 3 (1.64%) Palantir
5 3 (1.64%) ServiceNow
5 3 (1.64%) Workday
6 2 (1.09%) Adobe
6 2 (1.09%) Ariba
6 2 (1.09%) IBM
6 2 (1.09%) MuleSoft
6 2 (1.09%) Siebel
6 2 (1.09%) Siemens
6 2 (1.09%) Splunk
7 1 (0.55%) Conga
7 1 (0.55%) Fiserv
7 1 (0.55%) Jaspersoft