Marketing Contracts with Hybrid/Remote/WFH Options

Marketing
UK > Work from Home

The table below looks at the prevalence of the term Marketing in remote or hybrid contract work. Included is a benchmarking guide to the contractor rates offered in vacancies that cited Marketing over the 6 months leading up to 30 April 2025, comparing them to the same period in the previous two years.

6 months to
30 Apr 2025
Same period 2024 Same period 2023
Rank 88 78 113
Rank change year-on-year -10 +35 -26
Contract jobs citing Marketing 277 419 556
As % of all contract jobs with a WFH option 2.79% 2.72% 2.15%
As % of the General category 4.48% 4.63% 3.68%
Number of daily rates quoted 146 269 354
10th Percentile £208 £281 £227
25th Percentile £286 £380 £407
Median daily rate (50th Percentile) £475 £500 £525
Median % change year-on-year -5.00% -4.76% -
75th Percentile £600 £600 £637
90th Percentile £697 £738 £725
UK median daily rate £488 £463 £525
% change year-on-year +5.41% -11.90% -
Number of hourly rates quoted 6 16 13
10th Percentile £20.75 £12.75 £19.23
25th Percentile £26.56 £14.72 £22.50
Median hourly rate £30.00 £25.00 £31.50
Median % change year-on-year +20.00% -20.63% +10.53%
75th Percentile £34.13 £39.22 £60.00
90th Percentile £39.64 £78.28 £63.75
UK median hourly rate £34.58 £34.00 £36.50
% change year-on-year +1.69% -6.85% -2.67%

All General Skills
Work from Home

Marketing falls under the General Skills category. For comparison with the information above, the following table provides summary statistics for all contract job vacancies with remote or hybrid options requiring common skills.

Contract vacancies with a requirement for common skills 6,187 9,044 15,095
As % of all contract jobs with a WFH option 62.42% 58.82% 58.38%
Number of daily rates quoted 4,164 5,919 10,637
10th Percentile £325 £330 £363
25th Percentile £418 £425 £450
Median daily rate (50th Percentile) £525 £538 £550
Median % change year-on-year -2.33% -2.27% +4.76%
75th Percentile £650 £650 £675
90th Percentile £800 £775 £775
UK median daily rate £525 £525 £550
% change year-on-year - -4.55% +2.80%
Number of hourly rates quoted 185 473 346
10th Percentile £14.00 £14.01 £19.03
25th Percentile £18.50 £22.61 £30.00
Median hourly rate £32.50 £38.12 £51.00
Median % change year-on-year -14.74% -25.25% +67.21%
75th Percentile £65.00 £53.00 £67.50
90th Percentile £86.00 £72.50 £80.25
UK median hourly rate £28.00 £30.00 £35.00
% change year-on-year -6.67% -14.29% +59.71%

Marketing
Trend for Jobs with a WFH Option

Job vacancies with remote working options citing Marketing as a proportion of all IT jobs advertised.
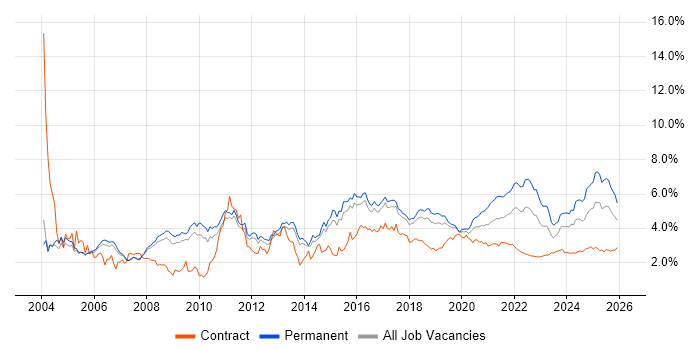
Marketing trend for jobs with Hybrid/Remote/WFH options

Marketing
Daily Rate Trend for Jobs with a WFH Option

3-month moving average daily rate quoted in job vacancies with remote working options citing Marketing.

Marketing daily rate for jobs with a WFH option

Marketing
Daily Rate Histogram for Jobs with a WFH Option

Daily rate distribution for jobs with remote working options citing Marketing over the 6 months to 30 April 2025.

Marketing daily rate histogram for jobs with a WFH option

Marketing
Hourly Rate Trend for Jobs with a WFH Option

3-month moving average hourly rate quoted in job vacancies with remote working options citing Marketing.

Marketing hourly rate for jobs with a WFH option

Marketing
Hourly Rate Histogram for Jobs with a WFH Option

Hourly rate distribution for jobs with remote working options citing Marketing over the 6 months to 30 April 2025.

Marketing hourly rate histogram for jobs with a WFH option

Marketing
Co-occurring Skills and Capabilities with WFH Options by Category

The follow tables expand on the table above by listing co-occurrences grouped by category. The same employment type, locality and period is covered with up to 20 co-occurrences shown in each of the following categories:

Application Platforms
1 13 (4.69%) CMS
2 10 (3.61%) SharePoint
3 8 (2.89%) SAS
4 7 (2.53%) Apache Spark
4 7 (2.53%) Confluence
5 3 (1.08%) Headless CMS
5 3 (1.08%) Microsoft Exchange
5 3 (1.08%) WordPress
6 2 (0.72%) EPiServer
6 2 (0.72%) Umbraco
7 1 (0.36%) Adobe Experience Manager
7 1 (0.36%) Anypoint
7 1 (0.36%) Drupal
7 1 (0.36%) IBM Domino
7 1 (0.36%) Jupyter
7 1 (0.36%) SharePoint 2013
7 1 (0.36%) Sitecore CMS
Applications
1 22 (7.94%) Microsoft Excel
2 15 (5.42%) Microsoft PowerPoint
3 9 (3.25%) Microsoft Office
3 9 (3.25%) Photoshop
4 5 (1.81%) Adobe Illustrator
5 4 (1.44%) Adobe After Effects
5 4 (1.44%) Adobe Creative Suite
5 4 (1.44%) Maya
5 4 (1.44%) MS Visio
6 3 (1.08%) Chatbot
7 2 (0.72%) InVision
7 2 (0.72%) Microsoft Project
8 1 (0.36%) Adobe Premiere
8 1 (0.36%) CINEMA 4D
8 1 (0.36%) InDesign
8 1 (0.36%) Sketch
8 1 (0.36%) Trello
8 1 (0.36%) UserZoom
Business Applications
1 7 (2.53%) Dynamics CRM
2 5 (1.81%) Workfront
3 3 (1.08%) Adobe Campaign
3 3 (1.08%) Shopify
3 3 (1.08%) Unica
4 2 (0.72%) Magento
5 1 (0.36%) Dynamics AX
5 1 (0.36%) Eloqua
5 1 (0.36%) NetSuite
Cloud Services
1 34 (12.27%) Azure
2 27 (9.75%) Power Platform
3 18 (6.50%) AWS
4 14 (5.05%) Adobe Analytics
4 14 (5.05%) Azure DevOps
5 13 (4.69%) Dynamics 365
6 12 (4.33%) GCP
7 10 (3.61%) Google Analytics
8 9 (3.25%) Microsoft 365
8 9 (3.25%) SAP Commerce Cloud
9 7 (2.53%) GitHub
9 7 (2.53%) Google Ads
10 6 (2.17%) PowerApps
10 6 (2.17%) SaaS
11 5 (1.81%) Google Data Studio
11 5 (1.81%) Salesforce Sales Cloud
11 5 (1.81%) Salesforce Service Cloud
11 5 (1.81%) Snowflake
12 4 (1.44%) dbt
12 4 (1.44%) Power Automate
Communications & Networking
1 4 (1.44%) BGP
1 4 (1.44%) OSPF
1 4 (1.44%) TACACS
1 4 (1.44%) TCP/IP
1 4 (1.44%) VLAN
2 3 (1.08%) Firewall
3 2 (0.72%) Intranet
4 1 (0.36%) DNS
4 1 (0.36%) HTTP
Database & Business Intelligence
1 22 (7.94%) Power BI
2 15 (5.42%) Data Warehouse
3 10 (3.61%) Tableau
4 9 (3.25%) Relational Database
5 6 (2.17%) Looker
6 5 (1.81%) Data Mining
7 4 (1.44%) BigQuery
7 4 (1.44%) Power Query
8 3 (1.08%) Big Data
8 3 (1.08%) Qlik Sense
9 2 (0.72%) Amazon RDS
9 2 (0.72%) DynamoDB
9 2 (0.72%) PostgreSQL
10 1 (0.36%) Amazon Athena
10 1 (0.36%) Amazon QuickSight
10 1 (0.36%) Azure SQL Database
10 1 (0.36%) Hadoop
10 1 (0.36%) MongoDB
10 1 (0.36%) PowerPivot
Development Applications
1 18 (6.50%) JIRA
2 8 (2.89%) Git
3 3 (1.08%) Jenkins
4 2 (0.72%) Axure RP
4 2 (0.72%) Bitbucket
4 2 (0.72%) NUnit
4 2 (0.72%) Visual Studio
5 1 (0.36%) Browser DevTools
5 1 (0.36%) Cypress.io
5 1 (0.36%) ERwin
5 1 (0.36%) Maven
5 1 (0.36%) MLflow
5 1 (0.36%) Postman
5 1 (0.36%) Selenium
5 1 (0.36%) Vite
5 1 (0.36%) webpack
General
1 98 (35.38%) Finance
1 98 (35.38%) Social Skills
2 47 (16.97%) Analytical Skills
3 44 (15.88%) Public Sector
4 40 (14.44%) Telecoms
5 36 (13.00%) Electronics
6 35 (12.64%) Manufacturing
7 25 (9.03%) Retail
8 15 (5.42%) Presentation Skills
9 13 (4.69%) Advertising
9 13 (4.69%) Banking
10 12 (4.33%) Legal
11 8 (2.89%) Influencing Skills
12 6 (2.17%) Automotive
12 6 (2.17%) German Language
13 5 (1.81%) French Language
13 5 (1.81%) Games
14 4 (1.44%) Billing
14 4 (1.44%) Military
14 4 (1.44%) Publishing
Job Titles
1 32 (11.55%) Analyst
2 29 (10.47%) Developer
3 24 (8.66%) Project Manager
4 22 (7.94%) Senior
5 17 (6.14%) Lead
6 16 (5.78%) Consultant
7 14 (5.05%) Business Analyst
8 11 (3.97%) Architect
9 10 (3.61%) Data Scientist
9 10 (3.61%) Designer
9 10 (3.61%) Marketing Manager
10 8 (2.89%) Data Manager
10 8 (2.89%) Digital Executive
10 8 (2.89%) Insight Manager
10 8 (2.89%) Strategy Manager
11 7 (2.53%) Analytics Manager
11 7 (2.53%) Data Analytics Manager
11 7 (2.53%) E-Commerce Executive
12 6 (2.17%) CRM Manager
12 6 (2.17%) Data Analyst
Libraries, Frameworks & Software Standards
1 12 (4.33%) HTML
2 11 (3.97%) CSS
3 7 (2.53%) Lightning Web Components
4 6 (2.17%) .NET
4 6 (2.17%) REST
5 5 (1.81%) AngularJS
5 5 (1.81%) Visualforce
6 4 (1.44%) FastAPI
6 4 (1.44%) JSON
6 4 (1.44%) Next.js
6 4 (1.44%) React
6 4 (1.44%) Unreal Engine
7 3 (1.08%) .NET Core
7 3 (1.08%) Middleware
7 3 (1.08%) OAuth
7 3 (1.08%) SOAP
7 3 (1.08%) Web Services
8 2 (0.72%) HTML5
8 2 (0.72%) jQuery
8 2 (0.72%) YAML
Miscellaneous
1 20 (7.22%) Social Media
2 19 (6.86%) Product Ownership
3 17 (6.14%) Onboarding
4 13 (4.69%) Marketing Technology
5 11 (3.97%) Self-Motivation
6 9 (3.25%) Digital Media
6 9 (3.25%) Management Information System
7 6 (2.17%) Algorithms
7 6 (2.17%) Data Protection Act
7 6 (2.17%) Multi-touch
8 5 (1.81%) FMCG
8 5 (1.81%) Mobile App
9 3 (1.08%) Greenfield Project
9 3 (1.08%) IoT
9 3 (1.08%) Legacy Systems
9 3 (1.08%) Motion Graphics
9 3 (1.08%) PMI
9 3 (1.08%) Taxonomies
9 3 (1.08%) Virtual Team
10 2 (0.72%) Digital Signage
Operating Systems
1 3 (1.08%) Android
1 3 (1.08%) Apple iOS
1 3 (1.08%) Windows
1 3 (1.08%) Windows 10
2 1 (0.36%) Linux
Processes & Methodologies
1 74 (26.71%) Analytics
1 74 (26.71%) Digital Marketing
2 63 (22.74%) Problem-Solving
3 55 (19.86%) Business Intelligence
4 52 (18.77%) Agile
5 43 (15.52%) CRM
6 42 (15.16%) Project Management
7 38 (13.72%) Programme Management
8 31 (11.19%) Stakeholder Management
8 31 (11.19%) User Experience
9 29 (10.47%) Data Analysis
10 26 (9.39%) E-Commerce
11 24 (8.66%) DevOps
12 23 (8.30%) Actionable Insight
13 20 (7.22%) Email Marketing
13 20 (7.22%) Migration
14 19 (6.86%) Visualisation
15 18 (6.50%) Data-Driven Decision Making
15 18 (6.50%) Decision-Making
16 17 (6.14%) Data Science
Programming Languages
1 41 (14.80%) SQL
2 22 (7.94%) Python
3 12 (4.33%) JavaScript
4 10 (3.61%) R
5 7 (2.53%) Apex Code
5 7 (2.53%) PowerShell
6 6 (2.17%) TypeScript
7 5 (1.81%) C#
8 4 (1.44%) Java
9 2 (0.72%) Bicep
9 2 (0.72%) Data Analysis Expressions
10 1 (0.36%) Assembly Language
10 1 (0.36%) Bash
10 1 (0.36%) C
10 1 (0.36%) JCL
10 1 (0.36%) Natural
10 1 (0.36%) SOQL
Qualifications
1 41 (14.80%) Degree
2 16 (5.78%) Security Cleared
3 12 (4.33%) SC Cleared
4 6 (2.17%) Master's Degree
5 3 (1.08%) Computer Science Degree
5 3 (1.08%) Numerate Degree
5 3 (1.08%) PMI Certification
6 2 (0.72%) BPSS Clearance
6 2 (0.72%) DBS Check
6 2 (0.72%) PMP
7 1 (0.36%) APMG
7 1 (0.36%) APMP
7 1 (0.36%) CEH
7 1 (0.36%) CISSP
7 1 (0.36%) ISEB
7 1 (0.36%) PhD
Quality Assurance & Compliance
1 16 (5.78%) Accessibility
2 9 (3.25%) GDPR
3 8 (2.89%) Data Quality
3 8 (2.89%) PMO
4 5 (1.81%) QA
5 2 (0.72%) Actionable Recommendations
5 2 (0.72%) California Consumer Privacy Act
6 1 (0.36%) SLA
6 1 (0.36%) WCAG
System Software
1 7 (2.53%) Docker
2 3 (1.08%) Active Directory
3 1 (0.36%) Firmware
Systems Management
1 4 (1.44%) Terraform
2 3 (1.08%) Kubernetes
2 3 (1.08%) Microsoft Intune
Vendors
1 37 (13.36%) SAP
2 32 (11.55%) Microsoft
3 31 (11.19%) Salesforce
4 29 (10.47%) Adobe
5 24 (8.66%) Google
6 9 (3.25%) Salesforce Marketing Cloud
7 7 (2.53%) Teradata
8 6 (2.17%) Facebook
9 5 (1.81%) Databricks
9 5 (1.81%) IBM
9 5 (1.81%) Splunk
9 5 (1.81%) TikTok
10 4 (1.44%) HubSpot
10 4 (1.44%) Palo Alto
10 4 (1.44%) Twitter
11 3 (1.08%) Atlassian
11 3 (1.08%) Instagram
12 2 (0.72%) Amplitude
12 2 (0.72%) MuleSoft
12 2 (0.72%) Sitecore