Computer Science Contracts with Work from Home Options

Computer Science
UK > Work from Home

The table below provides summary statistics for contract job vacancies with an option to work from home (WFH) and a requirement for Computer Science skills. Included is a benchmarking guide to the contractor rates offered in vacancies that have cited Computer Science over the 6 months to 3 May 2024 with a comparison to the same period in the previous 2 years.

6 months to
3 May 2024
Same period 2023 Same period 2022
Rank 73 128 180
Rank change year-on-year +55 +52 +9
Contract jobs citing Computer Science 417 484 681
As % of all contract jobs with a WFH option 2.74% 1.89% 1.53%
As % of the Processes & Methodologies category 3.11% 2.11% 1.67%
Number of daily rates quoted 260 295 432
10th Percentile £350 £406 £364
25th Percentile £425 £481 £461
Median daily rate (50th Percentile) £550 £590 £575
Median % change year-on-year -6.78% +2.61% +15.00%
75th Percentile £700 £763 £670
90th Percentile £800 £900 £775
UK median daily rate £544 £575 £575
% change year-on-year -5.43% - +10.29%
Number of hourly rates quoted 32 20 17
10th Percentile - - £20.56
25th Percentile £52.50 £19.00 £43.95
Median hourly rate £55.00 £46.25 £49.00
Median % change year-on-year +18.92% -5.61% -13.27%
75th Percentile £65.00 £70.00 £49.50
90th Percentile £72.00 £74.63 £58.85
UK median hourly rate £55.00 £53.19 £47.11
% change year-on-year +3.41% +12.91% +8.29%

All Process and Methodology Skills
Work from Home

Computer Science is in the Processes and Methodologies category. The following table is for comparison with the above and provides summary statistics for all contract job vacancies with a WFH option and a requirement for process or methodology skills.

Contract vacancies with a requirement for process or methodology skills 13,390 22,975 40,674
As % of all contract jobs with a WFH option 87.90% 89.75% 91.15%
Number of daily rates quoted 8,954 16,256 29,514
10th Percentile £325 £363 £363
25th Percentile £425 £450 £431
Median daily rate (50th Percentile) £525 £540 £525
Median % change year-on-year -2.78% +2.86% +8.81%
75th Percentile £638 £650 £625
90th Percentile £750 £750 £720
UK median daily rate £525 £550 £530
% change year-on-year -4.55% +3.77% +8.72%
Number of hourly rates quoted 577 528 541
10th Percentile £15.17 £19.00 £13.75
25th Percentile £25.00 £30.54 £20.00
Median hourly rate £43.00 £55.00 £35.00
Median % change year-on-year -21.82% +57.14% +40.00%
75th Percentile £60.00 £68.75 £55.00
90th Percentile £75.25 £80.25 £67.50
UK median hourly rate £35.95 £36.00 £25.00
% change year-on-year -0.14% +44.00% +2.04%

Computer Science
Trend for Jobs with a WFH Option

Job vacancies with a work from home option citing Computer Science as a proportion of all IT jobs advertised.
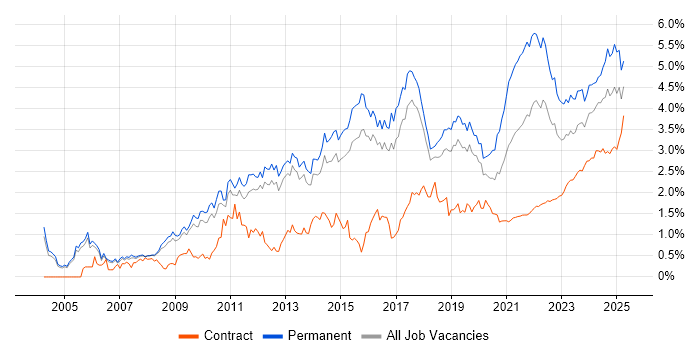
Computer Science trend for jobs with a WFH option

Computer Science
Daily Rate Trend for Jobs with a WFH Option

3-month moving average daily rate quoted in job vacancies with a work from home option citing Computer Science.

Computer Science daily rate for jobs with a WFH option

Computer Science
Daily Rate Histogram for Jobs with a WFH Option

Daily rate distribution for jobs with a work from home option citing Computer Science over the 6 months to 3 May 2024.

Computer Science daily rate histogram for jobs with a WFH option

Computer Science
Hourly Rate Trend for Jobs with a WFH Option

3-month moving average hourly rate quoted in job vacancies with a work from home option citing Computer Science.

Computer Science hourly rate for jobs with a WFH option

Computer Science
Hourly Rate Histogram for Jobs with a WFH Option

Hourly rate distribution for jobs with a work from home option citing Computer Science over the 6 months to 3 May 2024.

Computer Science hourly rate histogram for jobs with a WFH option

Computer Science
Co-occurring Skills and Capabilities with WFH Options by Category

The follow tables expand on the table above by listing co-occurrences grouped by category. The same employment type, locality and period is covered with up to 20 co-occurrences shown in each of the following categories:

Application Platforms
1 10 (2.40%) SharePoint
2 9 (2.16%) Apache Spark
2 9 (2.16%) Confluence
2 9 (2.16%) Microsoft Exchange
3 7 (1.68%) Apache Airflow
4 5 (1.20%) Exchange Server 2003
4 5 (1.20%) Exchange Server 2007
4 5 (1.20%) Exchange Server 2010
4 5 (1.20%) Exchange Server 2013
4 5 (1.20%) Skype for Business
5 4 (0.96%) Apache
6 3 (0.72%) Jupyter
7 2 (0.48%) EPiServer
7 2 (0.48%) Oracle Self-Service HR
7 2 (0.48%) Tomcat
8 1 (0.24%) nginx
8 1 (0.24%) OpenStack
8 1 (0.24%) Oracle SOA Suite
8 1 (0.24%) SAS
8 1 (0.24%) WebSphere
Applications
1 20 (4.80%) Simulink
1 20 (4.80%) Stateflow
2 9 (2.16%) Chatbot
3 7 (1.68%) Microsoft Office
4 6 (1.44%) Microsoft Excel
5 5 (1.20%) Microsoft PowerPoint
5 5 (1.20%) Spreadsheet
6 2 (0.48%) SPSS
7 1 (0.24%) CATIA
7 1 (0.24%) Trello
Business Applications
1 7 (1.68%) SAP S/4HANA
2 4 (0.96%) Dynamics CRM
3 2 (0.48%) Oracle 11i
3 2 (0.48%) Oracle Applications
3 2 (0.48%) Oracle EBS
3 2 (0.48%) Oracle EBS R12
3 2 (0.48%) Oracle Receivables
3 2 (0.48%) Orchestrade
3 2 (0.48%) SAP Retail
4 1 (0.24%) BusinessWorks
4 1 (0.24%) Oracle Assets
4 1 (0.24%) Oracle E-Business Tax
4 1 (0.24%) Oracle General Ledger
4 1 (0.24%) Oracle Payables
4 1 (0.24%) Oracle Procure-to-Pay
4 1 (0.24%) SAP CAR
4 1 (0.24%) SAP CX
4 1 (0.24%) SAP ERP
4 1 (0.24%) SAP POS DM
4 1 (0.24%) Sparx Enterprise Architect
Cloud Services
1 97 (23.26%) Azure
2 64 (15.35%) AWS
3 44 (10.55%) GCP
4 29 (6.95%) Azure DevOps
5 16 (3.84%) Power Platform
6 14 (3.36%) Microsoft 365
7 12 (2.88%) GitHub
7 12 (2.88%) SaaS
8 11 (2.64%) Cloud Computing
8 11 (2.64%) PowerApps
9 6 (1.44%) Amazon ECS
9 6 (1.44%) Amazon EKS
9 6 (1.44%) GitHub Actions
9 6 (1.44%) OpenShift
9 6 (1.44%) PaaS
9 6 (1.44%) Power Automate
9 6 (1.44%) Serverless
9 6 (1.44%) Snowflake
10 5 (1.20%) Amazon EMR
10 5 (1.20%) IaaS
Communications & Networking
1 21 (5.04%) Firewall
2 17 (4.08%) DNS
3 13 (3.12%) Network Security
4 12 (2.88%) TCP/IP
5 11 (2.64%) DHCP
6 8 (1.92%) WAN
6 8 (1.92%) Wireless
7 6 (1.44%) VPN
8 5 (1.20%) Internet
8 5 (1.20%) Junos
8 5 (1.20%) Skype
8 5 (1.20%) VLAN
9 4 (0.96%) SAN
9 4 (0.96%) SDH
10 3 (0.72%) SSL
11 2 (0.48%) HTTP
11 2 (0.48%) Intrusion Detection
11 2 (0.48%) MPLS
11 2 (0.48%) SSH
11 2 (0.48%) Unified Communications
Database & Business Intelligence
1 37 (8.87%) SQL Server
2 20 (4.80%) Relational Database
3 16 (3.84%) Data Warehouse
3 16 (3.84%) PostgreSQL
4 13 (3.12%) NoSQL
4 13 (3.12%) Power BI
5 11 (2.64%) MySQL
6 10 (2.40%) Big Data
6 10 (2.40%) Couchbase
6 10 (2.40%) Metadata
7 9 (2.16%) Tableau
8 8 (1.92%) Hadoop
8 8 (1.92%) MongoDB
9 5 (1.20%) Amazon Redshift
9 5 (1.20%) Oracle Database
10 4 (0.96%) Presto
10 4 (0.96%) RDBMS
10 4 (0.96%) SQL Server Integration Services
11 3 (0.72%) Apache Cassandra
11 3 (0.72%) SQL Server Reporting Services
Development Applications
1 40 (9.59%) Git
2 31 (7.43%) Jenkins
3 28 (6.71%) JIRA
4 20 (4.80%) GitLab
5 6 (1.44%) Atlassian Bamboo
5 6 (1.44%) MLflow
5 6 (1.44%) SQL Server Management Studio (SSMS)
6 5 (1.20%) Bitbucket
6 5 (1.20%) Rational DOORS
6 5 (1.20%) Selenium
6 5 (1.20%) Subversion
7 4 (0.96%) Artifactory
7 4 (0.96%) Oracle APEX
7 4 (0.96%) Postman
8 3 (0.72%) Cypress.io
8 3 (0.72%) TeamCity
8 3 (0.72%) Travis CI
9 2 (0.48%) SpecFlow
9 2 (0.48%) Visual Studio
9 2 (0.48%) WebDriver
General
1 219 (52.52%) Social Skills
2 100 (23.98%) Analytical Skills
3 82 (19.66%) Finance
4 32 (7.67%) Banking
5 31 (7.43%) Legal
6 23 (5.52%) Automotive
6 23 (5.52%) Front Office
7 20 (4.80%) Public Sector
8 16 (3.84%) Telecoms
9 11 (2.64%) Presentation Skills
9 11 (2.64%) Retail
10 9 (2.16%) Financial Institution
10 9 (2.16%) Marketing
11 8 (1.92%) Aerospace
11 8 (1.92%) Investment Banking
11 8 (1.92%) Manufacturing
12 6 (1.44%) Electronics
13 5 (1.20%) Organisational Skills
14 4 (0.96%) Aeronautics
14 4 (0.96%) Inclusion and Diversity
Job Titles
1 74 (17.75%) Developer
2 52 (12.47%) Architect
3 46 (11.03%) Senior
3 46 (11.03%) Software Engineer
4 27 (6.47%) Lead
5 26 (6.24%) Consultant
6 25 (6.00%) Analyst
7 24 (5.76%) Solutions Architect
8 18 (4.32%) DevOps Engineer
9 15 (3.60%) Data Engineer
9 15 (3.60%) Java Developer
9 15 (3.60%) Project Manager
10 12 (2.88%) AWS Engineer
11 11 (2.64%) Azure Engineer
11 11 (2.64%) Senior Developer
12 10 (2.40%) Data Scientist
13 8 (1.92%) .NET Developer
13 8 (1.92%) Lead Data Engineer
13 8 (1.92%) Security Architect
14 7 (1.68%) Security Engineer
Libraries, Frameworks & Software Standards
1 33 (7.91%) HTML
2 31 (7.43%) .NET
3 30 (7.19%) CSS
4 25 (6.00%) React
5 17 (4.08%) Node.js
6 16 (3.84%) RESTful
7 14 (3.36%) .NET Framework
7 14 (3.36%) ASP.NET
8 13 (3.12%) AngularJS
8 13 (3.12%) JSON
9 10 (2.40%) Django
10 9 (2.16%) REST
10 9 (2.16%) Swagger
10 9 (2.16%) XML
11 8 (1.92%) .NET Core
11 8 (1.92%) Entity Framework
11 8 (1.92%) Kafka
11 8 (1.92%) Pandas
11 8 (1.92%) SOAP
11 8 (1.92%) TensorFlow
Miscellaneous
1 59 (14.15%) Algorithms
2 27 (6.47%) Management Information System
3 22 (5.28%) Data Structures
4 21 (5.04%) Self-Motivation
5 13 (3.12%) Derivative
6 10 (2.40%) Blockchain
6 10 (2.40%) Distributed Systems
6 10 (2.40%) Product Ownership
7 9 (2.16%) Cloud Native
8 8 (1.92%) Cyber Threat
8 8 (1.92%) Fixed Income
9 7 (1.68%) Data Protection Act
10 6 (1.44%) Analytical Mindset
10 6 (1.44%) Legacy Systems
10 6 (1.44%) Onboarding
10 6 (1.44%) PKI
10 6 (1.44%) Security Posture
11 5 (1.20%) IVR
11 5 (1.20%) Mobile App
11 5 (1.20%) Virtual Team
Operating Systems
1 37 (8.87%) Windows
2 34 (8.15%) Linux
3 16 (3.84%) Windows Server
4 14 (3.36%) Unix
5 6 (1.44%) Windows Server 2012
6 5 (1.20%) Embedded Linux
6 5 (1.20%) Windows 10
6 5 (1.20%) Windows Server 2003
6 5 (1.20%) Windows Server 2008
7 4 (0.96%) Android
8 3 (0.72%) Ubuntu
9 2 (0.48%) Red Hat Enterprise Linux
9 2 (0.48%) Windows Server 2016
10 1 (0.24%) Apple iOS
10 1 (0.24%) Windows 7
10 1 (0.24%) Windows Mobile
10 1 (0.24%) Windows Server 2019
Processes & Methodologies
1 159 (38.13%) Problem-Solving
2 136 (32.61%) Agile
3 72 (17.27%) Software Engineering
4 71 (17.03%) DevOps
5 48 (11.51%) Project Management
6 46 (11.03%) Validation
7 45 (10.79%) CI/CD
7 45 (10.79%) Test Automation
8 44 (10.55%) Analytics
8 44 (10.55%) Machine Learning
9 42 (10.07%) Data Science
10 41 (9.83%) Continuous Improvement
11 40 (9.59%) Scrum
12 37 (8.87%) Decision-Making
12 37 (8.87%) Migration
13 36 (8.63%) Data Modelling
14 35 (8.39%) Roadmaps
15 34 (8.15%) Artificial Intelligence
16 32 (7.67%) Data Analysis
17 29 (6.95%) Mathematics
Programming Languages
1 121 (29.02%) Python
2 93 (22.30%) SQL
3 67 (16.07%) Java
4 50 (11.99%) JavaScript
5 39 (9.35%) C++
6 36 (8.63%) C#
7 26 (6.24%) MATLAB
8 20 (4.80%) PowerShell
9 17 (4.08%) Perl
10 16 (3.84%) Scala
11 14 (3.36%) Bash
12 13 (3.12%) Go
13 10 (2.40%) R
14 9 (2.16%) Shell Script
14 9 (2.16%) VB.NET
15 8 (1.92%) PL/SQL
16 7 (1.68%) C
16 7 (1.68%) TypeScript
17 5 (1.20%) F#
17 5 (1.20%) Rust
Qualifications
1 348 (83.45%) Degree
2 227 (54.44%) Computer Science Degree
3 77 (18.47%) Master's Degree
4 44 (10.55%) Security Cleared
5 37 (8.87%) SC Cleared
6 32 (7.67%) PhD
7 17 (4.08%) CISSP
8 13 (3.12%) PMP
9 12 (2.88%) Cisco Certification
9 12 (2.88%) CISM
10 10 (2.40%) Azure Certification
10 10 (2.40%) PMI Certification
11 9 (2.16%) Microsoft Certification
12 6 (1.44%) CCNA
12 6 (1.44%) CCNP
12 6 (1.44%) CEH
12 6 (1.44%) Numerate Degree
13 5 (1.20%) DV Cleared
14 4 (0.96%) JNCIA
14 4 (0.96%) MBA
Quality Assurance & Compliance
1 26 (6.24%) QA
2 22 (5.28%) Data Quality
3 10 (2.40%) GDPR
3 10 (2.40%) NIST
4 7 (1.68%) California Consumer Privacy Act
5 6 (1.44%) MiFID
6 5 (1.20%) Accessibility
7 4 (0.96%) Automotive SPICE
7 4 (0.96%) AUTOSAR
7 4 (0.96%) Dodd-Frank
7 4 (0.96%) JTAG
7 4 (0.96%) NIST 800
8 2 (0.48%) GRC
8 2 (0.48%) ISO 22301
8 2 (0.48%) ISO 9001
8 2 (0.48%) ISO/IEC 20000
8 2 (0.48%) ISO/IEC 27001
8 2 (0.48%) PCI DSS
8 2 (0.48%) PMO
8 2 (0.48%) SLA
System Software
1 22 (5.28%) Docker
2 19 (4.56%) Active Directory
3 8 (1.92%) VMware Infrastructure
4 6 (1.44%) Virtual Machines
5 5 (1.20%) vSphere
6 4 (0.96%) Embedded Firmware
6 4 (0.96%) Firmware
6 4 (0.96%) Hyper-V
7 3 (0.72%) VirtualBox
8 2 (0.48%) VMware ESXi
9 1 (0.24%) KVM
9 1 (0.24%) Postfix
9 1 (0.24%) VMware Workstation
Systems Management
1 34 (8.15%) Kubernetes
2 18 (4.32%) Terraform
3 9 (2.16%) Grafana
4 7 (1.68%) Ansible
5 4 (0.96%) Prometheus
5 4 (0.96%) SCCM
6 3 (0.72%) Docker Swarm
6 3 (0.72%) Nessus
6 3 (0.72%) Progress Chef
6 3 (0.72%) Puppet
6 3 (0.72%) WSUS
7 2 (0.48%) Single Sign-On
7 2 (0.48%) vCenter Server
8 1 (0.24%) Active Directory Federation Services
8 1 (0.24%) Kibana
8 1 (0.24%) Kubeflow
8 1 (0.24%) logstash
8 1 (0.24%) SCOM
8 1 (0.24%) SolarWinds Orion
8 1 (0.24%) ZABBIX
Vendors
1 58 (13.91%) Microsoft
2 32 (7.67%) Oracle
3 20 (4.80%) Databricks
4 16 (3.84%) Google
4 16 (3.84%) SAP
5 11 (2.64%) VMware
6 9 (2.16%) Cisco
7 7 (1.68%) IBM
8 6 (1.44%) Genesys
8 6 (1.44%) Palo Alto
8 6 (1.44%) Qualys
8 6 (1.44%) Salesforce
8 6 (1.44%) ServiceNow
8 6 (1.44%) Splunk
9 5 (1.20%) Foundry
9 5 (1.20%) Juniper
9 5 (1.20%) Nokia
9 5 (1.20%) Palantir
10 4 (0.96%) Adobe
10 4 (0.96%) ION Trading