Active Directory Contracts with Hybrid/Remote/WFH Options

Microsoft Active Directory
UK > Work from Home

The table below provides summary statistics for remote or hybrid contract work requiring Active Directory skills. It includes a benchmarking guide to the contractor rates offered in vacancies that cited Active Directory over the 6 months leading up to 1 May 2025, comparing them to the same period in the previous two years.

6 months to
1 May 2025
Same period 2024 Same period 2023
Rank 56 42 41
Rank change year-on-year -14 -1 +26
Contract jobs citing Active Directory 381 654 1,308
As % of all contract jobs with a WFH option 3.85% 4.26% 5.06%
As % of the System Software category 32.59% 45.04% 40.79%
Number of daily rates quoted 290 467 966
10th Percentile £225 £178 £200
25th Percentile £388 £319 £313
Median daily rate (50th Percentile) £498 £475 £475
Median % change year-on-year +4.79% - -
75th Percentile £600 £608 £575
90th Percentile £657 £688 £691
UK median daily rate £450 £425 £425
% change year-on-year +5.88% - +3.66%
Number of hourly rates quoted 4 15 36
10th Percentile - - £14.62
25th Percentile £61.50 £15.50 £18.76
Median hourly rate £64.50 £16.00 £54.00
Median % change year-on-year +303.13% -70.37% +151.16%
75th Percentile £66.00 £18.91 £66.00
90th Percentile - £21.85 £86.25
UK median hourly rate £21.46 £17.69 £20.00
% change year-on-year +21.31% -11.55% +14.29%

All System Software Skills
Work from Home

Active Directory falls under the System Software category. For comparison with the information above, the following table provides summary statistics for all contract job vacancies with remote or hybrid options requiring system software skills.

Contract vacancies with a requirement for system software skills 1,169 1,452 3,207
As % of all contract jobs with a WFH option 11.80% 9.46% 12.40%
Number of daily rates quoted 868 1,058 2,296
10th Percentile £358 £263 £300
25th Percentile £425 £405 £425
Median daily rate (50th Percentile) £534 £505 £525
Median % change year-on-year +5.68% -3.84% -
75th Percentile £625 £618 £633
90th Percentile £775 £677 £725
UK median daily rate £525 £488 £525
% change year-on-year +7.69% -7.14% -
Number of hourly rates quoted 12 34 101
10th Percentile £25.25 £15.50 £19.00
25th Percentile £52.44 £15.88 £47.50
Median hourly rate £65.50 £43.32 £65.00
Median % change year-on-year +51.20% -33.35% +165.31%
75th Percentile £79.38 £65.00 £70.25
90th Percentile £92.50 £84.57 £78.00
UK median hourly rate £27.50 £22.50 £53.43
% change year-on-year +22.22% -57.88% +167.13%

Active Directory
Trend for Jobs with a WFH Option

Job vacancies with remote working options citing Active Directory as a proportion of all IT jobs advertised.
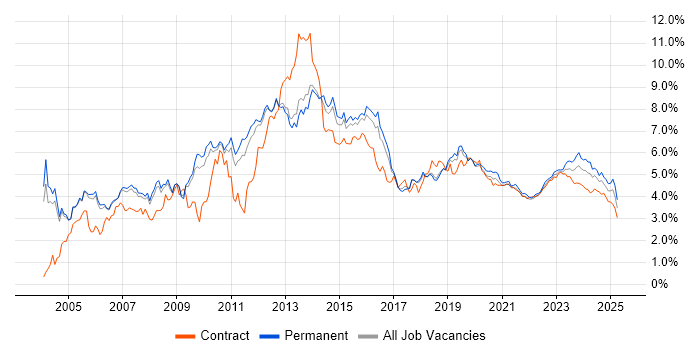
Active Directory trend for jobs with Hybrid/Remote/WFH options

Active Directory
Daily Rate Trend for Jobs with a WFH Option

3-month moving average daily rate quoted in job vacancies with remote working options citing Active Directory.

Active Directory daily rate for jobs with a WFH option

Active Directory
Daily Rate Histogram for Jobs with a WFH Option

Daily rate distribution for jobs with remote working options citing Active Directory over the 6 months to 1 May 2025.

Active Directory daily rate histogram for jobs with a WFH option

Active Directory
Hourly Rate Trend for Jobs with a WFH Option

3-month moving average hourly rate quoted in job vacancies with remote working options citing Active Directory.

Active Directory hourly rate for jobs with a WFH option

Active Directory
Co-occurring Skills and Capabilities with WFH Options by Category

The follow tables expand on the table above by listing co-occurrences grouped by category. The same employment type, locality and period is covered with up to 20 co-occurrences shown in each of the following categories:

Application Platforms
1 71 (18.64%) Microsoft Exchange
2 67 (17.59%) SharePoint
3 10 (2.62%) Confluence
3 10 (2.62%) IIS
4 7 (1.84%) Skype for Business
5 6 (1.57%) JBoss
5 6 (1.57%) WebSphere
6 3 (0.79%) Tomcat
7 1 (0.26%) Apache
7 1 (0.26%) BizTalk Server
7 1 (0.26%) Blackberry Enterprise Server
7 1 (0.26%) CMS
7 1 (0.26%) Exchange Server 2013
Applications
1 34 (8.92%) Microsoft Office
2 5 (1.31%) MS Visio
3 4 (1.05%) Microsoft Excel
3 4 (1.05%) Microsoft PowerPoint
4 1 (0.26%) Chatbot
Business Applications
1 6 (1.57%) Dynamics CRM
2 3 (0.79%) SAP S/4HANA
3 2 (0.52%) Remedy ITSM
3 2 (0.52%) SAP MM
Cloud Services
1 210 (55.12%) Azure
2 159 (41.73%) Entra ID
3 133 (34.91%) Microsoft 365
4 37 (9.71%) AWS
5 27 (7.09%) SaaS
6 19 (4.99%) IaaS
6 19 (4.99%) OneDrive
7 15 (3.94%) GCP
8 13 (3.41%) Power Platform
9 10 (2.62%) Azure DevOps
9 10 (2.62%) PaaS
10 9 (2.36%) Asana
10 9 (2.36%) Slack
11 8 (2.10%) Amazon EC2
11 8 (2.10%) GitHub
12 7 (1.84%) Azure Logic Apps
12 7 (1.84%) Azure Sentinel
12 7 (1.84%) Serverless
13 6 (1.57%) Azure ExpressRoute
13 6 (1.57%) Nutanix
Communications & Networking
1 78 (20.47%) DNS
2 60 (15.75%) DHCP
3 44 (11.55%) Firewall
4 26 (6.82%) VPN
5 16 (4.20%) Skype
6 15 (3.94%) Network Security
7 14 (3.67%) Wi-Fi
8 13 (3.41%) SMTP
8 13 (3.41%) WAN
9 12 (3.15%) LAN
10 10 (2.62%) Remote Desktop
11 9 (2.36%) TCP/IP
12 8 (2.10%) Cisco ISE
12 8 (2.10%) SAN
12 8 (2.10%) Wireless
13 7 (1.84%) SSL
14 6 (1.57%) Internet
14 6 (1.57%) Intrusion Detection
14 6 (1.57%) VLAN
15 5 (1.31%) Unified Communications
Database & Business Intelligence
1 35 (9.19%) SQL Server
2 11 (2.89%) Relational Database
3 8 (2.10%) Oracle Database
4 6 (1.57%) DB2
4 6 (1.57%) Elasticsearch
5 5 (1.31%) Azure SQL Database
5 5 (1.31%) Power BI
5 5 (1.31%) RDBMS
6 3 (0.79%) Amazon RDS
6 3 (0.79%) BigQuery
6 3 (0.79%) Neo4j
6 3 (0.79%) SQL Server Integration Services
7 2 (0.52%) IDMS
7 2 (0.52%) PostgreSQL
8 1 (0.26%) MongoDB
8 1 (0.26%) NoSQL
8 1 (0.26%) Redis
8 1 (0.26%) Sybase ASE
Development Applications
1 23 (6.04%) JIRA
2 10 (2.62%) Git
3 6 (1.57%) SonarQube
4 4 (1.05%) Jenkins
4 4 (1.05%) TeamCity
5 3 (0.79%) Bitbucket Server
5 3 (0.79%) CA Release Automation
5 3 (0.79%) JUnit
5 3 (0.79%) MSI
5 3 (0.79%) Oracle Forms
5 3 (0.79%) Selenium
5 3 (0.79%) Sonatype Nexus
6 1 (0.26%) GitLab
6 1 (0.26%) Moq
6 1 (0.26%) Snyk
General
1 113 (29.66%) Social Skills
2 73 (19.16%) Finance
3 31 (8.14%) Public Sector
4 26 (6.82%) Analytical Skills
5 11 (2.89%) Telecoms
6 9 (2.36%) Inclusion and Diversity
7 8 (2.10%) Documentation Skills
8 7 (1.84%) Banking
8 7 (1.84%) Retail
9 3 (0.79%) Electronics
9 3 (0.79%) German Language
9 3 (0.79%) Law
9 3 (0.79%) Legal
9 3 (0.79%) Local Government
9 3 (0.79%) Manufacturing
9 3 (0.79%) Marketing
10 2 (0.52%) Influencing Skills
10 2 (0.52%) Italian Language
10 2 (0.52%) Organisational Skills
11 1 (0.26%) Aviation
Job Titles
1 60 (15.75%) Architect
2 36 (9.45%) Analyst
2 36 (9.45%) Support Engineer
3 34 (8.92%) Infrastructure Engineer
4 32 (8.40%) Senior
5 29 (7.61%) IT Support
6 21 (5.51%) Microsoft 365 Engineer
7 20 (5.25%) IT Engineer
8 19 (4.99%) Azure Engineer
8 19 (4.99%) Developer
9 18 (4.72%) Active Directory Engineer
10 16 (4.20%) Consultant
10 16 (4.20%) IT Support Engineer
10 16 (4.20%) Service Analyst
10 16 (4.20%) Solutions Architect
11 15 (3.94%) Lead
11 15 (3.94%) Service Desk Analyst
11 15 (3.94%) Windows Engineer
12 13 (3.41%) 2nd Line Engineer
12 13 (3.41%) 2nd Line Support Engineer
Libraries, Frameworks & Software Standards
1 32 (8.40%) LDAP
2 18 (4.72%) SailPoint
3 17 (4.46%) SAML
4 15 (3.94%) .NET
5 14 (3.67%) OAuth
6 13 (3.41%) REST
7 9 (2.36%) AngularJS
8 7 (1.84%) Middleware
8 7 (1.84%) Web Services
9 6 (1.57%) OpenID
9 6 (1.57%) Spring Boot
10 5 (1.31%) ARM Templates
11 4 (1.05%) CSS
11 4 (1.05%) HTML
11 4 (1.05%) Keycloak
11 4 (1.05%) OAuth2
11 4 (1.05%) React
12 3 (0.79%) JSP
12 3 (0.79%) SOAP
12 3 (0.79%) Struts
Miscellaneous
1 29 (7.61%) Onboarding
2 23 (6.04%) PKI
3 20 (5.25%) Data Centre
4 18 (4.72%) Management Information System
5 15 (3.94%) Self-Motivation
6 14 (3.67%) Hybrid Cloud
7 12 (3.15%) Security Posture
8 8 (2.10%) Video Conferencing
9 7 (1.84%) Cloud Native
9 7 (1.84%) Product Ownership
10 6 (1.57%) Enterprise Software
11 5 (1.31%) Clustering
11 5 (1.31%) Data Protection Act
11 5 (1.31%) Driving Licence
11 5 (1.31%) Replication
12 4 (1.05%) Blackberry
12 4 (1.05%) Reinsurance
12 4 (1.05%) Virtual Team
13 3 (0.79%) IVR
13 3 (0.79%) Social Media
Operating Systems
1 197 (51.71%) Windows
2 94 (24.67%) Windows Server
3 54 (14.17%) Linux
4 39 (10.24%) Windows 10
5 20 (5.25%) Windows Server 2016
6 17 (4.46%) Windows Server 2012
7 16 (4.20%) Android
7 16 (4.20%) Apple iOS
7 16 (4.20%) Unix
7 16 (4.20%) Windows Server 2019
8 9 (2.36%) Red Hat Enterprise Linux
9 6 (1.57%) VMS
10 5 (1.31%) Mac OS
11 2 (0.52%) Windows 7
11 2 (0.52%) Windows Server 2003
12 1 (0.26%) CentOS
12 1 (0.26%) Oracle Linux
12 1 (0.26%) Solaris
Processes & Methodologies
1 92 (24.15%) Problem-Solving
2 74 (19.42%) Migration
3 62 (16.27%) Identity Access Management
3 62 (16.27%) ITIL
4 49 (12.86%) Infrastructure Engineering
5 46 (12.07%) RBAC
6 40 (10.50%) DevOps
7 37 (9.71%) Agile
8 32 (8.40%) Identity Management
8 32 (8.40%) ITSM
9 29 (7.61%) Privileged Access Management
10 28 (7.35%) Customer Service
11 25 (6.56%) Roadmaps
12 23 (6.04%) Cloud Security
12 23 (6.04%) Multi-Factor Authentication
13 22 (5.77%) Collaborative Working
14 21 (5.51%) Cybersecurity
15 20 (5.25%) Project Management
15 20 (5.25%) Service Management
16 19 (4.99%) Disaster Recovery
Programming Languages
1 107 (28.08%) PowerShell
2 37 (9.71%) SQL
3 24 (6.30%) Python
4 12 (3.15%) C#
5 10 (2.62%) JavaScript
6 9 (2.36%) Bash
7 7 (1.84%) Bicep
7 7 (1.84%) Java
8 5 (1.31%) Perl
8 5 (1.31%) PL/SQL
8 5 (1.31%) Shell Script
9 4 (1.05%) VBScript
10 3 (0.79%) VBA
11 2 (0.52%) ABAP
11 2 (0.52%) BeanShell
11 2 (0.52%) Ruby
11 2 (0.52%) T-SQL
12 1 (0.26%) C
12 1 (0.26%) TypeScript
12 1 (0.26%) VB
Qualifications
1 77 (20.21%) Security Cleared
2 65 (17.06%) SC Cleared
3 28 (7.35%) Degree
3 28 (7.35%) Microsoft Certification
4 20 (5.25%) Azure Certification
5 12 (3.15%) DV Cleared
6 8 (2.10%) MCSE
7 7 (1.84%) AWS Certification
7 7 (1.84%) CISSP
7 7 (1.84%) Computer Science Degree
8 6 (1.57%) CISM
9 4 (1.05%) BPSS Clearance
9 4 (1.05%) Cisco Certification
10 3 (0.79%) MCSA
10 3 (0.79%) PMI Certification
11 2 (0.52%) CCIE
11 2 (0.52%) CCNA
11 2 (0.52%) CCNP
11 2 (0.52%) CEH
11 2 (0.52%) PMP
Quality Assurance & Compliance
1 22 (5.77%) GDPR
2 16 (4.20%) SLA
3 13 (3.41%) ISO/IEC 27001
3 13 (3.41%) NIST
4 12 (3.15%) Sarbanes-Oxley
5 10 (2.62%) PCI DSS
6 9 (2.36%) HIPAA
7 8 (2.10%) SOC 2
8 5 (1.31%) Accessibility
9 3 (0.79%) Cyber Essentials
9 3 (0.79%) Cyber Essentials PLUS
9 3 (0.79%) GRC
9 3 (0.79%) PMO
9 3 (0.79%) QA
10 2 (0.52%) FIPS 140-2
10 2 (0.52%) NIST 800
11 1 (0.26%) Data Quality
System Software
1 40 (10.50%) VMware Infrastructure
2 22 (5.77%) Hyper-V
2 22 (5.77%) VMware ESXi
3 19 (4.99%) Virtual Machines
4 17 (4.46%) vSphere
5 10 (2.62%) Docker
5 10 (2.62%) Virtual Servers
6 7 (1.84%) Virtual Desktop
7 5 (1.31%) Microsoft Virtual Server
8 4 (1.05%) BitLocker
9 3 (0.79%) DFS Replication
9 3 (0.79%) NFS
9 3 (0.79%) VMware NSX
9 3 (0.79%) XenDesktop
10 2 (0.52%) Firmware
10 2 (0.52%) RACF
10 2 (0.52%) XenApp
11 1 (0.26%) Microsoft App-V
11 1 (0.26%) Terminal Services
11 1 (0.26%) VMware Server
Systems Management
1 66 (17.32%) Microsoft Intune
2 39 (10.24%) Single Sign-On
3 34 (8.92%) SCCM
4 26 (6.82%) Ansible
5 19 (4.99%) Terraform
5 19 (4.99%) WSUS
6 15 (3.94%) Kubernetes
7 12 (3.15%) vCenter Server
8 8 (2.10%) Active Directory Federation Services
9 6 (1.57%) Progress Chef
10 4 (1.05%) FortiGate
10 4 (1.05%) Puppet
11 3 (0.79%) Kibana
11 3 (0.79%) SCOM
12 2 (0.52%) Grafana
12 2 (0.52%) Microsoft Clustering
12 2 (0.52%) NetBackup
12 2 (0.52%) Packer
12 2 (0.52%) Prometheus
12 2 (0.52%) ZABBIX
Vendors
1 222 (58.27%) Microsoft
2 81 (21.26%) VMware
3 32 (8.40%) CyberArk
4 28 (7.35%) ServiceNow
5 26 (6.82%) Cisco
6 20 (5.25%) Oracle
7 12 (3.15%) Citrix
7 12 (3.15%) Palo Alto
8 11 (2.89%) Zscaler
9 9 (2.36%) Apple
10 8 (2.10%) Red Hat
10 8 (2.10%) SAP
10 8 (2.10%) Splunk
11 7 (1.84%) F5
11 7 (1.84%) HP
12 6 (1.57%) BeyondTrust
12 6 (1.57%) Commvault
12 6 (1.57%) Dell
12 6 (1.57%) Google
12 6 (1.57%) Okta