Azure Certification Contracts with Work from Home Options

Microsoft Azure Certification
UK > Work from Home

The following table provides summary statistics for contract job vacancies with an option to work from home (WFH) with a requirement for Azure Certification qualifications. Included is a benchmarking guide to the contractor rates offered over the 6 months to 27 April 2024 with a comparison to the same period in the previous 2 years.

6 months to
27 Apr 2024
Same period 2023 Same period 2022
Rank 258 289 368
Rank change year-on-year +31 +79 -106
Contract jobs citing Azure Certification 86 191 273
As % of all contract jobs with a WFH option 0.56% 0.74% 0.61%
As % of the Qualifications category 2.02% 2.89% 3.08%
Number of daily rates quoted 46 118 188
10th Percentile £338 £413 £413
25th Percentile £453 £475 £484
Median daily rate (50th Percentile) £550 £550 £586
Median % change year-on-year - -6.14% +17.20%
75th Percentile £623 £650 £664
90th Percentile £750 £700 £766
UK median daily rate £550 £550 £600
% change year-on-year - -8.33% +20.00%
Number of hourly rates quoted 0 2 4
Median hourly rate - £51.50 £66.00
Median % change year-on-year - -21.97% -
UK median hourly rate - £51.50 £66.00
% change year-on-year - -21.97% -

All Academic and Professional Certifications
Work from Home

Azure Certification is in the Academic Qualifications and Professional Certifications category. The following table is for comparison with the above and provides summary statistics for all contract job vacancies with a WFH option and a requirement for academic qualifications or professional certifications.

Contract vacancies requiring academic qualifications or professional certifications 4,248 6,609 8,860
As % of all contract jobs with a WFH option 27.81% 25.49% 19.89%
Number of daily rates quoted 2,651 4,438 6,207
10th Percentile £331 £381 £369
25th Percentile £440 £456 £450
Median daily rate (50th Percentile) £525 £550 £535
Median % change year-on-year -4.55% +2.80% +8.08%
75th Percentile £638 £650 £625
90th Percentile £725 £745 £700
UK median daily rate £535 £550 £525
% change year-on-year -2.73% +4.76% +8.25%
Number of hourly rates quoted 259 293 223
10th Percentile £15.66 £20.00 £19.38
25th Percentile £24.25 £42.50 £35.00
Median hourly rate £43.00 £65.00 £48.58
Median % change year-on-year -33.85% +33.80% +21.45%
75th Percentile £65.00 £73.75 £65.38
90th Percentile £85.00 £85.00 £69.75
UK median hourly rate £40.00 £54.00 £41.50
% change year-on-year -25.93% +30.12% +5.06%

Azure Certification
Trend for Jobs with a WFH Option

Job vacancies with a work from home option citing Azure Certification as a proportion of all IT jobs advertised.
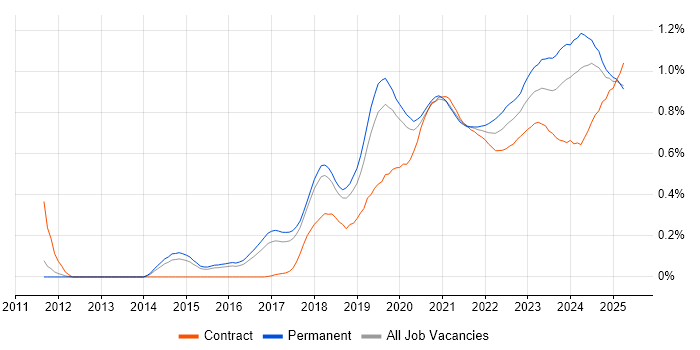
Azure Certification trend for jobs with a WFH option

Azure Certification
Daily Rate Trend for Jobs with a WFH Option

3-month moving average daily rate quoted in job vacancies with a work from home option citing Azure Certification.

Azure Certification daily rate for jobs with a WFH option

Azure Certification
Daily Rate Histogram for Jobs with a WFH Option

Daily rate distribution for jobs with a work from home option citing Azure Certification over the 6 months to 27 April 2024.

Azure Certification daily rate histogram for jobs with a WFH option

Azure Certification
Hourly Rate Trend for Jobs with a WFH Option

3-month moving average hourly rate quoted in job vacancies with a work from home option citing Azure Certification.

Azure Certification hourly rate for jobs with a WFH option

Azure Certification
Co-occurring Skills and Capabilities with WFH Options by Category

The follow tables expand on the table above by listing co-occurrences grouped by category. The same employment type, locality and period is covered with up to 20 co-occurrences shown in each of the following categories:

Application Platforms
1 5 (5.81%) Microsoft Exchange
1 5 (5.81%) SharePoint
2 2 (2.33%) Apache Spark
2 2 (2.33%) IIS
3 1 (1.16%) Apache
3 1 (1.16%) Confluence
3 1 (1.16%) Exchange Server 2007
3 1 (1.16%) Exchange Server 2010
3 1 (1.16%) Umbraco
Applications
1 1 (1.16%) Microsoft Excel
1 1 (1.16%) MS Visio
Business Applications
1 1 (1.16%) Sparx Enterprise Architect
Cloud Services
1 86 (100.00%) Azure
2 23 (26.74%) AWS
3 21 (24.42%) Entra ID
4 19 (22.09%) Microsoft 365
5 14 (16.28%) Azure DevOps
6 12 (13.95%) IaaS
7 9 (10.47%) Azure Data Factory
7 9 (10.47%) Azure Sentinel
7 9 (10.47%) PaaS
7 9 (10.47%) Power Platform
8 7 (8.14%) Azure Synapse Analytics
8 7 (8.14%) Cloud Computing
8 7 (8.14%) Dynamics 365
9 6 (6.98%) Amazon GuardDuty
10 5 (5.81%) GCP
10 5 (5.81%) Serverless
11 4 (4.65%) Mimecast
11 4 (4.65%) Power Automate
11 4 (4.65%) PowerApps
12 3 (3.49%) Azure Service Bus
Communications & Networking
1 11 (12.79%) Firewall
2 7 (8.14%) Network Security
3 2 (2.33%) DNS
3 2 (2.33%) SSL
3 2 (2.33%) Unified Communications
3 2 (2.33%) VPN
4 1 (1.16%) DHCP
4 1 (1.16%) Internet
4 1 (1.16%) Junos
4 1 (1.16%) LAN
4 1 (1.16%) NetScaler
4 1 (1.16%) SDH
4 1 (1.16%) SD-WAN
4 1 (1.16%) WAN
Database & Business Intelligence
1 8 (9.30%) Azure SQL Database
2 6 (6.98%) Amazon RDS
2 6 (6.98%) SQL Server
3 4 (4.65%) Big Data
3 4 (4.65%) Data Warehouse
4 3 (3.49%) Power BI
5 2 (2.33%) Azure SQL Data Warehouse
5 2 (2.33%) Data Lake
5 2 (2.33%) Relational Database
6 1 (1.16%) Delta Lake
6 1 (1.16%) Metadata
6 1 (1.16%) MongoDB
6 1 (1.16%) MySQL
6 1 (1.16%) NoSQL
6 1 (1.16%) PostgreSQL
6 1 (1.16%) RDBMS
6 1 (1.16%) Spark SQL
Development Applications
1 5 (5.81%) Git
2 2 (2.33%) Jenkins
2 2 (2.33%) JIRA
2 2 (2.33%) Visual Studio
3 1 (1.16%) Axure RP
3 1 (1.16%) Bitbucket
3 1 (1.16%) Burp Suite
3 1 (1.16%) Moq
3 1 (1.16%) Postman
3 1 (1.16%) Selenium
3 1 (1.16%) SoapUI
3 1 (1.16%) SonarQube
3 1 (1.16%) SpecFlow
General
1 28 (32.56%) Social Skills
2 11 (12.79%) Finance
3 8 (9.30%) Analytical Skills
3 8 (9.30%) Public Sector
4 5 (5.81%) Manufacturing
4 5 (5.81%) Telecoms
5 4 (4.65%) Banking
5 4 (4.65%) Documentation Skills
5 4 (4.65%) Inclusion and Diversity
5 4 (4.65%) Presentation Skills
6 3 (3.49%) Electronics
6 3 (3.49%) Marketing
7 2 (2.33%) Billing
7 2 (2.33%) Law
8 1 (1.16%) Organisational Skills
Job Titles
1 20 (23.26%) Architect
1 20 (23.26%) Azure Engineer
2 17 (19.77%) Cloud Engineer
3 8 (9.30%) Developer
4 7 (8.14%) Azure Architect
4 7 (8.14%) DevOps Engineer
5 6 (6.98%) Azure DevOps Engineer
6 5 (5.81%) Azure Specialist
7 4 (4.65%) AWS Specialist
7 4 (4.65%) Cloud Architect
7 4 (4.65%) Data Engineer
7 4 (4.65%) Power Platform Developer
7 4 (4.65%) Security Engineer
7 4 (4.65%) Solutions Architect
7 4 (4.65%) Support Engineer
8 3 (3.49%) Administrator
8 3 (3.49%) Security Architect
8 3 (3.49%) SQL DBA
8 3 (3.49%) Technical Support
8 3 (3.49%) Technical Support Engineer
Libraries, Frameworks & Software Standards
1 5 (5.81%) .NET
2 3 (3.49%) .NET Core
2 3 (3.49%) ARM Templates
3 2 (2.33%) CSS
3 2 (2.33%) Hugging Face
3 2 (2.33%) LangChain
3 2 (2.33%) PyTorch
3 2 (2.33%) REST
3 2 (2.33%) RESTful
4 1 (1.16%) ASP.NET
4 1 (1.16%) ASP.NET MVC
4 1 (1.16%) Entity Framework
4 1 (1.16%) JSON
4 1 (1.16%) Middleware
4 1 (1.16%) Node.js
4 1 (1.16%) OAuth
4 1 (1.16%) OAuth2
4 1 (1.16%) React
4 1 (1.16%) Web Services
4 1 (1.16%) YAML
Miscellaneous
1 6 (6.98%) Data Centre
2 4 (4.65%) Security Posture
3 3 (3.49%) Management Information System
3 3 (3.49%) Onboarding
3 3 (3.49%) PKI
4 2 (2.33%) Clustering
4 2 (2.33%) Distributed Computing
4 2 (2.33%) Grid Computing
4 2 (2.33%) Low-Code
4 2 (2.33%) Public Cloud
4 2 (2.33%) Security Operations Centre
4 2 (2.33%) Self-Motivation
4 2 (2.33%) Tandem
5 1 (1.16%) Cloud Native
5 1 (1.16%) Cyber Security Posture
5 1 (1.16%) Enterprise Cloud
5 1 (1.16%) FMCG
5 1 (1.16%) Greenfield Project
5 1 (1.16%) Hybrid Cloud
5 1 (1.16%) Legacy Applications
Operating Systems
1 11 (12.79%) Windows
2 2 (2.33%) Linux
2 2 (2.33%) Unix
2 2 (2.33%) Windows Server
3 1 (1.16%) Red Hat Enterprise Linux
3 1 (1.16%) zOS
Processes & Methodologies
1 25 (29.07%) DevOps
2 19 (22.09%) Migration
3 16 (18.60%) Problem-Solving
4 14 (16.28%) Agile
5 10 (11.63%) Computer Science
5 10 (11.63%) Cost Optimisation
5 10 (11.63%) Cybersecurity
5 10 (11.63%) DevSecOps
5 10 (11.63%) ITIL
6 9 (10.47%) Infrastructure as Code
7 8 (9.30%) Analytics
7 8 (9.30%) Infrastructure Engineering
8 7 (8.14%) Business Intelligence
8 7 (8.14%) Cloud Operations
8 7 (8.14%) Cloud Security
8 7 (8.14%) TOGAF
9 6 (6.98%) Capacity Planning
9 6 (6.98%) CI/CD
9 6 (6.98%) Containerisation
9 6 (6.98%) Cost Control
Programming Languages
1 20 (23.26%) SQL
2 15 (17.44%) PowerShell
3 10 (11.63%) Python
4 7 (8.14%) C#
5 5 (5.81%) Kusto Query Language
6 4 (4.65%) JavaScript
7 3 (3.49%) Bicep
7 3 (3.49%) Scala
8 2 (2.33%) Bash
8 2 (2.33%) Java
8 2 (2.33%) PHP
9 1 (1.16%) Ruby
9 1 (1.16%) VB
9 1 (1.16%) VBScript
Qualifications
1 20 (23.26%) Degree
2 17 (19.77%) Security Cleared
3 16 (18.60%) SC Cleared
4 13 (15.12%) Microsoft Certification
5 11 (12.79%) AWS Certification
6 9 (10.47%) Computer Science Degree
7 7 (8.14%) AWS Certified Cloud Practitioner
8 4 (4.65%) CISSP
8 4 (4.65%) CompTIA Security+
8 4 (4.65%) DV Cleared
8 4 (4.65%) TOGAF Certification
9 3 (3.49%) BPSS Clearance
10 2 (2.33%) ITIL Foundation Certificate
10 2 (2.33%) Network+ Certification
11 1 (1.16%) CISA
11 1 (1.16%) Cisco Certification
11 1 (1.16%) CISM
11 1 (1.16%) HP ASE
11 1 (1.16%) JNCIA
11 1 (1.16%) Server+ Certification
Quality Assurance & Compliance
1 2 (2.33%) ISO/IEC 27001
2 1 (1.16%) Accessibility
2 1 (1.16%) Data Quality
2 1 (1.16%) NCSC
2 1 (1.16%) NIST
2 1 (1.16%) WCAG
System Software
1 20 (23.26%) Active Directory
2 13 (15.12%) Docker
3 10 (11.63%) Hyper-V
4 5 (5.81%) VMware Infrastructure
5 4 (4.65%) Virtual Machines
6 3 (3.49%) Virtual Desktop
7 1 (1.16%) VMware ESXi
7 1 (1.16%) vSphere
7 1 (1.16%) XenApp
7 1 (1.16%) XenDesktop
Systems Management
1 20 (23.26%) Terraform
2 15 (17.44%) Kubernetes
3 8 (9.30%) Microsoft Intune
4 3 (3.49%) WSUS
5 2 (2.33%) Active Directory Federation Services
5 2 (2.33%) Ansible
5 2 (2.33%) Nagios
5 2 (2.33%) Single Sign-On
6 1 (1.16%) Grafana
6 1 (1.16%) Graylog
6 1 (1.16%) Prometheus
6 1 (1.16%) SCCM
6 1 (1.16%) SCOM
6 1 (1.16%) ZABBIX
Vendors
1 54 (62.79%) Microsoft
2 16 (18.60%) VMware
3 8 (9.30%) Oracle
4 7 (8.14%) Citrix
5 6 (6.98%) Databricks
6 3 (3.49%) Cisco
6 3 (3.49%) SAP
7 2 (2.33%) Juniper
7 2 (2.33%) SolarWinds
8 1 (1.16%) Ciena
8 1 (1.16%) EMC
8 1 (1.16%) Facebook
8 1 (1.16%) Google
8 1 (1.16%) Instagram
8 1 (1.16%) IronPort
8 1 (1.16%) Nokia
8 1 (1.16%) Palo Alto
8 1 (1.16%) Red Hat
8 1 (1.16%) Sparx
8 1 (1.16%) Splunk