Hybrid/Remote Cloud Native Contract Job Trends

Cloud Native
UK > Work from Home

The table below looks at the prevalence of the term Cloud Native in remote or hybrid contract work. Included is a benchmarking guide to the contractor rates offered in vacancies that cited Cloud Native over the 6 months leading up to 6 October 2026, comparing them to the same period in the previous two years.

6 months to
6 Oct 2026
Same period 2025 Same period 2024
Rank 43 86 201
Rank change year-on-year +43 +115 +30
Contract jobs citing Cloud Native 679 281 119
As % of all contract jobs with remote/hybrid work options 5.02% 2.92% 0.96%
As % of the Miscellaneous category 12.99% 8.24% 3.14%
Number of daily rates quoted 471 176 80
10th Percentile £413 £400 £442
25th Percentile £463 £447 £493
Median daily rate (50th Percentile) £555 £525 £600
Median % change year-on-year +5.71% -12.50% -4.00%
75th Percentile £650 £650 £708
90th Percentile £738 £750 £753
UK median daily rate £550 £525 £575
% change year-on-year +4.76% -8.70% -8.00%
Number of hourly rates quoted 26 0 2
10th Percentile £65.00 - -
25th Percentile £73.75 - £77.50
Median hourly rate £77.00 - £85.00
75th Percentile £81.25 - £92.50
90th Percentile - - -
UK median hourly rate £75.00 £62.50 £85.00
% change year-on-year +20.00% -26.47% +12.58%

All Generic Skills
Work from Home

Cloud Native falls under the General and Transferable Skills category. For comparison with the information above, the following table provides summary statistics for all contract job vacancies with remote or hybrid options requiring generic IT skills.

Contract vacancies with a requirement for generic IT skills 5,229 3,409 3,788
As % of all contract jobs with a WFH option 38.65% 35.45% 30.54%
Number of daily rates quoted 3,153 2,196 2,437
10th Percentile £364 £331 £325
25th Percentile £440 £413 £425
Median daily rate (50th Percentile) £525 £525 £550
Median % change year-on-year - -4.55% -
75th Percentile £638 £649 £688
90th Percentile £745 £800 £850
UK median daily rate £525 £518 £526
% change year-on-year +1.38% -1.55% -4.36%
Number of hourly rates quoted 391 112 86
10th Percentile £16.70 £14.78 £20.50
25th Percentile £31.25 £24.45 £31.26
Median hourly rate £43.96 £43.50 £64.25
Median % change year-on-year +1.06% -32.30% +22.38%
75th Percentile £70.00 £65.00 £72.50
90th Percentile £81.25 £70.16 £85.00
UK median hourly rate £37.50 £28.13 £47.50
% change year-on-year +33.33% -40.79% +5.56%

Cloud Native
Job Vacancy Trend for Remote/Hybrid Jobs

Historical trend showing the proportion of contract IT job postings citing Cloud Native and offering remote or hybrid work options relative to all contract IT jobs advertised.

Cloud Native job vacancy trend for remote/hybrid jobs

Cloud Native
Daily Rate Trend for Remote/Hybrid Jobs

Contractor daily rate distribution trend for jobs with remote/hybrid work options citing Cloud Native.
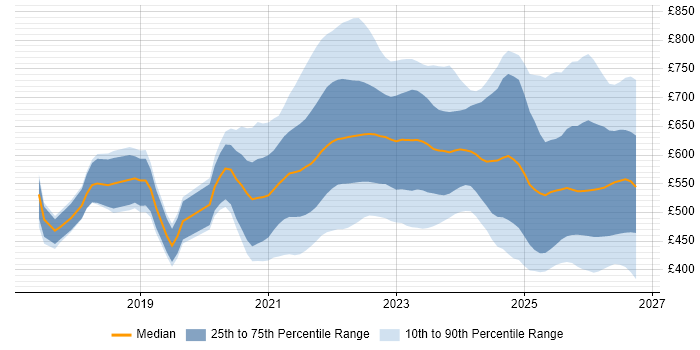
Contractor daily rate distribution trend for jobs with remote/hybrid work options citing Cloud Native

Cloud Native
Daily Rate Histogram for Remote/Hybrid Jobs

Daily rate distribution for jobs with remote/hybrid work options citing Cloud Native over the 6 months to 6 October 2026.

Cloud Native daily rate histogram for jobs with remote/hybrid work options

Cloud Native
Hourly Rate Trend for Remote/Hybrid Jobs

Contractor hourly rate distribution trend for jobs with remote/hybrid work options citing Cloud Native.
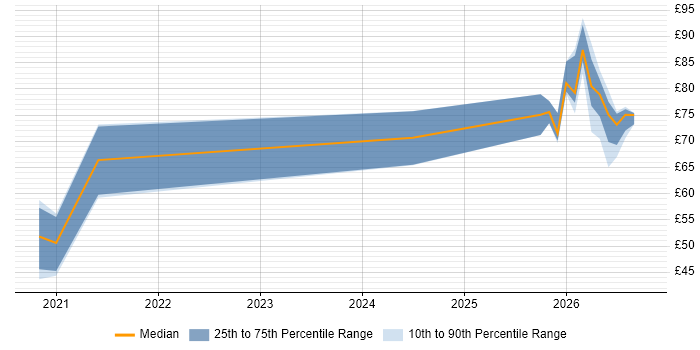
Contractor hourly rate distribution trend for jobs with remote/hybrid work options citing Cloud Native

Cloud Native
Hourly Rate Histogram for Remote/Hybrid Jobs

Hourly rate distribution for jobs with remote working options citing Cloud Native over the 6 months to 6 October 2026.

Cloud Native hourly rate histogram for jobs with remote/hybrid working options

Cloud Native
Co-Occurring Skills & Capabilities in Remote/Hybrid Jobs by Category

The following tables expand on the one above by listing co-occurrences grouped by category. They cover the same employment type, locality and period, with up to 20 co-occurrences shown in each category:

Application Platforms
1 29 (4.27%) Apache Airflow
2 26 (3.83%) Apache Spark
3 21 (3.09%) Confluence
4 19 (2.80%) Apache
5 12 (1.77%) SAS
6 9 (1.33%) Jupyter
7 8 (1.18%) SharePoint
8 4 (0.59%) CMS
8 4 (0.59%) nginx
9 2 (0.29%) Camunda
9 2 (0.29%) Ethereum
9 2 (0.29%) Hyperledger
9 2 (0.29%) OpenStack
10 1 (0.15%) Adobe Experience Manager
10 1 (0.15%) Apache Superset
10 1 (0.15%) Appian
10 1 (0.15%) GeoServer
10 1 (0.15%) Mendix
10 1 (0.15%) Oracle Workflow
10 1 (0.15%) WebSphere
Applications
1 1 (0.15%) Microsoft PowerPoint
Business Applications
1 4 (0.59%) Dynamics CRM
1 4 (0.59%) Payment Gateway
1 4 (0.59%) SAP S/4HANA
2 2 (0.29%) Quorum
2 2 (0.29%) R3 Corda
2 2 (0.29%) Ripple
3 1 (0.15%) Dynamics NAV
3 1 (0.15%) Oracle EBS
3 1 (0.15%) SAP Forecasting and Replenishment
3 1 (0.15%) Sparx Enterprise Architect
3 1 (0.15%) Temenos T24
3 1 (0.15%) Workfront
Cloud Services
1 417 (61.41%) AWS
2 297 (43.74%) Azure
3 148 (21.80%) GCP
4 119 (17.53%) GitHub
5 116 (17.08%) Serverless
6 83 (12.22%) GitHub Actions
7 74 (10.90%) Amazon S3
8 69 (10.16%) AWS Lambda
9 64 (9.43%) Azure DevOps
10 50 (7.36%) Amazon EKS
11 49 (7.22%) AWS CloudFormation
12 48 (7.07%) Amazon CloudWatch
13 37 (5.45%) Amazon ECS
14 34 (5.01%) Amazon SQS
14 34 (5.01%) SaaS
15 32 (4.71%) Google Kubernetes Engine
16 30 (4.42%) Azure AKS
17 27 (3.98%) Amazon EC2
17 27 (3.98%) Snowflake
18 26 (3.83%) Power Platform
Communications & Networking
1 31 (4.57%) Firewall
2 17 (2.50%) Network Security
3 16 (2.36%) DNS
4 11 (1.62%) BIG-IP
4 11 (1.62%) F5 BIG-IP LTM
5 9 (1.33%) VPN
6 7 (1.03%) BGP
6 7 (1.03%) TCP/IP
7 6 (0.88%) 5G
7 6 (0.88%) Ethernet VPN
7 6 (0.88%) OSPF
7 6 (0.88%) SD-WAN
7 6 (0.88%) VLAN
7 6 (0.88%) VXLAN
7 6 (0.88%) WAN
8 5 (0.74%) 4G
8 5 (0.74%) F5 BIG-IP GTM
8 5 (0.74%) SSH
8 5 (0.74%) Wi-Fi
8 5 (0.74%) WLAN
Database & Business Intelligence
1 62 (9.13%) PostgreSQL
2 29 (4.27%) Amazon RDS
3 28 (4.12%) Data Lake
4 27 (3.98%) NoSQL
5 26 (3.83%) DynamoDB
5 26 (3.83%) MongoDB
6 23 (3.39%) Data Warehouse
6 23 (3.39%) Power BI
7 20 (2.95%) Azure SQL Database
7 20 (2.95%) Metadata
7 20 (2.95%) SQL Server
8 16 (2.36%) Relational Database
9 14 (2.06%) Big Data
10 13 (1.91%) Elasticsearch
11 12 (1.77%) Amazon Athena
11 12 (1.77%) BigQuery
11 12 (1.77%) MySQL
12 9 (1.33%) Amazon Redshift
13 7 (1.03%) Amazon Aurora
13 7 (1.03%) Geospatial Data
Development Applications
1 94 (13.84%) GitLab
2 85 (12.52%) Jenkins
3 81 (11.93%) Git
4 37 (5.45%) JIRA
5 14 (2.06%) JMeter
6 13 (1.91%) Postman
7 11 (1.62%) Maven
8 10 (1.47%) Claude Code
8 10 (1.47%) SpecFlow
9 9 (1.33%) Cypress.io
9 9 (1.33%) SonarQube
10 8 (1.18%) JUnit
10 8 (1.18%) Mockito
11 7 (1.03%) Selenium
12 6 (0.88%) Cucumber
13 5 (0.74%) MLflow
14 4 (0.59%) Burp Suite
14 4 (0.59%) REST Assured
15 3 (0.44%) Gradle
15 3 (0.44%) NeoLoad
General
1 171 (25.18%) Social Skills
2 151 (22.24%) Public Sector
3 125 (18.41%) Finance
4 51 (7.51%) Banking
5 38 (5.60%) Analytical Skills
6 15 (2.21%) Retail
7 13 (1.91%) Influencing Skills
8 12 (1.77%) Military
9 9 (1.33%) Pharmaceutical
9 9 (1.33%) Telecoms
10 8 (1.18%) Documentation Skills
11 7 (1.03%) Front Office
11 7 (1.03%) Marketing
12 6 (0.88%) Billing
12 6 (0.88%) Financial Institution
12 6 (0.88%) Health Technology
12 6 (0.88%) Inclusion and Diversity
12 6 (0.88%) Legal
12 6 (0.88%) Publishing
13 4 (0.59%) Police
Job Titles
1 153 (22.53%) Architect
2 128 (18.85%) Senior
3 108 (15.91%) Developer
4 75 (11.05%) DevOps Engineer
5 51 (7.51%) Lead
6 50 (7.36%) AWS Engineer
7 49 (7.22%) Software Engineer
8 47 (6.92%) Cloud Engineer
9 46 (6.77%) Data Engineer
9 46 (6.77%) Solutions Architect
10 38 (5.60%) Platform Engineer
11 33 (4.86%) Azure Engineer
12 30 (4.42%) Technical Architect
13 26 (3.83%) GCP Engineer
14 25 (3.68%) Artificial Intelligence Engineer
15 23 (3.39%) Cloud Architect
15 23 (3.39%) Python Engineer
16 22 (3.24%) Security Engineer
17 21 (3.09%) Cloud Platform Engineer
17 21 (3.09%) Security Architect
Libraries, Frameworks & Software Standards
1 242 (35.64%) Terraform
2 99 (14.58%) REST
3 72 (10.60%) Kafka
4 62 (9.13%) RESTful
5 56 (8.25%) Spring
6 53 (7.81%) .NET
6 53 (7.81%) React
7 51 (7.51%) Spring Boot
8 49 (7.22%) Node.js
9 31 (4.57%) OAuth
10 30 (4.42%) OpenID
11 29 (4.27%) FastAPI
12 27 (3.98%) OAuth2
13 25 (3.68%) AngularJS
14 22 (3.24%) PySpark
15 19 (2.80%) .NET Core
15 19 (2.80%) Swagger
16 17 (2.50%) Flask
16 17 (2.50%) Next.js
16 17 (2.50%) Vue
Miscellaneous
1 95 (13.99%) Distributed Systems
2 44 (6.48%) Product Ownership
3 42 (6.19%) Enterprise Software
4 36 (5.30%) AI Agents
5 31 (4.57%) Onboarding
6 28 (4.12%) Security Posture
7 23 (3.39%) Enterprise Cloud
8 21 (3.09%) Hybrid Cloud
8 21 (3.09%) Legacy Systems
9 20 (2.95%) Data Centre
9 20 (2.95%) Public Cloud
10 19 (2.80%) Management Information System
11 10 (1.47%) Cloud Security Posture
11 10 (1.47%) Linux Command Line
11 10 (1.47%) Virtual Team
12 9 (1.33%) Data Structures
12 9 (1.33%) Legacy Applications
12 9 (1.33%) Life Science
12 9 (1.33%) Mainframe
12 9 (1.33%) PKI
Operating Systems
1 54 (7.95%) Linux
2 19 (2.80%) Windows
3 13 (1.91%) Red Hat Enterprise Linux
4 8 (1.18%) Unix
5 6 (0.88%) VMS
6 4 (0.59%) Ubuntu
6 4 (0.59%) Windows Server
7 1 (0.15%) Alpine Linux
7 1 (0.15%) Android
7 1 (0.15%) CentOS
7 1 (0.15%) Data ONTAP
7 1 (0.15%) Solaris
7 1 (0.15%) Windows Server 2008
7 1 (0.15%) Windows Server 2019
Processes & Methodologies
1 456 (67.16%) CI/CD
2 341 (50.22%) DevOps
3 270 (39.76%) Infrastructure as Code
4 235 (34.61%) Agile
5 205 (30.19%) Containerisation
6 177 (26.07%) Observability
7 166 (24.45%) AI
8 156 (22.97%) Microservices
9 153 (22.53%) Event-Driven
10 150 (22.09%) Software Engineering
11 128 (18.85%) Technical Leadership
12 122 (17.97%) Test Automation
13 120 (17.67%) Platform Engineering
14 108 (15.91%) Stakeholder Management
15 104 (15.32%) Event-Driven Architecture
16 101 (14.87%) Migration
17 97 (14.29%) Continuous Improvement
18 86 (12.67%) Cloud Security
19 84 (12.37%) Roadmaps
20 81 (11.93%) Analytics
Programming Languages
1 275 (40.50%) Python
2 133 (19.59%) Java
3 116 (17.08%) SQL
4 72 (10.60%) Bash
5 65 (9.57%) TypeScript
6 56 (8.25%) PowerShell
7 43 (6.33%) C#
8 41 (6.04%) JavaScript
9 24 (3.53%) Go
10 19 (2.80%) Bicep
11 13 (1.91%) Rust
12 12 (1.77%) Kotlin
13 11 (1.62%) C++
13 11 (1.62%) Scala
14 10 (1.47%) Shell Script
15 7 (1.03%) Korn
16 5 (0.74%) ActionScript
17 4 (0.59%) Groovy
17 4 (0.59%) Kusto Query Language
17 4 (0.59%) Ruby
Qualifications
1 208 (30.63%) Security Cleared
2 188 (27.69%) SC Cleared
3 51 (7.51%) AWS Certification
4 50 (7.36%) Azure Certification
5 32 (4.71%) Degree
6 28 (4.12%) BPSS Clearance
7 27 (3.98%) CISSP
8 22 (3.24%) Computer Science Degree
9 20 (2.95%) DV Cleared
10 14 (2.06%) AWS Certified Solutions Architect
11 12 (1.77%) Cisco Certification
12 11 (1.62%) (ISC)2 CCSP
13 9 (1.33%) CISM
13 9 (1.33%) Microsoft Certification
14 7 (1.03%) CCSP
15 6 (0.88%) CREST Certified
16 5 (0.74%) CHECK Team Leader
16 5 (0.74%) DBS Check
17 4 (0.59%) CRISC
17 4 (0.59%) OSCP
Quality Assurance & Compliance
1 43 (6.33%) Data Quality
2 26 (3.83%) ISO/IEC 27001
3 25 (3.68%) NIST
4 22 (3.24%) QA
5 14 (2.06%) Accessibility
5 14 (2.06%) GDPR
6 12 (1.77%) NCSC
7 9 (1.33%) PCI DSS
8 7 (1.03%) GRC
9 5 (0.74%) SOC 2
10 4 (0.59%) PSD2
11 3 (0.44%) EU AI Act
11 3 (0.44%) ISO 20022
11 3 (0.44%) WCAG
12 2 (0.29%) Cyber Essentials
12 2 (0.29%) Government Security Classifications
12 2 (0.29%) HIPAA
12 2 (0.29%) ISO/IEC 42001
12 2 (0.29%) Sarbanes-Oxley
12 2 (0.29%) SEPA
System Software
1 185 (27.25%) Docker
2 10 (1.47%) Active Directory
3 8 (1.18%) VMware Infrastructure
4 6 (0.88%) Virtual Machines
5 2 (0.29%) Ceph
5 2 (0.29%) VMware NSX
6 1 (0.15%) EMC RecoverPoint
6 1 (0.15%) Hyper-V
6 1 (0.15%) NFS
6 1 (0.15%) SRDF
6 1 (0.15%) Virtual Desktop
6 1 (0.15%) VMware ESXi
6 1 (0.15%) vSphere
Systems Management
1 279 (41.09%) Kubernetes
2 64 (9.43%) Grafana
3 56 (8.25%) Ansible
4 47 (6.92%) Prometheus
5 22 (3.24%) Argo
6 9 (1.33%) Progress Chef
6 9 (1.33%) Single Sign-On
7 8 (1.18%) Istio
8 7 (1.03%) Kustomize
9 6 (0.88%) Cilium
10 5 (0.74%) Puppet
11 4 (0.59%) Kibana
12 3 (0.44%) Podman
13 2 (0.29%) Control-M
13 2 (0.29%) HP Fortify
13 2 (0.29%) Karpenter
14 1 (0.15%) EMC NetWorker
14 1 (0.15%) Nessus
14 1 (0.15%) NetBackup
14 1 (0.15%) Nmap
Vendors
1 104 (15.32%) Microsoft
2 65 (9.57%) Google
3 55 (8.10%) Databricks
4 25 (3.68%) Oracle
5 17 (2.50%) Dynatrace
6 16 (2.36%) Splunk
7 15 (2.21%) ServiceNow
8 12 (1.77%) CrowdStrike
8 12 (1.77%) Red Hat
8 12 (1.77%) SAP
9 11 (1.62%) CyberArk
9 11 (1.62%) F5
9 11 (1.62%) Salesforce
10 10 (1.47%) Palo Alto
11 9 (1.33%) OpenAI
12 8 (1.18%) VMware
13 7 (1.03%) Denodo
13 7 (1.03%) Informatica
14 6 (0.88%) Cisco
14 6 (0.88%) Confluent