Product Ownership Contracts with Hybrid/Remote/WFH Options

Product Ownership
UK > Work from Home

The table below looks at the prevalence of the term Product Ownership in remote or hybrid contract work. Included is a benchmarking guide to the contractor rates offered in vacancies that cited Product Ownership over the 6 months leading up to 1 May 2025, comparing them to the same period in the previous two years.

6 months to
1 May 2025
Same period 2024 Same period 2023
Rank 78 96 70
Rank change year-on-year +18 -26 -14
Contract jobs citing Product Ownership 305 346 838
As % of all contract jobs with a WFH option 3.08% 2.25% 3.24%
As % of the Miscellaneous category 9.32% 7.85% 10.30%
Number of daily rates quoted 221 225 596
10th Percentile £345 £410 £428
25th Percentile £408 £463 £500
Median daily rate (50th Percentile) £500 £540 £570
Median % change year-on-year -7.41% -5.26% +3.64%
75th Percentile £673 £650 £650
90th Percentile £875 £748 £750
UK median daily rate £525 £550 £563
% change year-on-year -4.55% -2.22% +2.27%
Number of hourly rates quoted 6 4 17
10th Percentile £44.51 £58.38 £49.50
25th Percentile £45.63 £69.06 £61.50
Median hourly rate £56.75 £80.00 £85.00
Median % change year-on-year -29.06% -5.88% +70.00%
75th Percentile £67.50 £86.25 -
90th Percentile £82.49 £88.50 £86.65
UK median hourly rate £56.75 £57.44 £80.00
% change year-on-year -1.20% -28.20% +60.00%

All Generic Skills
Work from Home

Product Ownership falls under the General and Transferable Skills category. For comparison with the information above, the following table provides summary statistics for all contract job vacancies with remote or hybrid options requiring generic IT skills.

Contract vacancies with a requirement for generic IT skills 3,272 4,408 8,138
As % of all contract jobs with a WFH option 33.03% 28.73% 31.47%
Number of daily rates quoted 2,222 2,974 5,725
10th Percentile £350 £325 £363
25th Percentile £425 £431 £454
Median daily rate (50th Percentile) £545 £550 £550
Median % change year-on-year -0.91% - +2.33%
75th Percentile £680 £675 £688
90th Percentile £825 £800 £800
UK median daily rate £525 £538 £550
% change year-on-year -2.33% -2.27% -
Number of hourly rates quoted 76 199 151
10th Percentile £18.75 £15.48 £19.00
25th Percentile £26.25 £25.50 £31.38
Median hourly rate £41.75 £51.00 £57.50
Median % change year-on-year -18.14% -11.30% +29.21%
75th Percentile £64.57 £65.02 £70.00
90th Percentile £78.13 £72.50 £85.00
UK median hourly rate £32.05 £30.00 £22.49
% change year-on-year +6.83% +33.42% -18.24%

Product Ownership
Trend for Jobs with a WFH Option

Job vacancies with remote working options citing Product Ownership as a proportion of all IT jobs advertised.
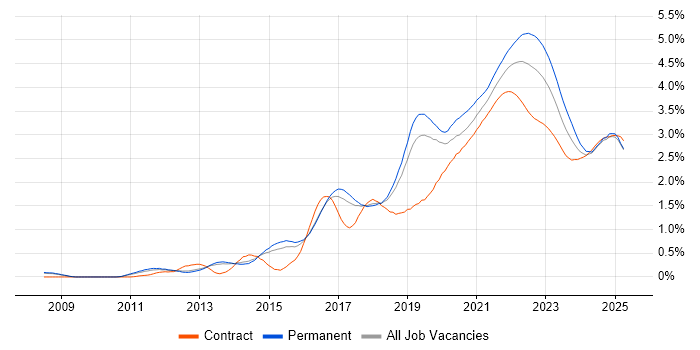
Product Ownership trend for jobs with Hybrid/Remote/WFH options

Product Ownership
Daily Rate Trend for Jobs with a WFH Option

3-month moving average daily rate quoted in job vacancies with remote working options citing Product Ownership.

Product Ownership daily rate for jobs with a WFH option

Product Ownership
Daily Rate Histogram for Jobs with a WFH Option

Daily rate distribution for jobs with remote working options citing Product Ownership over the 6 months to 1 May 2025.

Product Ownership daily rate histogram for jobs with a WFH option

Product Ownership
Hourly Rate Trend for Jobs with a WFH Option

3-month moving average hourly rate quoted in job vacancies with remote working options citing Product Ownership.

Product Ownership hourly rate for jobs with a WFH option

Product Ownership
Hourly Rate Histogram for Jobs with a WFH Option

Hourly rate distribution for jobs with remote working options citing Product Ownership over the 6 months to 1 May 2025.

Product Ownership hourly rate histogram for jobs with a WFH option

Product Ownership
Co-occurring Skills and Capabilities with WFH Options by Category

The follow tables expand on the table above by listing co-occurrences grouped by category. The same employment type, locality and period is covered with up to 20 co-occurrences shown in each of the following categories:

Application Platforms
1 34 (11.15%) Confluence
2 3 (0.98%) CMS
3 2 (0.66%) Apache Airflow
4 1 (0.33%) Camunda
4 1 (0.33%) SharePoint
Applications
1 8 (2.62%) Trello
2 5 (1.64%) MS Visio
3 3 (0.98%) Microsoft Excel
4 2 (0.66%) Adobe XD
4 2 (0.66%) Microsoft Office
5 1 (0.33%) InVision
5 1 (0.33%) Microsoft PowerPoint
5 1 (0.33%) Microsoft Project
5 1 (0.33%) Sketch
5 1 (0.33%) UserZoom
Business Applications
1 4 (1.31%) Dynamics CRM
2 3 (0.98%) Payment Gateway
3 2 (0.66%) SAP IBP
3 2 (0.66%) SAP S/4HANA
4 1 (0.33%) Fidessa
4 1 (0.33%) Oracle EBS
4 1 (0.33%) Primavera
4 1 (0.33%) Salesforce CRM
4 1 (0.33%) Sparx Enterprise Architect
Cloud Services
1 67 (21.97%) Azure
2 38 (12.46%) Azure DevOps
3 37 (12.13%) AWS
4 10 (3.28%) GCP
4 10 (3.28%) Serverless
5 8 (2.62%) Figma
6 6 (1.97%) Cloud Computing
6 6 (1.97%) GitHub
6 6 (1.97%) SaaS
7 5 (1.64%) Azure Functions
7 5 (1.64%) Entra ID
7 5 (1.64%) Miro
8 4 (1.31%) Apigee
8 4 (1.31%) Datadog
8 4 (1.31%) Dynamics 365
8 4 (1.31%) GitHub Actions
9 3 (0.98%) AWS Lambda
9 3 (0.98%) dbt
9 3 (0.98%) Salesforce Service Cloud
9 3 (0.98%) Snowflake
Communications & Networking
1 3 (0.98%) Firewall
2 2 (0.66%) HTTP
2 2 (0.66%) Network Security
2 2 (0.66%) POP3
2 2 (0.66%) SMTP
3 1 (0.33%) Converged Networks
3 1 (0.33%) DHCP
3 1 (0.33%) DNS
3 1 (0.33%) LAN
3 1 (0.33%) MQTT
3 1 (0.33%) SSL
3 1 (0.33%) WAN
Database & Business Intelligence
1 39 (12.79%) Data Lake
2 10 (3.28%) Data Warehouse
3 9 (2.95%) SQL Server
4 8 (2.62%) MongoDB
4 8 (2.62%) NoSQL
5 7 (2.30%) Relational Database
6 4 (1.31%) CockroachDB
7 2 (0.66%) Amazon Redshift
7 2 (0.66%) Azure SQL Database
7 2 (0.66%) Big Data
7 2 (0.66%) Data Vault
7 2 (0.66%) MySQL
7 2 (0.66%) Oracle Reports
7 2 (0.66%) PostgreSQL
7 2 (0.66%) Redis
7 2 (0.66%) Tableau
8 1 (0.33%) Couchbase
8 1 (0.33%) GIS
8 1 (0.33%) RDBMS
8 1 (0.33%) SQL Server Reporting Services
Development Applications
1 54 (17.70%) JIRA
2 15 (4.92%) Jenkins
3 12 (3.93%) Git
4 7 (2.30%) REST Assured
5 6 (1.97%) Cypress.io
6 5 (1.64%) Ant
6 5 (1.64%) Maven
6 5 (1.64%) Subversion
6 5 (1.64%) Visual Studio
7 4 (1.31%) GitLab
8 3 (0.98%) Postman
8 3 (0.98%) Visual Studio Code
9 2 (0.66%) Atlassian Bamboo
9 2 (0.66%) Axure RP
9 2 (0.66%) Selenium
9 2 (0.66%) TestRail
10 1 (0.33%) Balsamiq
10 1 (0.33%) Cucumber
10 1 (0.33%) JUnit
10 1 (0.33%) SpecFlow
General
1 93 (30.49%) Social Skills
2 91 (29.84%) Finance
3 45 (14.75%) Front Office
4 35 (11.48%) Analytical Skills
5 32 (10.49%) Public Sector
6 30 (9.84%) Banking
7 18 (5.90%) Marketing
8 11 (3.61%) Inclusion and Diversity
9 9 (2.95%) Presentation Skills
9 9 (2.95%) Retail
10 8 (2.62%) Back Office
10 8 (2.62%) Legal
11 7 (2.30%) Manufacturing
11 7 (2.30%) Organisational Skills
11 7 (2.30%) Telecoms
12 6 (1.97%) Electronics
13 5 (1.64%) Documentation Skills
13 5 (1.64%) Investment Banking
13 5 (1.64%) Pharmaceutical
13 5 (1.64%) Wholesale Banking
Job Titles
1 55 (18.03%) Product Owner
2 54 (17.70%) Analyst
3 40 (13.11%) Business Analyst
4 36 (11.80%) Developer
5 33 (10.82%) Senior
6 25 (8.20%) Lead
7 22 (7.21%) Data Governance Analyst
7 22 (7.21%) Data Governance Manager
7 22 (7.21%) Governance Manager
8 19 (6.23%) Architect
9 16 (5.25%) .NET Developer
9 16 (5.25%) Product Manager
10 15 (4.92%) Programme Manager
11 14 (4.59%) Finance Manager
12 13 (4.26%) Consultant
12 13 (4.26%) Project Manager
13 12 (3.93%) Data Business Analyst
13 12 (3.93%) Software Engineer
14 11 (3.61%) C# Developer
14 11 (3.61%) Scrum Master
Libraries, Frameworks & Software Standards
1 30 (9.84%) .NET
2 15 (4.92%) React
2 15 (4.92%) REST
3 9 (2.95%) .NET Core
3 9 (2.95%) AngularJS
3 9 (2.95%) CSS
3 9 (2.95%) HTML
3 9 (2.95%) Kafka
4 8 (2.62%) OAuth
4 8 (2.62%) RESTful
5 7 (2.30%) ASP.NET
5 7 (2.30%) LDAP
5 7 (2.30%) Node.js
5 7 (2.30%) Playwright
5 7 (2.30%) SAML
6 6 (1.97%) .NET Framework
7 5 (1.64%) JSON
7 5 (1.64%) OpenFin
7 5 (1.64%) Redux
8 4 (1.31%) ADO
Miscellaneous
1 38 (12.46%) Derivative
1 38 (12.46%) Equities
1 38 (12.46%) Fixed Income
2 33 (10.82%) Foreign Exchange (FX)
3 32 (10.49%) Hedge funds
4 10 (3.28%) Cloud Native
5 8 (2.62%) Virtual Team
6 6 (1.97%) Analytical Mindset
6 6 (1.97%) Onboarding
7 5 (1.64%) Data Structures
7 5 (1.64%) Equity Derivative
7 5 (1.64%) Greenfield Project
8 4 (1.31%) Legacy Applications
8 4 (1.31%) Management Information System
8 4 (1.31%) Mobile App
9 3 (0.98%) Mainframe
9 3 (0.98%) Marketing Technology
9 3 (0.98%) Reinsurance
10 2 (0.66%) EPoS
10 2 (0.66%) PMI
Operating Systems
1 16 (5.25%) Linux
2 14 (4.59%) Windows
3 7 (2.30%) Unix
4 4 (1.31%) Amazon Linux
4 4 (1.31%) Android
4 4 (1.31%) Windows Server
5 2 (0.66%) Apple iOS
5 2 (0.66%) Windows 10
5 2 (0.66%) Windows 7
5 2 (0.66%) Windows XP
6 1 (0.33%) Mac OS
6 1 (0.33%) Red Hat Enterprise Linux
Processes & Methodologies
1 215 (70.49%) Agile
2 64 (20.98%) Scrum
3 63 (20.66%) Roadmaps
4 57 (18.69%) DevOps
5 56 (18.36%) User Stories
6 53 (17.38%) Problem-Solving
7 45 (14.75%) Stakeholder Management
7 45 (14.75%) User Experience
8 43 (14.10%) Migration
9 41 (13.44%) CI/CD
10 39 (12.79%) Continuous Improvement
11 37 (12.13%) Data Governance
11 37 (12.13%) Investment Management
12 35 (11.48%) Acceptance Criteria
13 34 (11.15%) Software Engineering
14 33 (10.82%) Kanban
14 33 (10.82%) Regulatory Compliance
15 30 (9.84%) Scaled Agile Framework
16 27 (8.85%) Project Management
17 26 (8.52%) Product Backlog
Programming Languages
1 33 (10.82%) SQL
2 29 (9.51%) C#
2 29 (9.51%) JavaScript
3 20 (6.56%) Python
4 19 (6.23%) PowerShell
5 16 (5.25%) Java
6 13 (4.26%) TypeScript
7 5 (1.64%) Rust
8 4 (1.31%) Scala
9 3 (0.98%) Go
10 2 (0.66%) Bash
10 2 (0.66%) Shell Script
11 1 (0.33%) ABAP
11 1 (0.33%) Apex Code
11 1 (0.33%) Kotlin
11 1 (0.33%) Ruby
11 1 (0.33%) T-SQL
Qualifications
1 31 (10.16%) Degree
2 24 (7.87%) Security Cleared
3 16 (5.25%) SC Cleared
4 11 (3.61%) Computer Science Degree
5 8 (2.62%) CISSP
6 6 (1.97%) Master's Degree
7 5 (1.64%) AWS Certification
7 5 (1.64%) CISM
8 4 (1.31%) PMI Certification
9 3 (0.98%) BPSS Clearance
9 3 (0.98%) CRISC
9 3 (0.98%) CSPO
10 2 (0.66%) AWS Certified Solutions Architect
10 2 (0.66%) Azure Certification
10 2 (0.66%) CISA
10 2 (0.66%) DV Cleared
10 2 (0.66%) IIBA
10 2 (0.66%) PMP
10 2 (0.66%) SAFe Agilist
11 1 (0.33%) ISTQB
Quality Assurance & Compliance
1 22 (7.21%) QA
2 21 (6.89%) Accessibility
3 6 (1.97%) PCI DSS
4 5 (1.64%) Data Quality
5 3 (0.98%) GDPR
5 3 (0.98%) ISO/IEC 27005
5 3 (0.98%) NIST
5 3 (0.98%) PMO
5 3 (0.98%) WCAG
6 2 (0.66%) MiFID
6 2 (0.66%) NIST 800
7 1 (0.33%) California Consumer Privacy Act
7 1 (0.33%) EMIR
7 1 (0.33%) GxP
7 1 (0.33%) ISO/IEC 27001
7 1 (0.33%) SLA
System Software
1 11 (3.61%) Docker
2 7 (2.30%) Active Directory
3 5 (1.64%) Virtual Machines
3 5 (1.64%) VMware Infrastructure
Systems Management
1 14 (4.59%) Terraform
2 11 (3.61%) Kubernetes
3 7 (2.30%) Single Sign-On
4 4 (1.31%) Ansible
5 3 (0.98%) HP ALM
6 2 (0.66%) Grafana
6 2 (0.66%) Progress Chef
7 1 (0.33%) Argo
7 1 (0.33%) HP Quality Center
7 1 (0.33%) Netcool
7 1 (0.33%) Prometheus
7 1 (0.33%) Puppet
7 1 (0.33%) SCCM
Vendors
1 32 (10.49%) Microsoft
2 15 (4.92%) SAP
3 11 (3.61%) Oracle
4 10 (3.28%) Salesforce
4 10 (3.28%) VMware
5 6 (1.97%) Databricks
5 6 (1.97%) Red Hat
6 5 (1.64%) ServiceNow
7 4 (1.31%) IBM
7 4 (1.31%) Splunk
8 3 (0.98%) Adobe
8 3 (0.98%) Ariba
8 3 (0.98%) HP
8 3 (0.98%) MuleSoft
8 3 (0.98%) Palantir
9 2 (0.66%) New Relic
9 2 (0.66%) Pega
9 2 (0.66%) SolarWinds
10 1 (0.33%) Alteryx
10 1 (0.33%) CyberArk